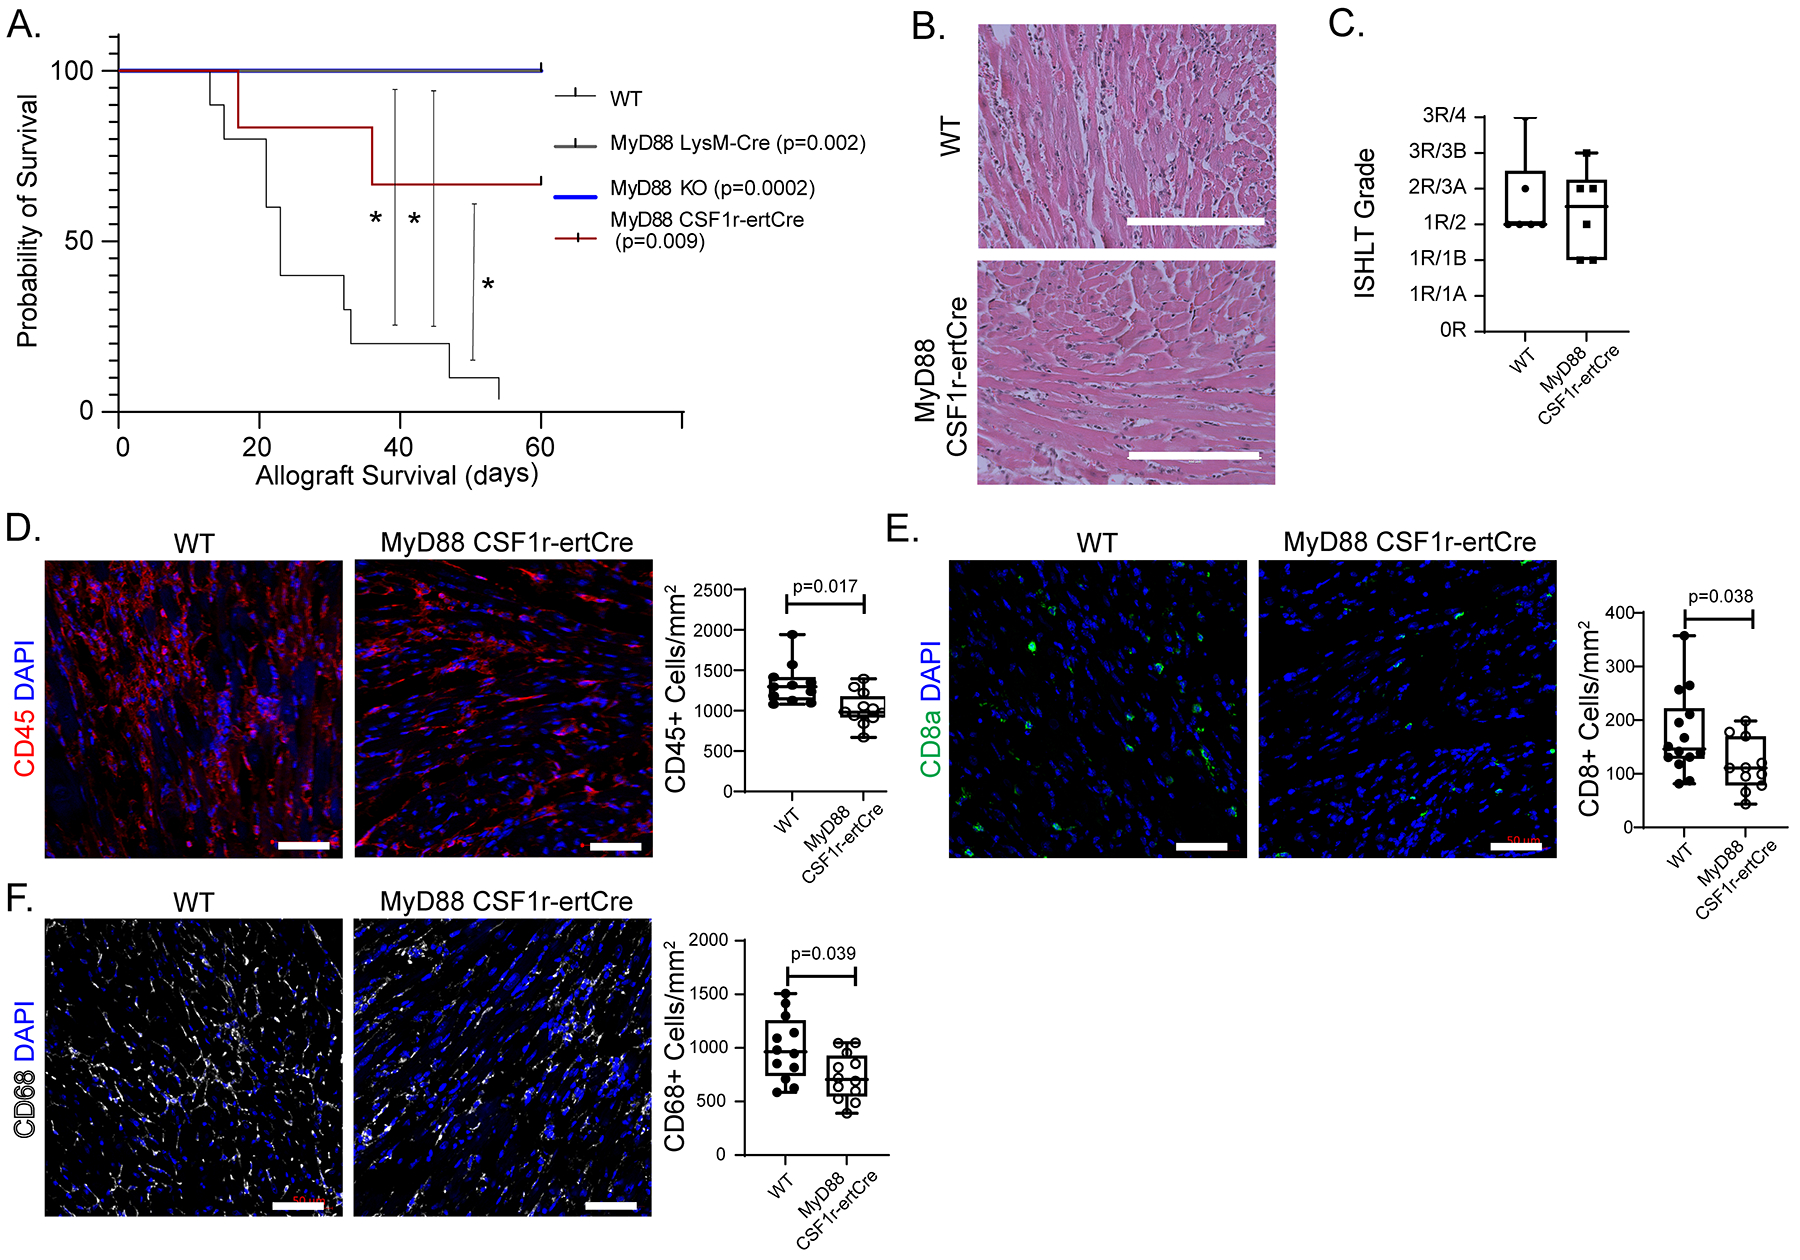
Figure 7: Donor macrophages signal through MyD88.

A) Kaplan-Meier survival curve with control (n = 10) versus MyD88f/f LysMCre/+ (Log-rank; p = 0.002, n = 4), MyD88f/f CSF1rertCre/+ (Log-rank; p = 0.009, n = 6), or MyD88−/− (“KO” Log-rank; p = 0.0002; n = 8) donor allografts (censored at 60 days). B) H & E staining of WT and MyD88f/f CSF1rertCre/+ allografts collected at post-transplant day 10. C) ISHLT cellular rejection scores comparing WT (n=12) and MyD88f/f CSF1rertCre/+ (n=12) hearts. D) CD45+ immunofluorescent staining of WT (n=12) and MyD88f/f CSF1rertCre/+ (n=12) hearts with quantification showing significant reduction in CD45+ cells/mm2 in MyD88f/f CSF1rertCre/+ hearts (1022 cells vs 1328 cells/mm2; Mann-Whitney U Test; p = 0.0017,) compared to littermate control. E) CD8a+ immunofluorescent staining of WT (n=14) and MyD88f/f CSF1rertCre/+ (n=11) hearts with quantification showing significant reduction in CD8a+ cells/mm2 in MyD88f/f CSF1rertCre/+ hearts (110 cells vs 146 cells/mm2; Mann-Whitney U Test; p = 0.038) compared to littermate control. F) CD68+ immunofluorescent staining of WT (n=12) and MyD88f/f CSF1rertCre/+ (n=12) hearts with quantification showing significant reduction in CD68+ cells/mm2 in MyD88f/f CSF1rertCre/+ hearts (705 cells vs 964 cells/mm2; Mann-Whitney U Test; p = 0.039,) compared to littermate control. Scale bar: B= 200 μm; D=50 μm.
