

Abstract
Background
Lucitanib is an oral, potent, selective inhibitor of the tyrosine kinase activity of vascular endothelial growth factor receptors 1‒3, fibroblast growth factor receptors 1‒3, and platelet-derived growth factor receptors alpha/beta.
Objective
We aimed to develop a population pharmacokinetics (PopPK) model for lucitanib in patients with advanced cancers.
Methods
PopPK analyses were based on intensive and sparse oral pharmacokinetic data from 5 phase 1/2 clinical studies of lucitanib in a total of 403 patients with advanced cancers. Lucitanib was administered at 5‒30 mg daily doses as 1 of 2 immediate-release oral formulations: a film-coated tablet or a hard gelatin capsule.
Results
Lucitanib pharmacokinetics were best described by a 2-compartment model with zero-order release into the dosing compartment, followed by first-order absorption and first-order elimination. Large between-subject pharmacokinetic variability was partially explained by body weight. No effects of demographics or tumor type on lucitanib pharmacokinetics were observed. The model suggested that the formulation impacted release duration (tablet, 0.243 h; capsule, 0.814 h), but the effect was not considered clinically meaningful. No statistically significant effects were detected for concomitant cytochrome P450 (CYP) 3A4 inhibitors or inducers, CYP2C8 or P-glycoprotein inhibitors, serum albumin, mild/moderate renal impairment, or mild hepatic impairment. Concomitant proton pump inhibitors had no clinically significant effect on lucitanib absorption.
Conclusions
The PopPK model adequately described lucitanib pharmacokinetics. High between-subject pharmacokinetic variability supports a safety-based dose-titration strategy currently being used in an ongoing clinical study of lucitanib to optimize drug exposure and clinical benefit.
Trial Registration
ClinicalTrials.gov Identifier: NCT01283945, NCT02053636, ISRCTN23201971, NCT02202746, NCT02109016.
Supplementary Information
The online version contains supplementary material available at 10.1007/s13318-022-00773-w.
Key Points
| Based on pharmacokinetic data from 5 phase 1/2 clinical studies of lucitanib in patients with advanced cancer, we show that a 2-compartment model with zero-order release into the dosing compartment adequately describes lucitanib pharmacokinetics. |
| A difference in release duration between lucitanib tablets and capsules was not considered clinically meaningful, and other covariates had no effect. |
| We observed high between-subject pharmacokinetic variability, suggesting that safety-based dose titration may optimize lucitanib exposure and maximize potential benefit for patients with advanced cancer. |
Introduction
Development of therapies targeting angiogenesis was initially proposed as a means to starve tumors of oxygen and nutrients, thereby inhibiting tumor progression [1]. However, more recent preclinical and clinical studies of anti-angiogenic agents have revealed that these therapies may exert their anticancer effects not only by blocking tumor-driven recruitment of blood vessels but also by promoting immune activation and normalizing existing vessels to allow for enhanced drug delivery and immune cell infiltration. These proposed mechanisms provide a rationale for combinations of existing anti-angiogenic agents with other targeted therapies, requiring a detailed understanding of the pharmacokinetic parameters associated with dosing and timing [2].
Lucitanib is a potent, oral, antiangiogenic tyrosine kinase inhibitor (TKI) that selectively inhibits vascular endothelial growth factor receptors 1‒3 (VEGFR1‒3), fibroblast growth factor receptors 1‒3 (FGFR1‒3), and platelet-derived growth factor receptors alpha and beta (PDGFRα/β). Preclinical investigation suggests that lucitanib has a favorable pharmacokinetic profile with high tumor accumulation and demonstrated antitumor activity as a single agent, and in combination with anti-programmed cell death receptor-1 (PD-1) therapy in tumor xenograft models [3, 4].
The safety, pharmacokinetics, and antitumor efficacy of lucitanib as a single agent or in combination with fulvestrant have been evaluated in patients with various tumor types (E-3810-I-01, CO-3810-025, FINESSE, E3810-II-02, INES; Table 1) [5–11]. Study E-3810-I-01 (NCT01283945) was a phase 1/2a dose-escalation and dose-expansion study evaluating the safety, efficacy, and pharmacokinetics of lucitanib monotherapy [6]. CO-3810-025 (NCT02202746) and FINESSE (CL2-80881-001/NCT02053636) were both phase 2 studies of lucitanib monotherapy in patients with metastatic breast cancer with or without FGFR1/FGF amplification [7, 9, 11]. Study E3810-II-02 (NCT02109016) was a phase 2, open-label study of lucitanib monotherapy in patients with advanced/metastatic lung cancer with FGF-, VEGF-, or PDGF-related genetic alterations [10]. INES (CL1-80881-001/ISRCTN23201971) was a phase 1b, multicenter, dose-allocation study of lucitanib and fulvestrant in patients with estrogen receptor-positive (ER+)/human epidermal growth factor receptor 2-negative (HER2-) metastatic breast cancer who had relapsed during or after treatment with fulvestrant [8].
Table 1.
Summary of clinical studies included in lucitanib PopPK analysis
| Study number | Patient population | Study design | Lucitanib dosing regimen | Pharmacokinetics sampling schedule |
|---|---|---|---|---|
| E-3810-I-01 (FIH), NCT01283945 [5, 6] | 134 patients with advanced and metastatic solid tumors | Phase 1/2a first-in-human, open-label, dose-escalation and dose-expansion study |
Dose-escalation phase: 5, 10, 12.5, 15, 20, or 30 mg lucitanib orally QD for 28 continuous days, fasted Dose-expansion phase: 10, 12.5, 15, or 20 mg lucitanib orally QD for 28 continuous days; fasted 15 mg lucitanib orally QD for 5 days on/2 days off or 21 days on/7 days off in 28-day cycles Capsules of 2.5-, 5-, 10-, 30-, and 50-mg strengths |
All dosing schedules: pre-dose and 1, 2, 3, 4, 6,a 8, 12, and 24 h post-dose on Day 1 in addition to individual schedules below Continuous dosing: 12.5-mg dose: pre-dose and 1, 2, 3, 4, 8, 12, and 24 h post-dose on Day 15 + pre-dose on Day 29 All other doses: pre-dose and 1, 2, and 4 h post-dose on Days 7 and 28 + pre-dose on Days 4, 14, and 21 5 days on/2 days off: pre-dose and 1, 2, 3, 4, 6, 8, and 12 h post-dose on Day 26 + pre-dose on Days 5, 8, 12, 15, 22, and 27 21 days on/7 days off: pre-dose and 1, 2, 3, 4, 6, 8, and 12 h post-dose on Day 21 + pre-dose on Days 4, 7, 14, 22, 23, and 29 |
| CL2-80881-001 (FINESSE), NCT02053636 [7] | 76 patients with FGFR1-amplified or non-amplified ER+ and HER2- metastatic breast cancer | Phase 2 open-label, 3-cohort, multicenter, 2-stage study |
15 mg lucitanib orally QD until unacceptable toxicity, disease progression, or withdrawal of consent Capsules of 2.5-, 5-, and 10-mg strengths; tablets of 5- and 7.5-mg strengths |
Pre-dose on Cycle 1 Day 14 and Cycle 2 Day 28 |
| CL1-80881-002 (INES), ISRCTN23201971 [8] | 18 patients with ER+/HER2- and either FGFR1-amplified or FGFR1-non-amplified metastatic breast cancer | Phase 1b dose-allocation study with fulvestrant |
10 or 12.5 mg lucitanib orally QD in combination with 500 mg intramuscular fulvestrant (once per cycle) until unacceptable toxicity, disease progression, or withdrawal of consent Capsules of 2.5-, 5-, and 10-mg strengths |
Cycle 1, Day 15: pre-dose and 1, 2, 3, 4, 8, 12, and 24 h post-dose Cycle 2, Day 1: pre-dose and 1, 2, 3, 4, and 8 h post-dose Cycle 2, Day 15: pre-dose Cycle 3, Day 1: pre-dose |
| CO-3810-025, NCT02202746 [9, 11] | 178 patients with metastatic FGFR1-amplified, FGF-amplified or FGFR1/FGF non-amplified breast cancer | Phase 2 open-label, safety and efficacy study |
Cohort A (FGFR1- and/or 11q-amplified patients): 10 mg lucitanib orally QD Cohort B (FGFR1- or 11q-amplified patients): 15 mg lucitanib orally QD Cohort C (FGFR1/11q-non-amplified): 10 or 15 mg lucitanib orally QD All doses given until unacceptable toxicity, disease progression, or withdrawal of consent Capsules of 2.5-, 5-, and 10-mg strengths; tablets of 5- and 7.5-mg strengths |
All patients: pre-dose on Cycle 1 Day 15 and Day 1 of Cycles 2, 3, and 5; 1 additional sample 1–3 h post-dose on Cycle 2 Day 1 Pharmacokinetics substudy (Cohorts A and C): pre-dose and 0.25, 0.5, 1, 1.5, 2.5, 4, 6, 8, 10, and 24 h post-dose on Days -7 and 1 |
| E3810-II-02, NCT02109016 [10] | 18 patients with advanced/metastatic lung cancer and FGF, VEGF, or PDGF-related genetic alterations | Phase 2 open-label, multicenter, single-arm study |
10 mg lucitanib orally QD until unacceptable toxicity, disease progression, or withdrawal of consent Capsules of 2.5-, 5-, and 10-mg strengths; tablets of 5- and 7.5-mg strengths |
Cycle 1, Day 14: pre-dose and 2 h post-dose Cycles 1, 2, and 3; Day 28: pre-dose |
ER+ estrogen receptor-positive, FGF fibroblast growth factor, FGFR1 FGF receptor 1, FIH first-in-human, FPFV first patient; first visit, HER2- human epidermal growth factor receptor 2-negative, PDGF platelet-derived growth factor, PopPK population pharmacokinetics, QD once daily, VEGF vascular endothelial growth factor
aTimepoint is not applicable for patients receiving 12.5-mg dose on continuous schedule
Consistent with the pharmacokinetics of many other TKIs [12], high between-subject variability (BSV) is observed with lucitanib exposure [6]. High BSV in absorption and/or disposition kinetics for therapeutic agents can be attributed to a variety of intrinsic and extrinsic factors [e.g., body weight, transporter efflux, and metabolism, organ function, and interactions with food or other medications, such as proton pump inhibitors (PPIs)] [12, 13]. Pharmacokinetic variability can result in adverse effects or suboptimal therapeutic efficacy and may require precision dosing based on individual characteristics, such as body weight or organ function [13]. Safety-based or pharmacodynamically guided dose titration has been explored for several VEGFR or multikinase inhibitors, including axitinib, erdafitinib, lenvatinib, and regorafenib [14–17].
Here, we present a population pharmacokinetics (PopPK) model developed using pooled pharmacokinetic data from the 5 clinical trials described above. The objectives of this analysis were to characterize the pharmacokinetics of lucitanib in patients with advanced cancers and to evaluate the effect of covariates on the variability of lucitanib pharmacokinetics, in order to better understand the high BSV observed in clinical studies.
Methods
Clinical Studies
Five clinical studies of lucitanib in patients with advanced cancers were included in the PopPK analysis (Table 1). All procedures performed in studies involving human participants were in accordance with the ethical standards of the institutional and/or national research committee, and with the 1964 Helsinki Declaration and its later amendments or comparable ethical standards. All studies were approved by an Institutional Review Board or Independent Ethics Committee. Written informed consent was obtained from each patient in all studies prior to participation.
Lucitanib (Clovis Oncology, Inc., Boulder, CO, USA) was administered orally at doses ranging from 5 to 30 mg once daily (QD) on a continuous schedule, or at 15 mg QD on 2 different intermittent schedules [5 days on treatment and 2 days off (5/2) or 21 days on treatment and 7 days off (21/7)] in 28-day cycles. Two immediate-release oral formulations, a film-coated tablet and a hard gelatin capsule, were used (see Table 1 for regimens and formulations used in each study). Intensive pharmacokinetic sampling was conducted for selected studies during the first dose cycle, and sparse sampling was conducted for up to 5 cycles. For evaluation of the effects of formulation on lucitanib pharmacokinetics, post hoc comparisons were limited to patients who received both formulations.
Assumptions
The allometric exponent was fixed to 1.0 for the relationship between body weight and volume terms and was fixed to 0.75 for the relationship between body weight and clearance terms.
Bioanalysis
Blood samples were collected in lithium heparin tubes, and processed to obtain plasma within approximately 30 min of collection. Lucitanib was extracted from plasma by protein precipitation and quantified using validated liquid chromatography‒tandem mass spectrometry methods [18]. The calibration range was 2.00‒500 ng/mL [lower limit of quantification (LLOQ), 2.00 ng/mL].
Pharmacometric Modeling
Modeling was performed using Nonlinear Mixed-Effects Model (NONMEM) v.7.4.3 (ICON Development Solutions, Ellicott City, MD, USA) with the First Order Conditional Estimation with Interaction (FOCE-I). These methods are commonly known by their abbreviations estimation method. Graphical analyses were conducted with RStudio v.1.2.5033 and R version 3.5. Goodness-of-fit (GoF) plots were generated with Xpose v.0.4.11, and visual predictive checks (VPCs), and bootstrap analyses were conducted using Perl-speaks-NONMEM (PsN) v.4.8.1. Hypotheses were generated based on biological plausibility and diagnostic graphics.
Base Model
Based on visual inspection of observed concentration–time datasets, a 2-compartment model with first-order absorption and first-order elimination was used as a starting point for the structural model. 1, 2-, and 3-compartment models were fit to lucitanib concentration‒time data, with the absorption process modeled as either traditional first-order absorption or zero-order release to the dosing compartment, followed by first-order absorption. BSV was assessed for duration of zero-order release (D1), first-order absorption rate constant (Ka), intercompartmental clearance/bioavailability (Q/F), apparent central volume (Vc/F), apparent peripheral volume (Vp/F), and apparent clearance (CL/F). Covariance between the random effects on Vc/F and CL/F of the central compartment was also assessed. Residual error was modeled as either a combined additive and proportional error model or a proportional error model only. Interoccasion variability was assessed for D1 and CL/F for each cycle.
To account for variability in patient weight for dosing, fixed allometric scaling exponents for body weight were assumed for all clearance and volume terms without statistical testing. This assumption was later confirmed to be appropriate based on a sensitivity analysis conducted on the final model with and without the allometric scaling components. The use of weight as opposed to body surface area for allometric scaling was also tested to ensure that the assumption was appropriate.
Covariate Model
To identify potential covariates for statistical testing, an exploratory analysis was first carried out by inspection of plots of post hoc estimates of CL/F and Vc/F versus covariates. All covariates were included in the dataset as time-varying. For plots that suggested a relationship, statistical testing was conducted for the specified covariate using a stepwise forward-addition/backward-elimination process. Individual covariates were retained in the model during forward addition based on a decrease in objective function value (OFV) of at least 6.635 (P ≤ 0.01, 1 degree of freedom) or an improvement in diagnostic plots. During backward elimination, covariates resulting in a minimum OFV increase of 10.828 (P ≤ 0.001, 1 degree of freedom) were retained. Exploratory hypotheses that were examined are described in Table 2.
Table 2.
Exploratory covariate analysis for the lucitanib PopPK model
| Parameter | Covariate effect | Analysis |
|---|---|---|
| CL/F | Fulvestrant co-administration (INES study only) | Visually inspected; no significant trends |
| Dose | Visually inspected; no significant trends | |
| Concomitant medications (P-gp, CYP3A4, CYP2C8 inhibitors/inducers) | Statistically tested; CYP3A4 was visually inspected only due to limited data | |
| Age | Visually inspected; no significant trends | |
| CLCR (Cockcroft–Gault) or eGFR (MDRD) | Visually inspected; no significant trends | |
| Renal function (categorical groups) | Statistically tested | |
| Hepatic laboratory parameters (ALT, AST, BILI, etc.) | Statistically tested | |
| Hepatic function (categorical, based on NCI) | Statistically tested | |
| ALB | Statistically tested | |
| Tumor type (by study), confounded with study effect | Visually inspected; no significant trends | |
| Random between-occasion effect, defined for each cycle | Statistically tested | |
| Sex, race, or ethnicity | Visually inspected; no significant trends | |
| Vc/F | ALB | Statistically tested |
| Sex, race, or ethnicity | Visually inspected; no significant trends | |
| F, D1 | Formulation (tablet vs. capsule) | Statistically tested |
| Ka | Concomitant PPI | Statistically tested and assessed for clinical significance |
| Major pharmacokinetic parameters | Sex, race, or ethnicity on clearance and volume of distribution | Visually inspected; no significant trends |
ALB serum albumin, ALT alanine aminotransferase, AST aspartate aminotransferase, BILI bilirubin, CL/F apparent clearance, CLCR creatinine clearance, CYP cytochrome P450, D1 release duration, eGFR estimated glomerular filtration rate, F relative bioavailability, MDRD modification of diet in renal disease, NCI National Cancer Institute, P-gp P-glycoprotein, PopPK population pharmacokinetics, PPI proton pump inhibitor, Vc/F apparent central volume
Model Diagnostics
Base, covariate, and final models were selected based on OFV, parameter precision, and diagnostic plots (including both GoF plots and VPCs). For VPCs, 1000 simulations were performed with the selected model, and the results were graphically compared to the observed data based on the median and 95% prediction interval. VPC output was stratified by study to evaluate model fit for individual studies. Robustness of the model was assessed by bootstrapping (1000 replicates, with replacement).
Results
Data Summary
A total of 3540 pharmacokinetic records from 403 patients with advanced cancers enrolled in 5 clinical studies were included in the dataset for analysis. Two samples below the LLOQ were excluded. Baseline demographics and summary of covariates by study are presented in Table 3.
Table 3.
Summary of covariates and patient demographics
| Characteristic | Statistic | E-3810-I-01 | FINESSE CL2-80881-01 |
INES CL1-80881-02 |
CO-3810-025 | E3810-II-02 | All studies |
|---|---|---|---|---|---|---|---|
| Age (years) | n | 134 | 72 | 17 | 164 | 16 | 403 |
| Median (min, max) | 55.0 (34.0, 80.0) | 54.5 (26.0, 78.0) | 66.0 (46.0, 78.0) | 55.0 (27.0, 82.0) | 61.5 (47.0, 76.0) | 55.0 (26.0, 82.0) | |
| ALB (g/mL) | n | 133 | 71 | 17 | 163 | 14 | 398 |
| Median (min, max) | 3.80 (1.60, 5.10) | 4.20 (2.80, 4.80) | 4.00 (3.30, 4.40) | 4.10 (2.60, 4.90) | 3.75 (2.70, 4.80) | 4.00 (1.60, 5.10) | |
| ALT (U/L) | n | 134 | 72 | 17 | 163 | 14 | 400 |
| Median (min, max) | 19.5 (5.00, 126) | 26.5 (9.00, 194) | 24.0 (12.0, 79.0) | 23.0 (6.00, 199) | 20.5 (6.00, 59.0) | 23.0 (5.00, 199) | |
| AST (U/L) | n | 134 | 72 | 17 | 164 | 14 | 401 |
| Median (min, max) | 24.0 (11.0, 159) | 30.0 (14.0, 137) | 29.0 (15.0, 87.0) | 30.0 (11.0, 198) | 20.5 (11.0, 44.0) | 28.0 (11.0, 198) | |
| BILI (mg/dL) | n | 133 | 72 | 17 | 163 | 14 | 399 |
| Median (min, max) | 0.526 (0.175, 1.57) | 0.500 (0.100, 1.35) | 0.462 (0.234, 0.877) | 0.400 (0.100, 3.00) | 0.532 (0.211, 1.10) | 0.500 (0.100, 3.00) | |
| BMI (kg/m2) | n | 133 | 70 | 17 | 162 | 16 | 398 |
| Median (min, max) | 24.4 (16.9, 42.4) | 25.4 (16.7, 36.6) | 26.6 (17.6, 43.8) | 25.1 (15.7, 51.0) | 25.6 (18.6, 31.9) | 24.9 (15.7, 51.0) | |
| CLCR (mL/min) | n | 134 | 72 | 17 | 164 | 14 | 401 |
| Median (min, max) | 97.2 (39.7, 268) | 90.4 (50.1, 193) | 95.2 (34.5, 168) | 94.8 (42.9, 201) | 99.1 (68.2, 125) | 95.1 (34.5, 268) | |
| Weight (kg) | n | 134 | 72 | 17 | 164 | 16 | 403 |
| Median (min, max) | 68.0 (45.0, 150) | 66.4 (45.0, 105) | 72.0 (38.0, 115) | 67.2 (35.9, 159) | 76.2 (50.0, 90.0) | 67.5 (35.9, 159) | |
| Sex (male:female) | n | 60:74 | 0:72 | 0:17 | 0:164 | 11:5 | 71:332 |
| Race (White:Black:Asian:other) | n | 122:1:1:10 | 59:3:3:7 | 17:0:0:0 | 138:9:6:11 | 3:3:0:10 | 339:16:10:38 |
| Hepatic function group (normal:mild:moderate:missing)a | n | 105:28:0:1 | 57:15:0:0 | 15:2:0:0 | 127:35:1:1 | 14:0:0:2 | 318:80:1:4 |
| Renal function group (normal:mild:moderate:missing)b | n | 78:41:15:0 | 36:30:6:0 | 9:7:1:0 | 89:57:18:0 | 8:6:0:2 | 220:141:40:2 |
| Use of P-gp inhibitor (no:yes) | n | 126:8 | 71:1 | 17:0 | 155:9 | 13:3 | 382:21 |
| Use of PPI (no:yes) | n | 68:66 | 40:32 | 17:0 | 116:48 | 10:6 | 251:152 |
| Use of CYP3A4 inhibitor (no:yes) | n | 130:4 | 69:3 | 17:0 | 160:4 | 15:1 | 391:12 |
| Use of CYP2C8 inhibitor (no:yes) | n | 130:4 | 71:1 | 17:0 | 155:9 | 16:0 | 389:14 |
ALB serum albumin, ALT alanine aminotransferase, AST aspartate aminotransferase, BILI bilirubin, BMI body mass index, CLCR creatinine clearance, CYP cytochrome P450, min minimum, max maximum, P-gp P-glycoprotein, PPI proton pump inhibitor
aHepatic function group, as defined by the National Cancer Institute (NCI) Organ Dysfunction Working Group (ODWG) [24]
bRenal function group, as defined by Food and Drug Administration (FDA) guidance in patients with impaired renal function [25]
Pharmacokinetic Model Development
The pharmacokinetics of lucitanib were best described by a 2-compartment model with a zero-order release into the dosing compartment, followed by first-order absorption and first-order elimination. BSV was included for central CL/F and Vc/F, as well as D1 and Vp/F. Residual error was described by a proportional error model.
Covariates identified for statistical testing based on visual assessment are listed in Table 2. Addition of formulation and effects of concomitant PPIs on bioavailability (F) or cytochrome P450 (CYP) 2C8 inhibitors and renal function group effects on CL/F did not significantly improve model fit (ΔOFV < 6.636). Effects of formulation on D1, P-glycoprotein (P-gp) inhibitors on CL/F, and serum albumin on Vc/F were statistically significant, and were included during forward addition. The latter 2 covariates were rejected in backward elimination (ΔOFV < 10.828; Supplementary Table 1). Therefore, the final model included only 1 covariate: effect of formulation on D1, for which capsule release was relatively slow compared to tablet release. Given that elimination of lucitanib has been shown to be slow (half-life ~ 31‒40 h) [6], the effect of different D1 times on maximum plasma drug concentration (Cmax) is unlikely to be clinically significant. Weight was also included in the final model for scaling of CL/F and Q/F (fixed exponent, 0.75) and Vc/F and Vp/F (fixed exponent, 1.0). We did not identify any other covariates that significantly improved the model fit. Plots of post hoc random effects values for pharmacokinetic parameters (ETA in NONMEM modeling language) versus dose (Supplementary Fig. S1) were consistent with dose proportionality from 5 to 30 mg lucitanib based on visual inspection (Supplementary Fig. S1). With regard to any effect of concomitant PPI use, 112 of 403 patients (28%) had at least 1 observation or dose with concomitant PPI. Of these 112 individuals, 97 had concomitant PPI for all reported events (representing 83% of all doses and observations). Among the patients who had at least 1 dose or concentration with concomitant PPI, the mean fraction of events with concomitant PPI was 91%, and the median was 100%. A VPC of plasma lucitanib concentration during the early post-dose period (0–10 h post dose) with or without concomitant PPI is shown in Supplementary Fig. S4. A diagram of the final model structure is shown in Fig. 1.
Fig. 1.
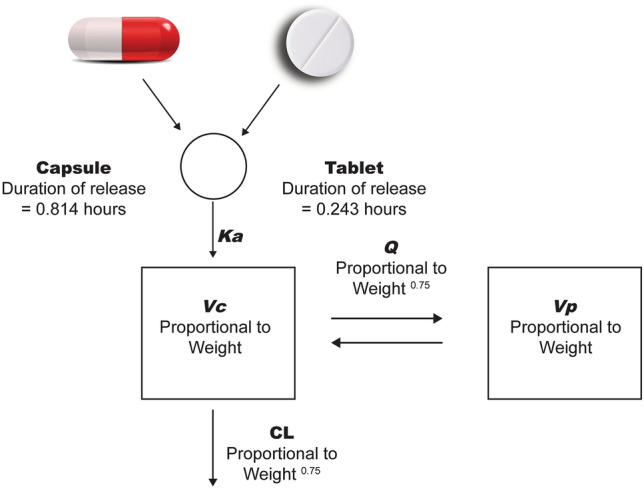
PopPK model structure. The pharmacokinetics of lucitanib were described by a 2-compartment linear model with a zero-order release into the dosing compartment, followed by first-order absorption and first-order elimination. Volume (Vc, Vp) and clearance (Q, CL) terms were proportional to Weightexponent (a power model of weight with exponents fixed to 1 for volume terms and 0.75 for clearance terms). Duration of release from the tablet formulation (0.243 h) differed from the capsule (0.814 h). CL clearance, Ka first-order absorption rate constant, PopPK population pharmacokinetics, Q intercompartmental clearance, Vc central volume, Vp peripheral volume
Lucitanib pharmacokinetic parameter estimates obtained using the final PopPK model were consistent with bootstrap results (Table 4). Diagnostic plots (Figs. 2, 3; Supplementary Fig. S2) also indicated that the final model described the observed lucitanib concentration–time data. Parameters were estimated with good precision, with relative standard error (RSE) from NONMEM output < 23% for all parameters. The RSE estimates were consistent with the confidence intervals (CI) from the bootstrap estimates (Table 4).
Table 4.
NONMEM parameter estimates and estimates from a nonparametric bootstrap for the PopPK model of lucitanib
| PopPK model parameter | Estimate (% RSE) | Bootstrap median (2.5th, 97.5th percentile) |
|---|---|---|
| Apparent clearance, CL/F (L/h/70 kg) | 1.90 (2.75%) | 1.90 (1.80, 2.00) |
| Apparent central volume, Vc/F (L/70 kg) | 63.8 (5.08%) | 63.4 (57.3, 70.6) |
| First-order absorption rate constant, Ka (1/h) | 4.86 (12.6%) | 4.77 (2.94, 8.21) |
| Apparent distribution clearance, Q/F (L/h/70 kg) | 6.23 (8.41%) | 6.30 (5.29, 7.72) |
| Apparent peripheral volume, Vp/F (L/70 kg) | 69.1 (6.81%) | 68.9 (61.0, 79.1) |
| Duration of constant release into depot for capsule, D1 (h) | 0.814 (22.2%) | 0.812 (0.629, 0.956) |
| Effect of formulation on D1 (tablet to capsule ratio) | 0.299 (19.4%) | 0.343 (0.178, 0.630) |
| Effect of weight on CL/F and Q/F with equation (weight/70)0.75 | Fixed exponent of 0.75 | – |
| Effect of weight on Vc/F and Vp/F with equation (weight/70)1 | Fixed exponent of 1 | – |
| CL/F BSV (log-proportional, %) | 47.8% (5.69%) | 47.5% (42.8%, 53.2%) |
| Vc/F BSV (log-proportional, %) | 58.6% (6.97%) | 58.9% (51.3%, 67.5%) |
| CL/F and Vc/F correlation | 0.596 (6.30%) | 0.595 (0.469, 0.721) |
| D1 BSV (log-proportional, %) | 60.1% (18.6%) | 58.7% (41.3%, 75.8%) |
| Vp/F BSV (log-proportional, %) | 76.7% (9.10%) | 75.2% (60.0%, 88.8%) |
| Residual error (proportional, %) | 33.6% (2.30%) | 33.5% (32.0%, 34.8%) |
BSV between-subject variability, CL/F apparent clearance, D1 release duration, Ka first-order absorption rate constant, NONMEM Nonlinear Mixed-Effects Model, PopPK population pharmacokinetics, Q/F apparent distribution clearance, RSE relative standard error, Vc/F apparent central volume, Vp/F apparent peripheral volume
Fig. 2.

Goodness-of-fit plots for the final lucitanib PopPK model. a Population prediction (ETA = 0) versus observed; b individual prediction (ETA ≠ 0) versus observed; c prediction versus conditional weighted residual; and d time versus conditional weighted residual. Blue lines indicate smoothed means (locally estimated scatterplot smoothing, LOESS [34]). Black trend lines indicate lines of unity (intercept = 0, slope = 1). Observations (concentrations or residuals, black dots) from the same individual are connected by black lines. ETA random effects values for pharmacokinetic parameters, PopPK population pharmacokinetics
Fig. 3.

Visual predictive check for the final lucitanib PopPK model: time since first dose versus lucitanib concentration. PopPK population pharmacokinetics
To further examine the effect of formulation (tablet vs. capsule) on the rate and extent of absorption, we plotted the conditional weighted residuals by formulation (Fig. 4) and post hoc estimates of Ka and CL/F BSV by formulation (Figs. 5, 6). An additional model was run with a between-occasion variation term to generate post hoc ETA values for Ka and CL/F by formulation, in which the occasions were defined by the formulation. All plots examining the effect of formulation on rate and extent of absorption suggested that the difference is well described by the effect of formulation on duration of the zero-order release (D1 parameter in NONMEM), which showed a difference of < 0.6 h in duration of release for the 2 formulations (D1, 0.243 h vs. 0.814 h for the tablet and capsule, respectively; Fig. 1). The model development table is provided in Table 4.
Fig. 4.
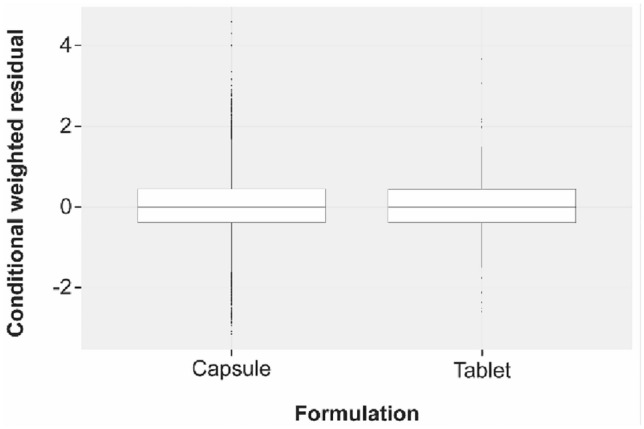
Conditional weighted residuals by formulation. Black horizontal lines represent median values, and boxes correspond to the ranges of the first and third quartiles. Upper and lower whiskers extend from the box to the largest or smallest value, respectively, within 1.5 times the interquartile range. Observations outside the whisker range are represented as dots
Fig. 5.

Post hoc estimates of BSV of Ka by formulation. Black horizontal lines represent median values, and boxes correspond to the ranges of the first and third quartiles. Upper and lower whiskers extend from the box to the largest or smallest value, respectively, within 1.5 times the interquartile range. Observations outside the whisker range are represented as dots. BSV between-subject variability, ETA random effects values for pharmacokinetic parameters, Ka first-order absorption rate constant
Fig. 6.
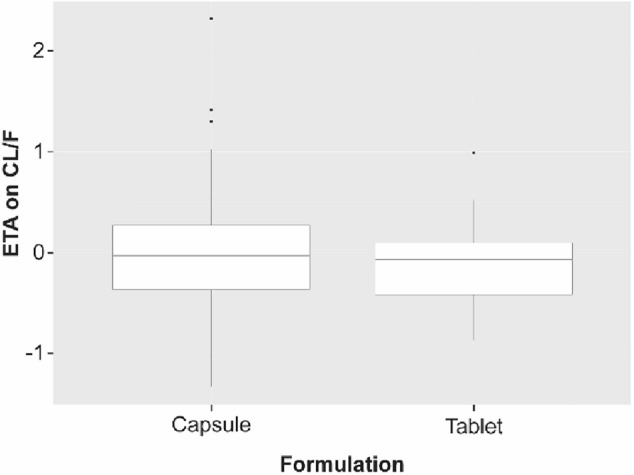
Post hoc estimates of BSV of CL/F by formulation. Black horizontal lines represent median values, and boxes correspond to the ranges of the first and third quartiles. Upper and lower whiskers extend from the box to the largest or smallest value, respectively, within 1.5 times the interquartile range. Observations outside the whisker range are represented as dots. BSV between-subject variability, CL/F apparent clearance, ETA random effects values for pharmacokinetic parameters
Discussion
In this study, we have developed a PopPK model for lucitanib based on data from 5 clinical trials in patients with advanced cancer (Table 1). Lucitanib pharmacokinetics were adequately described by a 2-compartment model with zero-order release into the dosing compartment, followed by first-order absorption and first-order elimination. The only statistically significant covariate was formulation, which had an effect on duration of release. D1 was 70% shorter for tablets versus capsules. While the effect was precisely estimated (RSE, 19.4%) and statistically significant, this estimate should be interpreted with caution, as limited data were available in this zero-order release phase. Because both formulations were developed for immediate release with very short D1 values (< 1 h) relative to the slow elimination of lucitanib (half-life, ~ 31‒40 h) [6], the formulation difference did not translate into a clinically meaningful difference in the pharmacokinetic profile. As area under the curve (AUC) would not be influenced by the duration of zero-order release, and given the relatively rapid zero-order release and first-order absorption compared to elimination, the effect on Cmax was minimal and not clinically significant. An effect of body weight on volume and clearance terms was also assumed in the final model and was later confirmed to be appropriate using a sensitivity analysis. To accommodate the effects of weight, CL/F, Q/F, Vc/F, and Vp/F were defined as a power model of weight with exponents fixed to 0.75 (for clearance terms) and 1.0 (for volume terms). This step resolved the bias observed in plots of post hoc ETA for CL/F, Vc/F, D1, and Vp/F (Supplementary Fig. S3), and resulted in a 49-point reduction in the OFV (Supplementary Table 1).
We did not observe any effects of age, sex, race, ethnicity, or tumor type (by study) on lucitanib pharmacokinetics in this analysis. While effects of P-gp inhibitors on CL/F and serum albumin on Vc/F were suggested by visual analysis, further analysis showed that these effects were not statistically significant. As a result, these covariates were not included in the final PopPK model. Although limited data on concomitant use of CYP3A4 inhibitors and inducers precluded development of statistical conclusions, the results from this analysis did not show an effect of CYP3A4 and CYP2C8 inhibitors on lucitanib pharmacokinetics. In the case of CYP3A4, 46 observations from 11 patients with known concomitant inhibitors and 4 observations from 1 patient with a known concomitant inducer were included in the dataset. For CYP2D8, 118 observations from 14 patients with a known concomitant inhibitor were included in the dataset. Due to limited data, the P-gp, CYP2D8, and CYP3A4 results must be viewed as exploratory.
A number of TKIs have pH-dependent solubility, and co-administration with PPIs has been demonstrated to decrease TKI exposure in some cases [19–21]. Thus, understanding the effect of concomitant PPI administration on lucitanib pharmacokinetics is important to evaluate clinical impact on efficacy and safety. More patients in the study population were receiving concomitant PPIs (n = 152) compared to CYP3A4 (n = 12) or CYP2C8 (n = 14) inhibitors, yielding a more robust result showing an effect (ratio of F with concomitant PPI/without PPI) that was estimated with good precision (RSE 6.53%), though not significant (95% CI 0.83–1.08). Furthermore, the estimated effect size (6.5% reduction in F) was not clinically significant. The exploratory analysis suggested an effect of PPI on Ka (Supplementary Table 1). While the effect was statistically significant, it should be noted that the absorption profile is driven largely by the zero-order duration of release (D1 0.814 and 0.243 h for capsule and tablet, respectively), not by the relatively rapid first-order absorption process (Ka 4.86; absorption half-life 0.143 h). Consistently, diagnostic plots (VPCs) for models with and without PPI effect on Ka showed similar fits and suggested that concomitant PPI had no apparent effect on the overall pharmacokinetic profile (Supplementary Fig. S5). Thus, PPI was not included as a parameter in the final model. The effect of PPIs on lucitanib pharmacokinetics will be further assessed with emerging clinical data.
We also assessed lucitanib pharmacokinetic parameters in patients with varying degrees of renal and hepatic function. In comparison to patients with normal renal and hepatic function, no statistically significant or clinically meaningful pharmacokinetic differences (≤ 20%) were observed for patients with mild renal impairment [n = 141; creatinine clearance (CLCR) 60–89 mL/min], moderate renal impairment (n = 40; CLCR 30–59 mL/min), or mild hepatic impairment [n = 80; total bilirubin ≤ upper limit of normal (ULN) and aspartate aminotransferase (AST) > ULN, or total bilirubin 1–1.5× baseline and any AST level] [22, 23]. Patients with severe renal impairment or moderate or severe hepatic impairment were not included in this analysis (Table 3).
The current PopPK model is based on clinical studies of lucitanib monotherapy, as well as combination therapy with fulvestrant. In vitro studies have shown that lucitanib is equally metabolized by CYP2C8 and CYP3A4 (data on file. Clovis Oncology, Inc.). Fulvestrant did not significantly inhibit the major CYP isoenzymes, including CYP3A4 in vitro, nor did it change the exposure to a CYP3A substrate (i.e., midazolam in humans) [24]. No known drug–drug interactions have been reported for fulvestrant [24, 25]. Consistent with these data, the current PopPK model based on 5 clinical studies suggests that co-administration of fulvestrant has no effect on lucitanib pharmacokinetics, although the number of patients with concomitant fulvestrant was small (17 of 403).
Data from clinical trials have revealed high BSV with lucitanib pharmacokinetics [6, 26, 27]. Although the PopPK model developed in this study fits concentration–time data and estimated pharmacokinetic parameters with good precision, the covariates included in the model only explained a small part of the observed pharmacokinetic variability. In the present dataset, body weight explained 9.5% of the variance in CL/F and 11% of the variance in Vc/F.
As large variability in pharmacokinetic and pharmacodynamic responses can lead to suboptimal clinical efficacy and significant adverse effects [13], individualized dose titration is a rational approach for managing tolerability and maximizing efficacy of kinase inhibitors with high pharmacokinetic variability. For example, a retrospective analysis based on pooled data from 3 phase 2 studies of axitinib, a VEGFR inhibitor with high pharmacokinetic variability [28], showed that individualized treatment through a safety-based dose titration strategy improved efficacy and resulted in more consistent exposure across patients with metastatic renal cell carcinoma (mRCC) [14]. This dose titration strategy has been applied in subsequent clinical trials, including a phase 2 dose titration study of axitinib in patients with mRCC [29]. Dose titration of axitinib is also recommended in combinations with pembrolizumab or avelumab approved for treatment of patients with advanced RCC [30, 31]. Safety-based or pharmacodynamically guided dose titration strategies have also been explored for other multikinase inhibitors, such as regorafenib, lenvatinib, and erdafitinib [15–17].
The results from this PopPK model suggest that individualization of the dosing regimen based on safety could optimize the benefit:risk ratio for lucitanib. The phase 1b/2 LIO-1 study (NCT04042116) is exploring whether lucitanib-mediated inhibition of angiogenesis can enhance the antitumor activity of the anti-PD-1 inhibitor nivolumab in patients with advanced solid tumors [27, 32]. Initial pharmacokinetic analyses in 14 patients enrolled in LIO-1 have revealed a pharmacokinetic profile consistent with lucitanib monotherapy, including relatively high BSV [27]. Based on this observation, and no evidence of differential safety across dose levels in phase 1b [27, 32], a safety-based dose titration strategy has been recommended for the individualization of lucitanib dosing in patients with endometrial cancer, ovarian cancer, cervical cancer, or endometrial/ovarian clear-cell cancers in the phase 2 expansion cohorts. Over the course of treatment, patients who tolerate lucitanib for ≥ 28 days with no grade > 2 treatment-related adverse events, no proteinuria > 1 + (or urinary protein > 1.0 g/24 h), no grade > 1 treatment-related diarrhea, and blood pressure ≤ 150/90 mmHg not requiring any antihypertensive agents (or changes to pre-existing antihypertensive regimens if blood pressure is stable and well-controlled at baseline) may undergo dose escalation from 6 mg to 8 mg to 10 mg at subsequent cycles, provided that ≤ 2 cycles have elapsed between escalations [32, 33]. Initial phase 2 data from LIO-1 suggest that this safety-based dose-titration strategy is feasible with lucitanib [32].
Conclusions
The results from this study showed that a 2-compartment PopPK model with zero-order release into the dosing compartment adequately describes the pharmacokinetics of lucitanib in patients with advanced cancer. No clinically significant covariates were identified in this analysis. High BSV in pharmacokinetics supported a safety-based dose titration strategy that is being investigated in an ongoing clinical study of lucitanib to optimize lucitanib exposure and potential benefit.
Supplementary Information
Below is the link to the electronic supplementary material.
Acknowledgements
Medical writing and editorial support were funded by Clovis Oncology and provided by Anginelle Alabanza of Nuventra and Leslie Mitchell and Melanie Styers of Verascity Science.
Declarations
Funding
This analysis was funded by Clovis Oncology, Inc.
Conflicts of interest
Mingxiang Liao, Kenton Wride, Denise Lepley, Terri Cameron, and Jim Xiao are or were employees of Clovis Oncology, Inc. Mark Sale and Jie Zhou are or were paid consultants for Clovis Oncology, Inc.
Ethics approval
All procedures performed in studies involving human participants were in accordance with the ethical standards of the institutional and/or national research committee and with the 1964 Helsinki Declaration and its later amendments or comparable ethical standards. All studies were approved by an Institutional Review Board or Independent Ethics Committee.
Consent to participate
Written informed consent was obtained from each patient in all studies included in this manuscript prior to participation.
Consent for publication
Not applicable.
Availability of data and material
Requests for de-identified datasets for the results reported in this publication will be made available to qualified researchers following submission of a methodologically sound proposal to medinfo@clovisoncology.com. Data will be made available for such requests following online publication of this article and for 1 year thereafter in compliance with applicable privacy laws, data protection, and requirements for consent and anonymization. Data will be provided by Clovis Oncology.
Code availability
Included in supplementary file.
Author contributions
All authors participated in study conception and research design. ML, JZ, MS, and JX performed data analysis. This article was written by the authors, with medical writing and copy editing support paid for by the sponsor. All authors had full access to the trial data and read and approved the final manuscript.
Footnotes
Mingxiang Liao and Jie Zhou contributed equally to the article.
References
- 1.Sherwood LM, Parris EE, Folkman J. Tumor angiogenesis: therapeutic implications. N Engl J Med. 1971;285:1182–1186. doi: 10.1056/NEJM197111182852108. [DOI] [PubMed] [Google Scholar]
- 2.Lugano R, Ramachandran M, Dimberg A. Tumor angiogenesis: causes, consequences, challenges and opportunities. Cell Mol Life Sci. 2020;77:1745–1770. doi: 10.1007/s00018-019-03351-7. [DOI] [PMC free article] [PubMed] [Google Scholar]
- 3.Dusek RL, Robillard L, Harding TC, Simmons AD, Nguyen M. Abstract 1214: enhancement of anti-PD-1 antitumor efficacy in syngenic preclinical models by the angiogenesis inhibitor lucitanib. Cancer Res. 2019;79:1214. doi: 10.1158/1538-7445.AM2019-1214. [DOI] [Google Scholar]
- 4.Guffanti F, Chilà R, Bello E, Zucchetti M, Zangarini M, Ceriani L, et al. In vitro and in vivo activity of lucitanib in FGFR1/2 amplified or mutated cancer models. Neoplasia. 2017;19:35–42. doi: 10.1016/j.neo.2016.11.008. [DOI] [PMC free article] [PubMed] [Google Scholar]
- 5.Soria J, De Braud F, Cereda R, Bahleda R, Delmonte A, Angevin E, et al. First-in-man study of E-3810, a novel VEGFR and FGFR inhibitor, in patients with advanced solid tumors. J Clin Oncol. 2011;29:TPS149. doi: 10.1200/jco.2011.29.15_suppl.tps149. [DOI] [Google Scholar]
- 6.Soria JC, DeBraud F, Bahleda R, Adamo B, Andre F, Dientsmann R, et al. Phase I/IIa study evaluating the safety, efficacy, pharmacokinetics, and pharmacodynamics of lucitanib in advanced solid tumors. Ann Oncol. 2014;25:2244–2251. doi: 10.1093/annonc/mdu390. [DOI] [PubMed] [Google Scholar]
- 7.Hui R, Pearson A, Cortes J, Campbell C, Poirot C, Azim HA, et al. Lucitanib for the treatment of HR+/HER2− Metastatic breast cancer: results from the multicohort phase II FINESSE study. Clin Cancer Res. 2020;26:354–363. doi: 10.1158/1078-0432.CCR-19-1164. [DOI] [PubMed] [Google Scholar]
- 8.Campone M, Bachelot T, Penault-Llorca F, Pallis A, Agrapart V, Pierrat MJ, et al. A phase Ib dose allocation study of oral administration of lucitanib given in combination with fulvestrant in patients with estrogen receptor-positive and FGFR1-amplified or non-amplified metastatic breast cancer. Cancer Chemother Pharmacol. 2019;83:743–753. doi: 10.1007/s00280-018-03765-3. [DOI] [PubMed] [Google Scholar]
- 9.Abu-Khalaf M, Mayer IA, Tankersley C, Moy J, Allen A, Vogel C, et al. A phase 2, randomized, pen-label study of lucitanib in patients with FGF aberrant metastatic breast cancer. J Clin Oncol. 2015;33:TPS628. doi: 10.1200/jco.2015.33.3_suppl.628. [DOI] [Google Scholar]
- 10.ClinicalTrials.gov. A study to assess the efficacy and safety of the VEGFR-FGFR inhibitor, lucitanib, given to patients with advanced/metastatic lung cancer and FGF, VEGF, or PDGF related genetic alterations. Bethesda: US National Library of Medicine. 2019. https://clinicaltrials.gov/ct2/show/NCT02109016. Accessed 24 Jun 2021.
- 11.Mayer I, Arteaga C, Nanda R, Miller K, Jhaveri K, Brufsky A, et al. Abstract P6–11-03: a phase 2 open-label study of lucitanib in patients (pts) with FGF aberrant metastatic breast cancer (MBC) Cancer Res. 2017;77:P6-11-03. doi: 10.1158/1538-7445.SABCS16-P6-11-03. [DOI] [Google Scholar]
- 12.Herbrink M, Nuijen B, Schellens JHM, Beijnen JH. Variability in bioavailability of small molecular tyrosine kinase inhibitors. Cancer Treat Rev. 2015;41:412–422. doi: 10.1016/j.ctrv.2015.03.005. [DOI] [PubMed] [Google Scholar]
- 13.Tyson RJ, Park CC, Powell JR, Patterson JH, Weiner D, Watkins PB, et al. Precision dosing priority criteria: drug, disease, and patient population variables. Front Pharmacol. 2020;11:420. doi: 10.3389/fphar.2020.00420. [DOI] [PMC free article] [PubMed] [Google Scholar]
- 14.Schmidinger M, Danesi R, Jones R, McDermott R, Pyle L, Rini B, et al. Individualized dosing with axitinib: rationale and practical guidance. Future Oncol. 2018;14:861–875. doi: 10.2217/fon-2017-0455. [DOI] [PubMed] [Google Scholar]
- 15.Bekaii-Saab TS, Ou FS, Ahn DH, Boland PM, Ciombor KK, Heying EN, et al. Regorafenib dose-optimisation in patients with refractory metastatic colorectal cancer (ReDOS): a randomised, multicentre, open-label, phase 2 study. Lancet Oncol. 2019;20:1070–1082. doi: 10.1016/S1470-2045(19)30272-4. [DOI] [PMC free article] [PubMed] [Google Scholar]
- 16.Keizer RJ, Gupta A, Shumaker R, Beijnen JH, Schellens JHM, Huitema ADR. Model-based treatment optimization of a novel VEGFR inhibitor. Br J Clin Pharmacol. 2012;74:315–326. doi: 10.1111/j.1365-2125.2012.04197.x. [DOI] [PMC free article] [PubMed] [Google Scholar]
- 17.Loriot Y, Necchi A, Park SH, Garcia-Donas J, Huddart R, Burgess E, et al. Erdafitinib in locally advanced or metastatic urothelial carcinoma. N Engl J Med. 2019;381:338–348. doi: 10.1056/NEJMoa1817323. [DOI] [PubMed] [Google Scholar]
- 18.Sala F, Bagnati R, Livi V, Cereda R, D’Incalci M, Zucchetti M. Development and validation of a high-performance liquid chromatography-tandem mass spectrometry method for the determination of the novel inhibitor of angiogenesis E-3810 in human plasma and its application in a clinical pharmacokinetic study. J Mass Spectrom. 2011;46:1039–1045. doi: 10.1002/jms.1985. [DOI] [PubMed] [Google Scholar]
- 19.Yu G, Zheng QS, Wang DX, Zhou HH, Li GF. Drug interactions between tyrosine-kinase inhibitors and acid suppressive agents: more than meets the eye. Lancet Oncol. 2014;15:e469–e470. doi: 10.1016/S1470-2045(14)70458-9. [DOI] [PubMed] [Google Scholar]
- 20.Sharma M, Holmes HM, Mehta HB, Chen H, Aparasu RR, Shih YCT, et al. The concomitant use of tyrosine kinase inhibitors and proton pump inhibitors: prevalence, predictors, and impact on survival and discontinuation of therapy in older adults with cancer. Cancer. 2019;125:1155–1162. doi: 10.1002/cncr.31917. [DOI] [PMC free article] [PubMed] [Google Scholar]
- 21.van Leeuwen RWF, Jansman FGA, Hunfeld NG, Peric R, Reyners AKL, Imholz ALT, et al. Tyrosine kinase inhibitors and proton pump inhibitors: an evaluation of treatment options. Clin Pharmacokinet. 2017;56:683–688. doi: 10.1007/s40262-016-0503-3. [DOI] [PMC free article] [PubMed] [Google Scholar]
- 22.Cancer Therapy Evaluation Program. Specific instructions for the use of protocol templates for organ dysfunction studies Bethesda (MD): National Cancer Institute, Division of Cancer Treatment & Diagnosis. 2021. https://ctep.cancer.gov/protocolDevelopment/docs/CTEP_Organ_Dysfunction_Protocol_Template.docx. Accessed 24 June 2021.
- 23.US Food and Drug Administration. Guidance for industry: pharmacokinetics in patients with impaired renal function: study design, data analysis, and impact on dosing. Silver Spring: US Department of Health and Human Services. 2020. https://www.fda.gov/media/78573/download. Accessed 24 June 2021.
- 24.DIDB—The Drug Interaction Database—UW Drug Interaction Solutions. https://www.druginteractionsolutions.org/solutions/drug-interaction-database/. Accessed 24 June 2022.
- 25.Faslodex (fulvestrant) injection [prescribing information]. Cambridge: AstraZeneca, Plc; 2020. https://medicalinformation.astrazeneca-us.com/home/prescribing-information/faslodex-pi.html.
- 26.Dumbrava E, Shapiro G, Bendell J, Yap T, Jeselsohn R, Lepley D, et al. Phase 1b/2 SEASTAR trial: safety, pharmacokinetics, and preliminary efficacy of the poly(ADP)-ribose polymerase (PARP) inhibitor rucaparib and angiogenesis inhibitor lucitanib in patients with advanced solid tumors. J Clin Oncol. 2021;39:3102. doi: 10.1200/JCO.2021.39.15_suppl.3102. [DOI] [Google Scholar]
- 27.Hamilton EP, Patel MR, Gunderson CC, Wride K, Lepley D, Dusek R, et al. 556P Initial clinical experience of lucitanib + nivolumab in advanced metastatic solid tumours: data from the phase Ib/II LIO-1 study (CO-3810-101; NCT04042116) Ann Oncol. 2020;31:S480–S481. doi: 10.1016/j.annonc.2020.08.670. [DOI] [Google Scholar]
- 28.Chen Y, Tortorici MA, Garrett M, Hee B, Klamerus KJ, Pithavala YK. Clinical pharmacology of axitinib. Clin Pharmacokinet. 2013;52:713–725. doi: 10.1007/s40262-013-0068-3. [DOI] [PubMed] [Google Scholar]
- 29.Rini BI, Melichar B, Ueda T, Grünwald V, Fishman MN, Arranz JA, et al. Axitinib with or without dose titration for first-line metastatic renal-cell carcinoma: a randomised double-blind phase 2 trial. Lancet Oncol. 2013;14:1233–1242. doi: 10.1016/S1470-2045(13)70464-9. [DOI] [PMC free article] [PubMed] [Google Scholar]
- 30.Keytruda (pembrolizumab) injection [prescribing information]. Kenilworth, NJ: Merck & Co., Inc; 2021. https://www.merck.com/product/usa/pi_circulars/k/keytruda/keytruda_pi.pdf. Accessed 26 July 2021.
- 31.Bavencio (avelumab) injection [prescribing information]. Rockland, MA: EMD Serono Inc; 2021. https://www.emdserono.com/us-en/pi/bavencio-pi.pdf. Accessed 26 July 2021.
- 32.Hamilton EP, Jackson CC, Eskander R, Backes F, Makker V, Musa F, et al. LIO-1: Lucitanib + nivolumab in patients with advanced solid tumors—updated phase 1b results and initial experience in phase 2 ovarian cancer cohort. J Clin Oncol. 2021;39:5538. doi: 10.1200/JCO.2021.39.15_suppl.5538. [DOI] [Google Scholar]
- 33.Concin N, Gonzalez Martin A, Vergote I, Pignata S, Harter P, Patel MR, et al. 885TiP LIO-1: a phase II study of lucitanib + nivolumab in patients (pts) with gynaecological tumours (CO-3810-101; NCT04042116; ENGOT-GYN3/AGO/LIO) Ann Oncol. 2020;31:S648. doi: 10.1016/j.annonc.2020.08.2091. [DOI] [Google Scholar]
- 34.Cleveland WS. LOWESS: a program for smoothing scatterplots by robust locally weighted regression. Am Stat. 1981;35:54. doi: 10.2307/2683591. [DOI] [Google Scholar]
Associated Data
This section collects any data citations, data availability statements, or supplementary materials included in this article.