

Abstract
BarA of Streptomyces virginiae is a specific receptor protein for a member of butyrolactone autoregulators which binds to an upstream region of target genes to control transcription, leading to the production of the antibiotic virginiamycin M1 and S. BarA-binding DNA sequences (BarA-responsive elements [BAREs]), to which BarA binds for transcriptional control, were restricted to 26 to 29-nucleotide (nt) sequences on barA and barB upstream regions by the surface plasmon resonance technique, gel shift assay, and DNase I footprint analysis. Two BAREs (BARE-1 and BARE-2) on the barB upstream region were located 57 to 29 bp (BARE-1) and 268 to 241 bp (BARE-2) upstream from the barB translational start codon. The BARE located on the barA upstream region (BARE-3) was found 101 to 76 bp upstream of the barA start codon. High-resolution S1 nuclease mapping analysis revealed that BARE-1 covered the barB transcription start site and BARE-3 covered an autoregulator-dependent transcription start site of the barA gene. Deletion and mutation analysis of BARE-2 demonstrated that at least a 19-nt sequence was required for sufficient BarA binding, and A or T residues at the edge as well as internal conserved nucleotides were indispensable. The identified binding sequences for autoregulator receptor proteins were found to be highly conserved among Streptomyces species.
Streptomyces virginiae produces two types of antibiotics, virginiamycins M1 and S, both of which act synergistically as irreversible inhibitors of protein synthesis and show bactericidal activity against gram-positive bacteria (1). The production of the two antibiotics is induced by nanomolar concentrations of virginiae butanolides (VBs), members of low-molecular-weight Streptomyces hormones called butyrolactone autoregulators (14, 24, 27, 29). The signal of VBs is transmitted to the cell through binding of VBs to the specific receptor protein butyrolactone autoregulator receptor (BarA) (19). BarA possesses a helix-turn-helix DNA-binding motif on its amino terminus (5, 11), and in-frame deletion of the motif in the genome of S. virginiae resulted in a loss-of-function mutant with respect to the VB-dependent induction of virginiamycin production (18). In vitro experiments confirmed that BarA binds to DNA sequences in the absence of VB and dissociates from DNA by binding with VB (10), suggesting that the DNA-binding ability is central to the role of BarA as a mediator of the VB signal.
In a previous report (10), we demonstrated that BarA binds specifically to upstream regions of the barA gene itself and also to the downstream barB gene, which codes for a putative transcriptional regulator deduced from the homology with BarA. The aim of the present study was to localize precisely the target DNA sequences of BarA (BarA-responsive elements [BAREs]) as well as to evaluate by deletion and mutation analysis the essential nucleotides in BARE. Three identified BAREs were all A-T rich and showed potential for forming a partial palindrome. Deletion and mutation analyses revealed a minimum BARE of 19-nucleotide (nt) sequences with several essential nucleotides for BarA binding.
MATERIALS AND METHODS
Strains, culture media, and cultivation conditions.
S. virginiae MAFF10-06014 (National Food Research Institute, Ministry of Agriculture, Forestry and Fisheries, Tsukuba, Japan) was grown at 28°C as described previously (4, 9). VB-C6 was added at 8 h of cultivation to a final concentration of 300 nM, comparable to that produced by S. virginiae (VB activity of 32 to 150 U/ml, which is equivalent to 85 to 150 nM VB-A or 425-750 nM VB-C6). For genetic manipulation, Escherichia coli DH5α was used. For expression of the barA gene, E. coli BL21(DE3)/pLysS was used as the host. DNA manipulations in E. coli were performed as described by Sambrook et al. (23).
Chemicals.
All chemicals were of reagent or high-performance liquid chromatography grade and were purchased from either Nacali Tesque, Inc. (Osaka, Japan), Takara Shuzo Co. (Shiga, Japan), or Wako Pure Chemical Industrial, Ltd. (Osaka, Japan).
Primer extension.
Primer extension analysis was performed as described by Sambrook et al. (23). Total RNA was isolated by a procedure reported by Hopwood et al. (6). Quantification of the RNA was performed at an absorbance at 260 nm. The primer 5′-GAAGGCGCGTTCCTGTTTGGGTGTCAA-3′, which is complementary to nt +27 to +1 relative to the barB start codon, was 5′-end labeled with [γ-32P]ATP and T4 polynucleotide kinase. The unincorporated ATP was separated by using a Primer/Probe purification kit (Advanced Genetic Technologies Co.). 32P-labeled primer was annealed to S. virginiae RNA. Rous-associated virus 2 reverse transcriptase was used to extend the reverse transcripts starting from the primer. For the sequencing ladder, the 32P-labeled primer was used with a BcaBEST dideoxy sequencing kit (Takara Shuzo); the StuI fragment shown in Fig. 1 served as the template. The ladder and the RNA primer-extended product were resolved on a 6% polyacrylamide–8 M urea gel.
FIG. 1.

Restriction enzyme map around the barA (A) and barB (B) promoter regions. Numbers indicate nucleotide positions.
S1 nuclease mapping.
Total RNA for S1 nuclease mapping was isolated as described for primer extension experiments. Labeled DNA fragments were produced for the identification of barA transcriptional start sites (TSS). pAR489, which consisted of pUC19 and a 2.8-kbp BamHI fragment containing the barA gene (19), was digested with endonucleases SphI and KpnI. An isolated fragment was then subcloned in pUC19, which provided the template for the PCR to prepare the labeled fragment, using M13 primer RV-N (Takara Shuzo) and 5′ [γ-32P]ATP-labeled primer 5′-GCCCGTTCCTGTCGCACTGC-3′; the latter primer is complementary to nt +44 to +25 relative to the barA start codon. The labeled primer was also used for making DNA sequencing ladders. RNA (50 μg) was dried with the 32P-labeled DNA probes (100,000 cpm). Pellets were suspended in 20 μl of 3 M sodium trichloroacetate buffer [40 mM piperazine-N,N′-bis(2-ethanesulfonic acid) (PIPES), 1 mM EDTA (pH 7.0)]. Tubes were placed in a water bath that was kept at 65°C for 15 min; they were then allowed to cool to 45°C overnight. All subsequent steps were as described by Janssen et al. (8).
Biosensor assays of protein-DNA interactions.
Protein-DNA interaction was measured by the BIAcore system (Pharmacia Biosensor). BIAcore utilizes surface plasmon resonance (SPR), a quantum mechanical phenomenon which detects changes in the refractive index of incident light close to the surface of a thin gold film on a glass support (i.e., sensor chip) (2). The surface of the sensor chip is covered with a carboxymethylated dextran polymer. One of the reactants is linked either directly or indirectly to this polymer, by means of the specific interaction between biotin and streptavidin, while the other is introduced in flow over the surface. Binding of the soluble ligand to the immobilized one leads to an increase in the ligand concentration at the sensor surface, with a corresponding increase in the refractive index. This change in refractive index alters the SPR in an optically detectable manner. Binding is evaluated in arbitrary response units (RU), and a linear relationship exists between the mass of ligand bound to the dextran matrix and the RU observed. A signal of 1,000 RU corresponds to a surface concentration change of approximately 1 ng/mm2.
An SA5 sensor chip (research grade; precoated with approximately 4,000 RU of streptavidin) was obtained from Pharmacia Biosensor. Synthesized target DNA fragments were subcloned into the KpnI-SacI site in pUC19. They were then biotinylated by PCR with primers 5′-GTAAAACGACGGCCAGT-3′ and biotin-5′-CAGGAAACA-GCTATGAC-3′, located just outside the multicloning site in pUC19. Seventy microliters of biotinylated DNA (200 μg in 10 mM HEPES [pH 7.0]–1.0 M KCl) was injected over the surface of the chip under a continuous flow of 5 μl/min of 10 mM HEPES (pH 7.0) containing 1.0 M KCl and 0.005% (vol/vol) Tween 20.
Recombinant BarA (rBarA) was expressed and purified as described previously (19). During the interaction between rBarA and DNA, 50 mM triethanolamine (TEA)-HCl (pH 7.0) containing 0.2 M KCl and 0.005% (vol/vol) Tween 20 was used as the running buffer. A 30-μl sample (3.65 μM rBarA in 50 mM TEA-HCl [pH 7.0]) containing 0.2 M KCl) was injected across the sensor surface on which the corresponding DNA fragment had been immobilized. All experiments were performed at 25°C. Control DNA used in this experiment and in gel shift assays was the PCR fragment containing only the multicloning site of pUC19 amplified with the above-mentioned primers.
Gel shift assay.
The gel shift assay was carried out as described previously (10). The DNA-protein binding reaction was carried out with 250 pg of 32P-labeled double-stranded fragments (10,000 to 20,000 cpm) and 1.1 μg (final concentration, 2.92 μM) of purified rBarA in 1× binding buffer [50 mM TEA-HCl (pH 7.0) containing 0.2 M KCl, 10% (vol/vol) glycerol, and 1 μg of poly(dI-dC) · poly(dI-dC)] in a total volume of 15 μl. After incubation at 25°C for 2 min, autoregulators (final concentration, 150 μM) were added, followed by a further 5-min incubation at 25°C. The reaction mixture was subjected to electrophoresis at 4°C on a high-ionic-strength gel containing 5% acrylamide and 0.167% N,N′-methylenebisacrylamide with 50 mM Tris-Cl (pH 8.5) containing 380 mM glycine and 2 mM EDTA as a running buffer. Gels were dried and subjected to autoradiography.
DNase I footprint analysis.
DNase I footprint analyses were carried out with 45 μl of the DNA-protein binding reaction mixture as described above. After incubation at 25°C for 5 min, 5 μl of DNase I solution (100 mM MgCl2, 50 mM CaCl2), with several different amounts of DNase I (1.5 to 0.1 U) purchased from Life Technologies Inc. (Rockville, Md.), was added to each reaction mixture, which was then incubated for 1 min at 25°C. DNase digestion was stopped by the addition of 400 μl of DNase I stop solution (150 mM sodium acetate, 10 mM EDTA, 25 μg of tRNA [Boehringer Mannheim Corp., Indianapolis, Ind.] per ml). Samples were then subjected to phenol extraction and ethanol precipitation. The resulting pellet was resuspended in 5 μl of sequencing loading buffer and applied to a 6% polyacrylamide gel.
Nucleotide sequence accession number.
Sequences shown in Fig. 1 have been assigned DDBJ, EMBL, and GenBank accession no. D3251.
RESULTS AND DISCUSSION
Identification of BAREs by the SPR technique, gel shift assay, and footprint analysis on barA and barB upstream regions.
In a previous study (10), we found that the VB receptor BarA bound to both upstream regions of the barA and barB genes and regulated their expression depending on the presence of VB. We concluded that at least two BAREs are present in the barB upstream region: one in the 73-bp AgeI-EheI region, and another in the 137-bp Nc137 fragment (NaeI-StuI region in Fig. 1) containing the barB translation start codon. One BARE is also located in the 258-bp fragment immediately upstream of the barA translational start codon (Fig. 1). To further localize BAREs, several fragments of 35 to 40 bp (PB01 to PB05) were synthesized from the two regions of the barB gene (Table 1). PA01 was constructed on the basis of the sequence of the barA promoter region as a putative BARE, as judged from the homology of the sequence of the barB promoter region. The synthesized oligonucleotides were annealed with each complementary fragment and cloned into pUC19. Biotin was introduced into the fragments by PCR with a 5′-biotinylated universal primer, and the fragments were immobilized on the sensor chip of a BIAcore system (see Materials and Methods for detail). The biological interaction in SPR analysis was evaluated by the maximum increase of SPR signal attained during the association phase or by the level of signal slightly after the transition from association phase to dissociation phase. With strengthening of the interaction between the immobilized DNA and the free rBarA in the flow, the SPR signal increases more steeply in the association phase and reaches a higher level. When shifted from the association phase to the dissociation phase in which rBarA is absent, the signal drops suddenly and then decreases gradually. The first drop reflects the release of weakly bound rBarA, and the gradual decrease reflects the slow dissociation of tightly bound rBarA. The synthesized oligonucleotides PB01, PB02, PB04, and PA01 all showed steep increases and high maximum levels of SPR signal during the association phase, while PB03 and PB05 showed levels of response similar to that of control DNA. Furthermore, after being shifted to the dissociation phase, PB01, PB02, PB04, and PA01 showed high levels of tightly bound rBarA, as evident from the 1,300 to 2,000 RU of slow decreasingly SPR signal, while responses of PB03 and PB05 were negligible compared to that of the control DNA (Fig. 2A). Gel shift assays clearly confirmed BarA binding to the fragments as well as dissociation of BarA from the fragments in the presence of VB (Fig. 2B). From the intensity of the shifted bands, PB01 and PA01 seemed to possess an affinity for BarA higher than those of other fragments (Fig. 2B).
TABLE 1.
Nucleotide sequences used for BarA binding
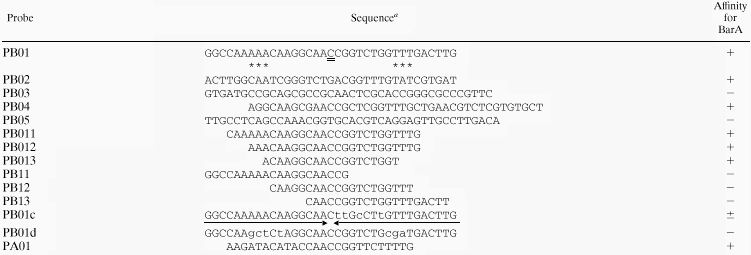 |
Lowercase letters indicate substituted residues; asterisks mark residues required for binding. The sequence of PB04 is from complementary chain compared to other probes.
FIG. 2.


(A) Localization of BARE on barA and barB promoters by the SPR technique. rBarA (3.65 μM) in 50 mM TEA-HCl buffer (pH 7.0) containing 0.2 M KCl was introduced over the surface of the sensor chip to analyze BarA binding to the indicated fragments during the association phase (100 to 460 s). rBarA was omitted from the flow during the dissociation phase (460 to 630 s). In each sensor chip, DNA corresponding to 800 to 1,000 RU was immobilized. (B) Gel shift assay with oligonucleotides containing BARE. In the rBarA row, a minus sign indicates that rBarA was omitted from the binding reaction and a plus sign indicates that 2.92 μM rBarA was present. In the VB row, a minus sign indicates that VB was not added to the binding reaction and a plus sign indicates that 150 μM VB was added. In all lanes, 125 pg of a 32P-labeled DNA probe was electrophoresed. PB03, used as control DNA, showed no binding for BarA in SPR analysis.
To precisely identify BARE, DNase I footprint analysis was also performed for the barA and barB promoter regions. When each 32P-labeled fragment was incubated with various concentrations of DNase I in the absence and presence of BarA, BarA-dependent protection of regions ranging from 26 to 29 bp in length were evident (Fig. 3). The BarA-protected regions derived from analyses of both coding and noncoding strands are listed in Table 2. These regions were all A-T rich (41.4, 53.6, and 61.5% for BARE-1, -2, and -3, respectively), despite the high GC content of the Streptomyces genome, and all possessed partial inverted repeat elements. Fragments (PB01, PB04, and PA01) shown to bind with BarA by SPR analysis and gel shift assay contained the DNase I-protected regions BARE-1, -2, and -3, respectively (Fig. 2; Tables 1 and 2). Although PB02 was shown to bind with BarA, the corresponding region was not protected by BarA, probably because of the low affinity of the PB02 region toward BarA. Alternatively, binding of BarA to BARE-2 might prevent further access of BarA to the PB02 region.
FIG. 3.

DNase I footprint analysis on the barA and barB promoter regions to identify BARE. rBarA (2.92 μM) was added to the reaction mixture to detect the BarA-protected sequence (+). The amount of DNase I was increased toward the right as indicated by the upper triangle. The sequences around PB04 (BARE-1). PB01 (BARE-2), and PA01 (BARE-3) are in focus in panels a, b, and c.
TABLE 2.
Protected region in DNase I footprint analyses and binding sites of autoregulator receptor protein from Streptomyces species
| Region | Sequencea |
|---|---|
| barB promoter (1506–1478b; BARE-1) | GAGGCAAGCGAACCGCTC-GGTTTGCTGAA |
| _ _ _ ▸ ◂ _ _ _ | |
| barB promoter (1267–1294; BARE-2) | CAAAAACAAGGCAACCGGTCTGGTTTGA |
| ___ __ ▸ ◂ __ ___ | |
| barA promoter (353–378; BARE-3) | AGATACATACCAACCGGT-TCTTTTGA |
| _ _ ▸ ◂ _ _ | |
| farA promoter (1429–1456; FARE) | TAAGATACGAACGGGACGGAC-GGTTTGCAGC |
| _ __ ▸◂ __ _ | |
| ArpA binding site | ACATACGGGACGGTC-GGTTTG |
| __ ▸◂ __ | |
| AA GAAC | |
| Consensus sequence | aCa c CGgtc-ggTTTG |
| TG CGGA |
Double underlines denote the center of the palindromic structure; arrows indicate the complementary pairs.
Complementary strand.
TSS of barA and barB.
To clarify the BarA-dependent regulation mechanism as regards the BAREs, TSS were determined by either primer extension analyses or high-resolution S1 nuclease mapping. A single extension product of 58 nt from the C at position 1504 was detected for the barB transcript only when an autoregulator VB was present in the medium as the result of derepression by the VB (10) (Fig. 4A). The barB TSS was present 21 bp upstream of the putative ribosome-binding sequence of AGGAGTT, although neither a typical −35 nor −10 sequence was found in the proper position from the TSS (Fig. 5). BARE-1 corresponded to −22 to +3 relative to the barB TSS. Therefore, we postulated that BarA represses the transcription of the barB gene in the absence of VB by interfering with the binding of RNA polymerase. The second BARE (BARE-2) in the barB upstream region was about 200 nt away from the TSS. Although the physiological function of BARE-2 is not clear, the double BAREs may coordinate the tight repression of the barB gene by BarA.
FIG. 4.

Identification of the barA and barB TSS. (A) Primer extension analysis of the barB transcripts in S. virginiae. Lanes T, G, C, and A represent a sequencing ladder generated by the same primer. The asterisk represents the TSS. Lanes: 1, RNA after 10-h cultivation; 2, RNA after 8-h cultivation followed by 2-h cultivation with added VB. (B) High-resolution S1 mapping of the barA transcripts in S. virginiae. Lanes A, C, G, and T represent a sequencing ladder generated by the primer used for making the probe. Asterisks indicated the VB-independent TSS, and the outlined letter indicated the VB-dependent TSS. Lanes: 1, RNA after 10-h cultivation; 2, RNA after 12-h cultivation.
FIG. 5.

Locations of the BARE sequences in barA and barB promoter regions. Sequences protected by BarA from DNase I digestion are indicated by broken lines; locations of the TSS of barA and barB are indicated by arrows; putative −10 and −35 sequences for the constitutive barA TSS are underlined; the putative ribosome-binding site (RBS) of barB is boxed; translational start codons of barA and a plausible start codon for barB are double underlined.
For the barA transcript, S1 nuclease mapping was used to determine the TSS because the primer extension experiment revealed no signal, probably due to extension inhibition by a putative secondary structure. Three adjacent barA transcripts were detected with RNA from a 10-h culture, corresponding to initiations at CGG residues located 40 to 42 bp upstream of the barA translational start codon (Fig. 4B and 5). Typical transcriptional promoter sequences, namely, −10 (TATCTA) and −35 (TTGACA), were found at appropriate positions (Fig. 5). On the other hand, with RNA from 12-h cultivation when S. virginiae produced an autoregulator VB, another transcript from an A residue further upstream was detected. This TSS lies in the middle of BARE-3, and no typical −35 or −10 sequence was detected. We demonstrated previously that barA had two modes of transcription; one was constitutive and VB-independent basal-level transcription, and the other was VB-induced transcription which was evident from the enhanced transcript with internally produced or externally added VB (10). The result of S1 nuclease mapping suggested that the larger transcript, starting from the middle of BARE-3, was responsible for the VB-dependent enhancement of transcription.
These results indicated that the BarA binding, in the absence of VB to BAREs overlapping with transcriptional start sites, resulted in transcriptional repression of downstream genes. When the autoregulator VB is produced, it binds to BarA, thus forcing BarA to dissociate from BAREs. Hence, the approach of RNA polymerase is enabled in order to initiate transcription.
Nucleotides in BARE essential for BarA binding.
To determine the essential nucleotides in BARE, several deleted or modified BAREs were synthesized based on the sequences of BARE-2 in the barB promoter, because BARE-2 showed the highest symmetry (Table 2). The oligonucleotides (PB011 to PB01d) used as probes are listed in Table 1. The affinity toward BarA was investigated by the SPR technique using a BIAcore system. The minimum length of BAREs was determined to be 19 bp of PB013 (Fig. 6A and Table 1). The affinity of PB011 and PB012 toward BarA was strong and almost equal to that of PB01. However, PB013 showed a slightly reduced affinity, as evident from the SPR profile at the dissociation stage starting from 460 (Fig. 6A). Judging from the weak binding toward PB013 and the lack of binding toward PB12, BarA seemed to require consecutive A and T residues for sufficient binding to take place (marked with asterisks in Table 1).
FIG. 6.

SPR analysis of deleted (A) and mutated (B) versions of BARE-2. rBarA (3.65 μM) in 50 mM TEA-HCl buffer (pH 7.0) containing 0.2 M KCl was introduced over the surface of the sensor chip to analyze BarA-DNA interaction. Association phase, 100 to 460 s; dissociation phase, 460 to 630 s. In each sensor chip, DNA corresponding to 800 to 1,000 RU was immobilized.
Since BARE seemed to have palindromic structures with C as the center of symmetry (double underlined on PB01 or BAREs; Tables 1 and 2), mutated BAREs that have a symmetrical structure were designed. No BarA binding was detected on the probes covering the left half (PB11), the right half (PB13), or the mutant with disrupted symmetry at both edges (PB01d) (Fig. 6B). With PB01c, a probe designed to form a complete palindrome by changing only 4 nt in the right half, BarA binding was significantly reduced (Fig. 6B). These results suggested that the palindromic structure composed of A and T rows at both ends was required but not sufficient for recognition by BarA. In addition, the internal nucleotides substituted in PB01c were essential for recognition by BarA. Conservation of the inner sequences among BARE-1, -2, and -3 also seemed to indicate that these nucleotides are indispensable for BarA binding.
The binding characteristics of the above-mentioned fragments were investigated by gel shift assay. Probes PB01, PB011, PB012, and PB013 were all confirmed as capable of binding with BarA (Fig. 7). The shifted band of PB011 and PB012 was strong, whereas that of PB01 was clear but weak. The shifted band of PB013 migrated only a little slower than did the free probe and produced smear bands as well. These results suggested that the affinity with BarA was strong in the case of PB011 and PB012, weaker with PB01, and quite reduced in the case PB013. The smear bands with PB013 are probably due to the specific binding with BarA, as evidenced by the fact that the shifted bands disappeared in the presence of VB. Other probes (PB11, PB12, and PB01d) showed no signs of specific BarA binding. This observation is in good agreement with the results from the SPR analyses. The unknown band shown in PB11 and PB01d was judged to be nonspecific, because the mobility of the band was too small and the shift did not disappear in the presence of VB. Probe PB01c showed a very weak but definite BarA binding in SPR analysis (probably because of the high sensitivity of SPR analysis, which can detect even a faint interaction of BarA with the probe) but no specific retardation in the gel shift assay.
FIG. 7.

Gel shift assay with oligonucleotides containing modified BARE. In the rBarA row, a minus sign indicates that rBarA was omitted from the binding reaction and a plus sign indicates that 2.92 μM rBarA was present. In the VB row, a minus sign indicates that VB was not added to the binding reaction and a plus sign indicates that 150 μM VB was added. In all lanes, 125 pg of a 32P-labeled DNA probe was electrophoresed.
In Streptomyces species, 10 butyrolactone autoregulators classified into three groups (VB type, IM-2 type, and A-factor type) (3, 7, 13–16, 22, 25–28) have been identified, and three receptor proteins corresponding to the three types of autoregulators have been characterized (19, 20, 30). The three receptors (VB receptor BarA, IM-2 receptor FarA, and A-factor receptor ArpA) show high overall homology, especially of the N termini where helix-turn-helix DNA-binding motifs are present. This finding suggests that similar DNA sequences may be recognized by these autoregulator receptors. Although artificial binding sequences for ArpA were screened from a random synthetic oligonucleotide pool by PCR amplification (21), no genes containing the reported ArpA-binding sequences have been identified. In the case of FarA, an IM-2 receptor, the FarA-binding sequence was localized in the farA promoter region overlapping with the farA TSS (12). The close alignment of BAREs, the FarA-binding sequence, and the artificial ArpA-binding sequences (although their physiological relevance is not clear at present) suggests that the binding sequences are all A-T rich, are only partially palindromic with A and T rows at both ends, and share several highly conserved residues (Table 2). The well-conserved target sequence for autoregulator receptors as well as the wide distribution of autoregulators in Streptomyces suggest that transcriptional regulation involving BARE-like sequences is widespread in this genus.
REFERENCES
- 1.Cocitto C. Antibiotics of the virginiamycin family, inhibitors which contain synergistic components. Microbiol Rev. 1979;43:145–198. doi: 10.1128/mr.43.2.145-192.1979. [DOI] [PMC free article] [PubMed] [Google Scholar]
- 2.Garland P B. Optical evanescent wave methods for the study of biomolecular interactions. Q Rev Biophys. 1996;29:91–117. doi: 10.1017/s0033583500005758. [DOI] [PubMed] [Google Scholar]
- 3.Gräfe U, Schade W, Eritt I, Fleck W F, Radics L. A new inducer of anthracycline biosynthesis from Streptomyces viridochromogenes. J Antibiot. 1982;35:1722–1723. doi: 10.7164/antibiotics.35.1722. [DOI] [PubMed] [Google Scholar]
- 4.Hillen W, Berens C. Mechanisms underlying expression of tn10 encoded tetracycline resistance. Annu Rev Microbiol. 1994;48:345–369. doi: 10.1146/annurev.mi.48.100194.002021. [DOI] [PubMed] [Google Scholar]
- 5.Hinrichs W, Kisker C, Düvel M, Müller A, Tovar K, Hillen W, Saenger W. Structure of the Tet repressor-tetracycline complex and regulation of antibiotic resistance. Science. 1994;264:418–420. doi: 10.1126/science.8153629. [DOI] [PubMed] [Google Scholar]
- 6.Hopwood D A, Bibb M J, Chater K F, Kieser T, Bruton C J, Kieser H M, Lydiate D J, Smith C P, Ward J M, Schrempf H. Genetic manipulation of Streptomyces: a laboratory manual. Norwich, United Kingdom: The John Innes Foundation; 1985. [Google Scholar]
- 7.Horinouchi S, Beppu T. Autoregulatory factors and communication in actinomycetes. Annu Rev Microbiol. 1992;46:377–398. doi: 10.1146/annurev.mi.46.100192.002113. [DOI] [PubMed] [Google Scholar]
- 8.Janssen G R, Ward J M, Bibb M J. Unusual transcriptional and translational features of the aminoglycoside phosphotransferase gene (aph) from Streptomyces fradiae. Genes Dev. 1989;3:415–429. doi: 10.1101/gad.3.3.415. [DOI] [PubMed] [Google Scholar]
- 9.Kim H S, Nihira T, Tada H, Yanagimoto M, Yamada Y. Identification of binding protein of virginiae butanolide C, an autoregulator in virginiamycin production, from Streptomyces virginiae. J Antibiot. 1989;42:769–778. doi: 10.7164/antibiotics.42.769. [DOI] [PubMed] [Google Scholar]
- 10.Kinoshita H, Ipposhi H, Okamoto S, Nakano H, Nihira T, Yamada Y. Butyrolactone autoregulator receptor protein (BarA) as a transcriptional regulator in Streptomyces virginiae. J Bacteriol. 1997;179:6986–6993. doi: 10.1128/jb.179.22.6986-6993.1997. [DOI] [PMC free article] [PubMed] [Google Scholar]
- 11.Kisker C, Hinrichs W, Tovar K, Hillen W, Saenger W. The complex formed between Tet repressor and tetracycline-Mg2+ reveals mechanism of antibiotic resistance. J Mol Biol. 1995;247:260–280. doi: 10.1006/jmbi.1994.0138. [DOI] [PubMed] [Google Scholar]
- 12.Kitani S, Kinoshita H, Nihira T, Yamada Y. In vitro analysis of the butyrolactone autoregulator receptor protein (FarA) of Streptomyces lavendulae FRI-5 reveals that FarA acts as a DNA-binding transcriptional regulator that controls its own synthesis. J Bacteriol. 1999;181:5081–5084. doi: 10.1128/jb.181.16.5081-5084.1999. [DOI] [PMC free article] [PubMed] [Google Scholar]
- 13.Kleiner E M, Pliner S A, Soifer V S, Onoprienko V V, Blashova T A, Rosynov B V, Khokhlov A S. The structure of A-factor, a bioregulator from Streptomyces griseus. Bioorg Khim. 1976;2:1142–1147. [Google Scholar]
- 14.Kondo K, Higuchi Y, Sakuda S, Nihira T, Yamada Y. New virginiae butanolides from Streptomyces virginiae. J Antibiot. 1989;42:1873–1876. doi: 10.7164/antibiotics.42.1873. [DOI] [PubMed] [Google Scholar]
- 15.Mizuno K, Sakuda S, Nihira T, Yamada Y. Enzymatic resolution of 2-acyl-3-hydroxymethyl-4-butanolide and preparation of optically active IM-2, the autoregulator from Streptomyces sp. FRI-5. Tetrahedron. 1996;50:10849–10858. [Google Scholar]
- 16.Mori K. Revision of the absolute configuration of A-factor. Tetrahedron. 1983;39:3107–3109. [Google Scholar]
- 17.Murray M G. Use of sodium trichloroacetate and mung bean nuclease to increase sensitivity and precision during transcript mapping. Anal Biochem. 1986;158:165–170. doi: 10.1016/0003-2697(86)90605-6. [DOI] [PubMed] [Google Scholar]
- 18.Nakano H, Takehara E, Nihira T, Yamada Y. Gene replacement analysis of the Streptomyces virginiae barA gene encoding the butyrolactone autoregulator receptor reveals that BarA acts as a repressor in virginiamycin biosynthesis. J Bacteriol. 1998;180:3317–3322. doi: 10.1128/jb.180.13.3317-3322.1998. [DOI] [PMC free article] [PubMed] [Google Scholar]
- 19.Okamoto S, Nakajima K, Nihira T, Yamada Y. Virginiae butanolide binding protein from Streptomyces virginiae. J Biol Chem. 1995;270:12319–12326. doi: 10.1074/jbc.270.20.12319. [DOI] [PubMed] [Google Scholar]
- 20.Onaka H, Ando N, Nihira T, Yamada Y, Beppu T, Horinouchi S. Cloning and characterization of the A-factor receptor gene from Streptomyces griseus. J Bacteriol. 1995;177:6083–6092. doi: 10.1128/jb.177.21.6083-6092.1995. [DOI] [PMC free article] [PubMed] [Google Scholar]
- 21.Onaka H, Horinouchi S. DNA-binding activity of the A-factor receptor protein and its recognition DNA sequences. Mol Microbiol. 1997;24:991–1000. doi: 10.1046/j.1365-2958.1997.4081772.x. [DOI] [PubMed] [Google Scholar]
- 22.Sakuda S, Yamada Y. Stereochemistry of butyrolactone autoregulators from Streptomyces. Tetrahedron Lett. 1991;32:1817–1820. [Google Scholar]
- 23.Sambrook J, Fritsch E F, Maniatis T. Molecular cloning: a laboratory manual. 2nd ed. Cold Spring Harbor, N.Y: Cold Spring Harbor Laboratory; 1989. [Google Scholar]
- 24.Sakuda S, Yamada Y. Stereochemistry of butyrolactone autoregulators from Streptomyces. Tetrahedron Lett. 1991;32:1817–1820. [Google Scholar]
- 25.Sato K, Nihira T, Sakuda S, Yanagimoto M, Yamada Y. Isolation and structure of a new butyrolactone autoregulator from Streptomyces sp. FRI-5. J Ferment Bioeng. 1989;68:170–173. [Google Scholar]
- 26.Yamada Y, Nihira T, Sakuda S. Biosynthesis and receptor protein of butyrolactone autoregulator of Streptomyces virginiae. Actinomycetologica. 1992;6:1–8. [Google Scholar]
- 27.Yamada Y, Sugamura K, Kondo K, Yanagimoto M, Okada H. The structure of inducing factors for virginiamycin production in Streptomyces virginiae. J Antibiot. 1987;40:496–504. doi: 10.7164/antibiotics.40.496. [DOI] [PubMed] [Google Scholar]
- 28.Yanagimoto M, Enatsu T. Regulation of a blue pigment production by γ-nonalactone in Streptomyces sp. J Ferment Technol. 1983;61:545–550. [Google Scholar]
- 29.Yanagimoto M, Terui G. Physiological studies staphylomycin production. II. Formation of a substance effective in inducing staphylomycin production. J Ferment Technol. 1971;49:611–618. [Google Scholar]
- 30.Waki, M., T. Nihira, and Y. Yamada. Cloning and characterization of the gene (farA) encoding the receptor for an extracellular regulatory factor (IM-2) from Streptomyces sp. strain FRI-5. J. Bacteriol. 179:5131–5137. [DOI] [PMC free article] [PubMed]