

Abstract
The β3‐adrenergic receptor (β3‐AR) is found in several tissues such as adipose tissue and urinary bladder. It is a therapeutic target because it plays a role in thermogenesis, lipolysis, and bladder relaxation. Two β3‐AR agonists are used clinically: mirabegron 1 and vibegron 2, which are indicated for overactive bladder syndrome. However, these drugs show adverse effects, including increased blood pressure in mirabegron patients. Hence, new β3‐AR agonists are needed as starting points for drug development. Previous pharmacophore modeling studies of the β3‐AR did not involve experimental in vitro validation. Therefore, this study aimed to conduct prospective virtual screening and confirm the biological activity of virtual hits. Ligand‐based pharmacophore modeling was performed since no 3D structure of human β3‐AR is yet available. A dataset consisting of β3‐AR agonists was prepared to build and validate the pharmacophore models. The best model was employed for prospective virtual screening, followed by physicochemical property filtering and a docking evaluation. To confirm the activity of the virtual hits, an in vitro assay was conducted, measuring cAMP levels at the cloned β3‐AR. Out of 35 tested compounds, 4 compounds were active in CHO−K1 cells expressing the human β3‐AR, and 8 compounds were active in CHO−K1 cells expressing the mouse β3‐AR.
Keywords: β3-adrenergic receptors, agonist activity, pharmacophore modeling, virtual screening, GPCR

1. Introduction
The β‐adrenergic receptors (β‐ARs) belong to the family of G protein‐coupled receptors (GPCRs). [1] Agonists and antagonists at the β1‐adrenergic receptor (β1‐AR) and β2‐adrenergic receptor (β2‐AR) subtypes (such as salbutamol, formoterol, and propranolol) have been clinically used for decades, primarily for the treatment of asthma and cardiovascular disease. [2] In 1989, β3‐AR was successfully cloned and confirmed as a third subtype. [3] Agonists at the β3‐AR exhibited anti‐obesity effects at rodent adipose tissue since it has important roles in mediating metabolic functions such as lipolysis and thermogenesis. [4] However, β3‐ARs were identified later in multiple tissues including urinary bladder and heart,[ 5 , 6 ] where they modulate some physiological functions such as bladder relaxation, lowering or increasing cardiac contractility, and relaxation of the myometrium. [5]
Since its discovery in the late 1980s, research has focused on identifying β3‐AR agonists since they showed anti‐obesity and anti‐diabetic effects in mouse and rat models of obesity. [7] Early β3‐AR agonists including BRL37344 3 and CL316243 4 were potently increasing adipose tissue lipolysis, fat oxidation, insulin secretion, and insulin‐mediated glucose uptake in rodents. [7] The translation of these agonists into humans was ineffective.[ 6 , 8 ] In the early 1990s, rafabegron (TAK‐677) 5 was developed by Dainippon as an anti‐obesity and anti‐diabetic agent. However, its clinical trial failed as no significant clinical outcome was achieved in obese patients.[ 1 , 9 ] This compound was unable to stimulate energy expenditure or fat oxidation in humans. [10] Another compound reported by Lilly, LY377604 6, exerted anti‐obesity effects in humans,[ 1 , 11 ] however, no further studies have been published. For compound 6 as well as for several other pharmaceutical companies’ compounds, poor oral bioavailability was reported as a particular problem. [8] Compound 6 exhibited around 10–20 % oral bioavailability. [1] Most of the first series of β3‐AR agonists contained a carboxylic acid moiety, which can undergo rapid glucuronidation during first‐pass metabolism. [1] Due to these drawbacks, the interest in the development of β3‐AR ligands declined by 2006. [7] Even though efforts on improving physicochemical properties to increase oral bioavailability either via a prodrug approach (e. g. esters) or via the use of acid bioisosters had been made, clinical trials still yielded disappointing data. [1] The main cause for this poor outcome was the compound's low efficacy at the human receptor. [8] The rodent data could not be translated into humans because of the different expression patterns of β3‐ARs between species, particularly in adipose tissue. [6] In humans, β3‐AR mRNA expression is lower than in rodent adipose tissue.[ 6 , 8 ] In rodents, both white and brown adipose tissues express β3‐ARs which have roles in lipolysis and thermogenesis. [12] However, adult humans have a predominance of white adipose tissue, which has little β3‐AR expression. Studies showed little or no lipolysis or thermogenesis following β3‐AR activation, which led to the lack of clinical effects of β3‐AR agonists for the treatment of obesity and diabetes, respectively.[ 12 , 13 ]
Therefore, several studies were conducted to explore other potential uses of β3‐AR agonists. [1] Sanofi repurposed amibegron 7 from treating metabolic disorders to treating depression as β3‐ARs are also expressed in the brain showing antidepressant and anxiolytic activities.[ 1 , 14 ] However, this drug never entered the market as the clinical trials for treatment of depression (NCT00855530) and anxiety disorder (NCT00332891) were terminated in phase III due to a lack of efficacy. [5] Another repurposing study was conducted by GSK who had developed solabegron 8.[ 1 , 5 ] It was initially planned to be used as an antidiabetic drug but was then shifted to be used in overactive urinary bladder (OAB) syndrome. [1] Solabegron entered phase II studies and showed promising clinical results. [15] In contrast, the development of ritobegron 9, another β3‐ARs agonist for OAB treatment developed by Kissei Pharmaceuticals, was terminated in phase III (NCT01003405) because the efficacy endpoints were not met.[ 1 , 16 ] Finally in 2012, the FDA approved mirabegron 1 developed by Astellas Pharma.[ 1 , 17 ] It became the first clinical drug that acts via the β3‐AR for OAB syndrome treatment under the brand name Myrbetriq. [18] This was followed by vibegron 2, developed by Urovant Sciences, which has been used clinically in Japan since 2018[ 5 , 19 ] and was approved by the FDA in 2020 under the market name Gemtesa. [20] Mirabegron 1 shows some adverse effects in the cardiovascular system, such as increased blood pressure, because β3‐ARs are also present in the myocardium and blood vessels.[ 21 , 22 ] Also vibegron 2 causes adverse events such as headache, nausea, or diarrhea. Therefore, new β3‐AR agonists are still needed as starting points for drug development.
Pharmacophore modeling is an established method in early drug discovery and development since it helps to reduce the number of compounds to be tested experimentally. The approach deploys a pharmacophore model to virtually screen compounds that fit into the model, thus predicting active compounds. [23] Many pharmacophore modeling studies successfully yielded several promising ligands.[ 24 , 25 , 26 ] Pharmacophore modeling studies using the β3‐AR as a target were conducted previously. However, none of those studies involved experimental in vitro validation of predicted hits.[ 27 , 28 , 29 , 30 , 31 ] Therefore, this study aimed to perform pharmacophore‐based virtual screening and also confirm the biological activity of selected hit compounds.
2. Methods
2.1. Homology Modeling and Structure Assessment
Homology modeling was performed in SWISS‐MODEL (https://swissmodel.expasy.org/), [32] which relies on ProMod3 v1.1.0. [33] The human β3‐AR (hβ3‐AR) was constructed using the user‐template mode. The hβ3‐AR sequence consists of 408 amino acids and was downloaded from UniProt (https://www.uniprot.org/) [34] with the primary accession number P13945. This sequence was submitted as input in SWISS‐MODEL. The crystal structure of the human β2‐AR (hβ2‐AR) (PDB‐ID: 3SN6, res: 3.20 Å) [35] was retrieved from the Protein Data Bank (www.drugbank.ca) [36] and used as the template. Previously, the 3D structure of hβ2‐AR was analysed in Maestro v11.8.012 (Schrödinger Release 2018‐4). [37] Completion of missing loops was done using Prime (Schrödinger Release 2018‐4). [38] The ligand BI167107 bound in the crystal structure of the template was embedded into the homology model of hβ3‐AR. The homology model was prepared and minimized using the Protein Preparation Wizard (Schrödinger Release 2018‐4) [39] including protonation; creation of disulfide bonds; filling missing side chains; generate HET states with EPIK; [40] and refinement. During the refinement, the optimization of hydrogen bonds and orientations of Asn, Gln, and His residues were assigned using PROPKA. [41] In the end, a restrained minimization was applied using OPLS3e. [42] Sequence alignment between hβ2‐AR and hβ3‐AR was also carried out. The quality of the final model was evaluated by the structure assessment tool in SWISS‐MODEL in which runs MolProbity v4.4. [43] In order to allow a more reliable evaluation of the model, several methods were applied: [44]
Physics‐based method. MolProbity, which is implemented in SWISS‐MODEL, is used to detect backbone outliers, side‐chain outliers (rotamer deviations), and inappropriate all‐atom contacts (atomic clashes). To detect the backbone outliers, Ramachandran outliers and Cβ deviation outliers are the most important ones, since both can contribute to huge errors. [44] A Ramachandran plot is a simple bi‐dimensional plot with the ϕ (phi) value on the horizontal axis and the ψ (psi) value on the vertical axis, which correspond to the protein secondary structure. [45] This plot is divided into three regions: those where there are no interatomic clashes, those where there are moderate clashes, and those where clashes are extremely severe, considered as fully allowed, partially allowed, and forbidden, respectively. [45] The amino acids in forbidden regions are identified as Ramachandran outliers. [45] Cβ deviation outliers indicated the distortion around Cα are detected in case the deviation of the observed Cβ atom from ideal position is >0.25 Å.[ 43 , 46 ] A model is considered to have good quality when 98 % of the amino acids in the Ramachandran plot are fully allowed, a maximum of 0.2 % are Ramachandran outliers, and 0 for Cβ deviation outliers. [43]
Knowledge‐based method. In this method, Qualitative Model Energy Analysis (QMEAN), which is implemented in SWISS‐MODEL, is used to calculate Cβ interaction energy, all‐atoms pairwise energy, torsion angle energy, and solvation energy. [44] A model with a QMEAN Z‐score around 0 indicates a good agreement between the model structure and experimental structures. A QMEAN Z‐score below −4 would be considered low quality. [47]
Experiment‐based method. The root‐mean‐square deviation (RMSD) is the simplest method which measures the distances between all the atoms in both 3D experimental and model structures. [44] RMSD Cα is used to evaluate the 3D structure model. Depending on the degree of sequence identity or similarity, and the quality of the alignment, RMSD Cα can be up to ∼1–2 A°, [58] which means good accuracy.
2.2. Generation and Validation of the Pharmacophore Model
2.2.1. Dataset Preparation and Conformation Generation
Various β3‐AR agonists were collected from databases such as ChEMBL, [59] PubChem, [60] BindingDB, [61] IUPHAR/BPS Guide to PHARMACOLOGY, [2] and also from the literature.[ 49 , 50 , 51 , 52 , 53 , 55 , 56 , 62 ] β3‐AR agonists bear stereocenters or chiral centers in their structure. However, the studies related to stereochemistry of these ligands are limited. The potency of compound 3 and its isomers were investigated by Oriowo et al. and revealed that its RR isomer were the most potent. [63] This finding was also supported by Harada et al. [64] In addition, the RS and SR isomers exhibited similar potency and the least active, SS isomer had very low potency.[ 63 , 64 ] Thus, β3‐AR ligands activity depends on the stereochemical configuration since each isomer possesses its own activity. However, both studies revealed that the racemic structures were potent as well. Moreover, the activity of most β3‐AR agonists was determined based on their racemic structures. Therefore, also in the modeling part of this work, racemic structures were used. Only compounds that increased cAMP levels in cells expressing the hβ3‐AR were selected and prepared as a dataset to build and validate the pharmacophore model. Duplicates were removed by comparing the compounds’ smiles codes in DataWarrior v4.7.2. [65] The dataset contained 95 unique compounds including 11 known selective β3‐AR agonists for which their agonist activity has been studied in preclinical or clinical studies and 84 compounds, which were classified on the basis of their activity. They were grouped according to their EC50 as highly active (≤15 nM), moderately active (15 nM–100 nM), weakly active (100 nM–100 μM), and inactive (EC50>100 μM or not determined). This dataset was split into two subsets. The training set listed in Table 1 consisted of the 11 β3‐AR agonists investigated in (pre‐)clinical studies and eight additional highly active, structurally diverse compounds. Seventy‐six compounds formed the test set containing 72 active and four inactive compounds (Supporting Information Table S1). The 3D conformations of the training set compounds were generated using Omega v2.3.3 [66] with BEST settings (500 conformations/molecule) in LigandScout v3.12 (Inte:Ligand GmbH, Vienna). [67] Because of limited inactive experimental compounds, decoys were included in the virtual screening. The SMILES codes of all the 91 active compounds from the whole dataset were used as input to generate decoys using DUD‐E [68] with standard settings (http://dude.docking.org/).
Table 1.
Training set for the β3‐AR pharmacophore model.
|
Compound structure |
EC50 (nM)[a] |
Compound structure |
EC50 (nM)[a] |
|---|---|---|---|
|
|
|
1.6 [48] |
|
|
Mirabegron 1 |
|
L742791 11 |
|
|
|
1.1 [19] |
|
4 [49] |
|
Vibegron 2 |
|
CHEMBL32599 12 |
|
|
|
21 [7] |
|
6 [50] |
|
BRL37344 3 |
|
CHEMBL75604 13 |
|
|
|
18 [7] |
|
6.3 [51] |
|
CL316243 4 |
|
CHEMBL22318 14 |
|
|
|
0.062 [9] |
|
13 [52] |
|
Rafabegron 5 |
|
CHEMBL127656 15 |
|
|
|
2.4 [11] |
|
13 [51] |
|
LY377604 6 |
4.3 [7] |
CHEMBL22375 16 |
|
|
|
3.16 [7] |
|
1.3 [53] |
|
Amibegron 7 |
|
CHEMBL12769 17 |
|
|
|
3.98 [54] |
|
4.3 [55] |
|
Solabegron 8 |
6.9 [7] |
CHEMBL331744 18 |
|
|
|
73 [16] |
|
0.75 [56] |
|
|
|
1,7‐cyclized indole derivative 19 |
|
|
|
0.079 [57] |
|
|
|
L755507 10 |
0.4 [7] |
 Ritobegron 9
[a] The activity based on increasing cAMP level in CHO‐hβ3‐AR cells.
2.2.2. Pharmacophore Model Generation and Quality Assessment of the Pharmacophore Models
The pharmacophore models were built based on the training set. The pharmacophore features were extracted through ligand‐based pharmacophore model calculations. Pharmacophore models were generated using the espresso algorithm [23] implemented in LigandScout. In the model generation, pharmacophore fit, atom overlap and merged feature pharmacophore were selected as the scoring function and pharmacophore type, respectively. Exclusion volumes were created to represent potential steric restrictions of the binding site. In LigandScout, exclusion volume spheres are generally positioned based on an iterative placement algorithm: On a grid with 1.5 Å resolution, all points within three Å of any training set atom center with a distance of less than three Å to a hydrogen bond or a hydrophobic contact feature are considered as potential coordinates for an exclusion volume sphere. All such spheres that would clash with the van der Waals radius of any aligned training set atom are subsequently removed resulting in an exclusion volume sphere ‘coat’ that sterically represents the negative shape of the aligned training set molecules.
Before using the models for virtual screening, they were validated theoretically to evaluate their performance. Seventy‐ two active compounds, four inactive compounds, and 6229 decoys were transformed into a screening validation database using the idbgen‐tool with Omega‐best settings. The assessment of the pharmacophore model quality was carried out by deploying the pharmacophore model to screen against this database. In the virtual screening process, pharmacophore fit, match all query features, and best matching conformation were selected as screening parameters for scoring function, screening mode, and retrieval mode, respectively. The parameters used for evaluating the pharmacophore model were the calculation of receiver operating characteristic (ROC) curves and enrichment factors (EFs). The ideal model depicts a steep slope ROC‐curve and has a high AUC and EF value: [69]
where a is the number of truly active compounds retrieved by the model, n is the number of hits, A is the number of all true active compounds and N is the total number of compounds in the screening database.
2.3. Pharmacophore‐based Virtual Screening
The selected pharmacophore model was used for virtual screening against the SPECS [70] and Drugbank databases. [71] These libraries containing 219.931 compounds in total were generated in LigandScout using the same settings as for the validation database. The virtual screening process followed the procedure described in section 2.2.2. Only those compounds that fitted into all features of the pharmacophore model were predicted to be active and were called hit compounds. [23]
2.4. Selection of Hits for Biological Activity Testing
The hit compounds which fitted the pharmacophore model were considered for biological testing. However, their number was huge and additional post‐screening filters were needed to select fewer hit compounds. There are two types of filters involved in this process: physicochemical properties filter and docking evaluation.
2.4.1. Physicochemical Properties Filter
The screening results were first filtered by the physicochemical parameters. The filter contained several parameters derived from β3‐ARs agonists in the training set: molecular weight (MW 240–640); partition coefficient (ClogP 0,10–6,7); number of hydrogen acceptors (HAC≤11) and hydrogen donors (HDO≤6); polar surface area (PSA 65–180); number of rotatable bonds (RTB 3–16) and aromatic rings 2–5. These parameters were calculated in DataWarrior v4.7.2. [65] Additionally, to ease the selection process, the screening results were also analyzed for molecular similarity using the FragFp descriptor calculated by Tanimoto metric and visualized using 2D‐Ruber Band Scaling approach [65] implemented in DataWarrior. The result of the similarity analysis was visualized as a similarity chart which displayed the chemical space of all compounds, and similar compounds are connected with a line. Based on this similarity chart, the compounds were grouped by various scaffolds.
2.4.2. Molecular Docking
The hit compounds passing the physicochemical properties filter were filtered again using a docking evaluation. The 3D structures of the compounds were prepared with Omega v2.3.3 in LigandScout. Docking was performed with GOLD v5.7.0 [72] using the docking wizard. Because no 3D structure of the human β3‐AR was available, the homology model of hβ3‐AR described in section 2.1 was employed. ChemPLP was used as scoring function. [73] The binding site was defined based on BI167107 as reference ligand. The cavity was set within 6 Å of the bound molecule. To evaluate the performance of the docking protocol, the validation was performed by re‐docking and RMSD value calculation between the docked ligand and the reference ligand. [74] The RMSD was 0.34 Å in this case. In general, protein‐ligand docking is a tool to predict binding poses and estimate binding affinity. [74] Therefore, docking results of hit compounds were evaluated visually to select the best interacting pose based on interactions and steric fit rather than the highest scoring pose. In summary, scaffold and/or structure variation, pharmacophore score, and docking evaluation were all considered in the selection of hit compounds for biological testing. In advance of biological activity testing, the selected compounds were examined using SciFinder (https://scifinder.cas.org) [75] for known activity data including current patents to avoid double testing.
2.5. In Vitro Testing
To confirm the activity of the hit compounds, cell‐based assays measuring cAMP levels were performed.
2.5.1. Materials and Assay System
The selected hit compounds were purchased from SPECS. The compounds were tested in Chinese Hamster Ovary K1 cells expressing either the human β3‐AR (CHO‐hβ3‐AR cells) [76] or mouse β3‐AR (CHO‐mβ3‐AR cells) [77] in order to measure the intracellular cAMP using Lance cAMP assay Kit. Clenbuterol (CLEN), BRL37344 (BRL), isoprenaline (ISO), and forskolin (FSK) were used as control compounds.
2.5.2. Measurement of cAMP Levels
Biological testing of hit compounds was described by da Silva Junior et. al. [78] CHO−K1 cells or CHO−K1, CHO‐mβ3‐AR or CHO‐hβ3‐AR cells were maintained in Dulbecco's Modified Eagle's Media: Nutrient Mixture F12 (DMEM/F12; Gibco, Cat# 10565018) containing 10 % (v/v) fetal bovine serum (FBS). Media was changed twice a week and cells were incubated at 37 °C with 5 % CO2. Prior to serum‐starvation (0 % FBS) for 24 hours, CHO cells were plated at 1 x 10⁴/well of 96 well plates. Cells were stimulated in the final volume of 100 μl stimulation buffer (0.1 % BSA, 5 mM HEPES, HBSS, 500 μM IBMX, pH 7.4) for 30 min at 37 °C. The stimulation was terminated by aspirating stimulation buffer and adding 50 μl ice‐cold 100 % ethanol. After ethanol was evaporated, 50 μl lysis buffer (0.1 % BSA, 0.3 % Tween 20, 5 mM HEPES, pH 7.4) was added to each well. The cAMP levels were quantified using 10 μl of cell lysate or cAMP standard. After adding 5 μl cAMP antibodies labeled with Alexa Fluor 647 in each well, 10 μl of detection solution containing biotin‐cAMP and eu‐W8044 labeled streptavidin were added at room temperature in reduced light condition. Time‐resolved Förster resonance energy transfer (FRET) signals were measured using a 2103 EnVision plate reader (PerkinElmer) at 340 nm excitation and 615/665 nm emission wavelengths. Concentration‐response curves were analyzed by nonlinear regression between log agonist vs response three parameters to calculate pEC50s.
Because β3‐AR agonists and antagonists share similar structural features, [8] assessment of ligands for antagonist activity was performed. Cells were treated with hit compounds (10 μM) for 30 min before addition of the non‐selective β‐AR agonist isoprenaline (ISO) at a submaximal concentration (300 nM). All results are expressed as a percentage of the response to ISO. All data were calculated and analyzed using GraphPad Prism v8.2.1 (GraphPad Software, San Diego, California USA, www.graphpad.com). Statistical significance was determined using unpaired t‐test with significant P<0.05.
2.6. Molecular Docking of the Active Compounds into Human β3‐AR and Mouse β3‐AR Modelled from the Dog β3‐AR 3D Structure
The compounds found active in the in vitro testing were docked into the hβ3‐AR and mouse β3‐AR (mβ3‐AR) binding sites to evaluate their interactions in those receptors, respectively. The receptors used for docking were constructed based on the structure of the dog β3‐AR (dβ3‐AR) (PDB ID: 7DH5, res: 3.16 Å) [79] in Maestro v11.8.012. In addition, two hβ3‐AR models constructed from hβ2‐AR and dβ3‐AR were compared and analyzed in Maestro and SWISS‐MODEL using its structure comparison tool. [80] The parameters for the evaluation were RMSD of the respective Cα atoms and the lDDT score presented as consistency value. [80] Molecular docking was performed as described in section 2.4.2 employing the hβ3‐AR and mβ3‐AR models, respectively. Sequence alignment among hβ3‐AR, mβ3‐AR, and dβ3‐AR was also analyzed.
3. Results and Discussion
3.1. Pharmacophore Modeling and Virtual Screening
To discover new β3‐AR agonists, pharmacophore modeling and virtual screening were performed. Ligand‐based pharmacophore modeling is suitable for this research question as there is no available 3D crystal structure of hβ3‐AR. The pharmacophore model illustrated in Figure 1A was assessed and the ROC/AUC and the EF100% revealed the values 0.90 and 10.2 respectively (Figure 1C), representing the best result of the created models.
Figure 1.
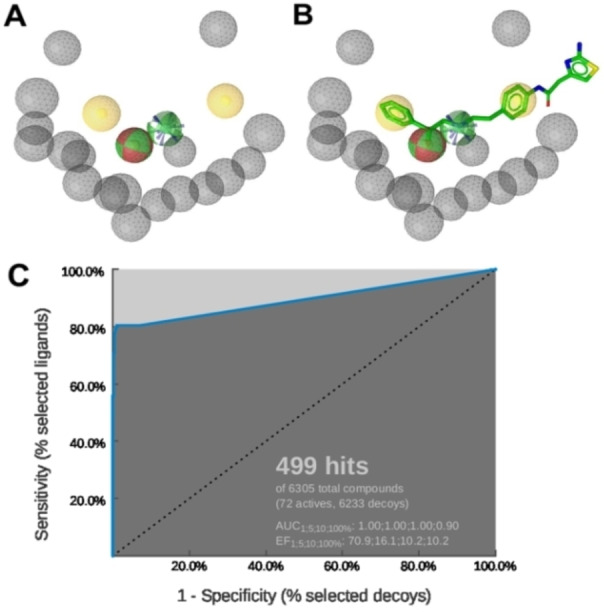
A: The ligand‐based pharmacophore model consisted of six pharmacophore features: two hydrophobic interactions (H) – yellow; two hydrogen bond donors (HBD) – green, one hydrogen bond acceptor (HBA) – red, a positively ionizable area (PI) – blue, and 18 exclusion volumes – grey. B: Alignment of mirabegron to the pharmacophore model. C: ROC curve from the theoretical validation of the pharmacophore model. In this screening, the 499 hits found by the model contained 58 true active compounds, 1 inactive compound, and 440 decoys.
Ligand‐based pharmacophore modeling for β3‐AR ligands has previously been conducted in several studies (Table 2). However, compared to our model, they had different chemical features due to variations in the datasets and the different software tools applied to construct the models. Remarkably, some features were common in all models, namely HBD, HBA, and PI located in the center. These features correspond to the ethanolamine moiety (−OH−C2H5−NH−), a typical scaffold of β‐AR ligands. [81] Also, most β3‐AR agonists share similar structural features, with their ethanolamine moiety playing a central role as the minimum pharmacophore. [1] This moiety is derived from the catecholamine structure of both the endogenous agonists adrenaline (epinephrine) and noradrenaline (norepinephrine). [81] The hydroxyl group (−OH) can serve in hydrogen bonding as both HBD and HBA, whereas the amine (−NH−) is involved in ionic binding or as HBD. Figure 1B illustrates exactly how these features map on mirabegron. In addition, H features were found more than once, indicating that non‐polar properties of ligands may contribute to ligand‐receptor interaction as well. By pharmacophore‐based virtual screening (Scheme 1), 1601 compounds from two commercial screening libraries were identified as potential hβ3‐AR ligands. These compounds were filtered by physicochemical properties and similarity calculations, which yielded 117 compounds. Finally, 35 compounds were selected for biological testing. They were examined in SciFinder for potentially known agonist activities on the hβ3‐AR prior to testing (the summary of search results is provided in Supporting Information Table S2).
Table 2.
Comparison of pharmacophore models.
|
Pharmacophore models |
Size of dataset (training set, test set) |
Pharmacophore features[a] |
Software |
|---|---|---|---|
|
Prathipati‐Saxena model [27] |
51 (34, 17) |
RA, PI, HBD, HBA, H |
Catalyst v4.6 |
|
Shakya model [28] |
4 |
HBA, HBD, HBA, HpAr, HpAl, RA |
Catalyst v4.7 |
|
Telvekar model [29] |
80 (56, 24) |
RA, HBA, PI, RA, RA, NI |
PHASE v3.0 |
|
[b]Jin model [30] |
144 (35, 109) |
H, PI, RA, H, HBA |
Catalyst v4.10 |
|
[b]Saxena‐Roy model [31] |
175 (51, 124) |
HBD, PI, H, NI, H |
Discovery Studio v2.0 |
|
Ujiantari model |
95 (19, 76) |
H, HBD, HBA, HBD, PI, H |
LigandScout v3.12 |
[a] HBD: hydrogen bond donor, HBA: hydrogen bond acceptor, PI: positive ionizable, NI: negative ionizable, H: hydrophobic interaction, RA: ring aromatic, HpAI: hydrophobic aliphatic, HpAr: hydrophobic aromatic.
[b] The model was used in the virtual screening process, but without biological testing of hits.
Scheme 1.

Workflow methodology of pharmacophore‐based virtual screening for discovery new β3‐AR agonists. The pharmacophore modeling part is shown in the blue area, the virtual screening part in the green one, and the in vitro part in the yellow one.
3.2. Homology Model of hβ3‐AR
In addition to the pharmacophore‐based virtual screening, docking into a β3‐AR homology model was conducted. Based on sequence alignment analysis, the hβ3‐AR shared 50 %, 63 %, and 68 % by sequence identity, sequence similarity, and homology, respectively with the hβ2‐AR.
Previous homology modeling studies with the hβ3‐AR were based on the 3D structure of the hβ2‐AR.[ 82 , 83 ] These models were based, however, on hβ2‐AR bound to the inverse agonist carazolol (PDB ID: 2RH1) [84] which is an inactive conformation. [35] Hence, the structure was modeled using the hβ2‐AR coupled to G proteins (PDB ID: 3SN6, res: 3.20 Å). [35] This structure was chosen as a template because this is the active conformation of the hβ2‐AR bound to a β2‐AR agonist, BI167107 [35] (Figure 2A). There are some significant differences between inactive and active structures, especially in the position of TM6. This helix differed by a 14 Å outward movement when measured at the Cα of E2686.30. [35] Based on the evaluation model, results showed that 97.09 % of the amino acid residues lied in favourable regions [43] represented in Ramachandran plots (Figure 2B). RMSD Cα, [58] Cβ deviations, [43] and QMEAN Z‐score [47] were 1.2658 Å, 0, and −2.78, respectively, indicating a good quality of the model. Hence, this model was used for docking in the virtual screening process. Re‐docking gave an RMSD value of 0.34 Å indicating that the docking protocol was reliable for pose prediction.
Figure 2.

A: 3D Structure alignment of hβ3‐AR – green with hβ2‐AR – orange and the binding site surfaces illustrated where the ligand is oriented nearly vertical inside the binding site located in the upper part of the receptor, close to the extracellular loop 2 (EL2). In the binding site, BI167107 interacted with N3127.38, D1133.32, S2035.42, and S2075.46 of hβ2‐AR through hydrogen binding. B: Ramachandran plot showing that 97.09 % of amino acid residues were situated in favored regions and no Ramachandran outlier was detected.
3.3. Biological Activities
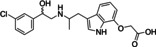
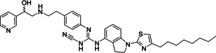
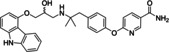
In case of the β3‐AR, binding assays are inappropriate to screen for agonist activity at the β3‐AR due to the low affinity of the available radioligands such as [125I]‐iodocyanopindolol and [3H]‐CGP 12,177. [85] Performing functional assays including agonist‐mediated increases in cAMP accumulation is a common method to test for β3‐AR agonist activity. Thirty five compounds were tested in two types of cloned‐CHO cells expressing either hβ3‐AR or mβ3‐AR. With 35 compounds tested, cAMP levels were increased by four compounds (20–23) in CHO‐hβ3‐AR cells, and by 8 compounds (20–27) in CHO‐mβ3‐AR cells (Figures 3–4). These increases in cAMP levels were due to actions at the β3‐AR since none of the hit compounds or selective β‐AR ligands increased cAMP levels in CHO−K1 cells lacking functional β3‐ARs (Supporting Information Figure S1). Virtual screening yielded true positive hit rates of 11.43 % and 22.86 % in CHO‐hβ3‐AR and CHO‐mβ3‐AR cells, respectively. The agonist potency activities of active hit compounds were lower than known β3‐AR agonists such as BRL37344 whose pEC50s were 6.78±0.13 and 9.16±0.3 in CHO‐hβ3‐AR cells and CHO‐mβ3‐AR cells, respectively. In screening paradigms, a hit means a compound which has the desired activity and whose activity is confirmed upon experimental testing, typically with a potency of 100 nM–5 μM at the target. [86] To become preclinical candidates, further work such as hit‐to‐lead process and lead optimization need to be conducted. These processes mainly focus on an thorough SAR investigation around a core compound to produce more potent and selective compounds with adequate pharmacokinetic properties. [86]
Figure 3.

Hit compounds were found to be active in both cells, CHO‐hβ3‐AR and CHO‐mβ3‐AR cells.
Figure 4.

Concentration‐dependent cAMP accumulation in CHO‐hβ3‐AR cells (A) and CHO‐mβ3‐AR cells (B). Eight compounds increased the cAMP level in a concentration‐dependent manner in both cells whereas compound 20 exhibited maximal response in only CHO‐mβ3‐AR cells at the highest concentration (B). 100 μM forskolin and 1 μM of clenbuterol (CLEN), BRL37344 (BRL) and Isoprenaline (ISO) were used as positive controls in the left of each graph. Each point represents Mean ±SEM of 3 independent experiments performed in duplicate.
Active hit compounds contained the ethanolamine moiety verifying that this structure is the main pharmacophore to induce conformational change in the receptor instigating the cAMP signaling pathway. Interestingly, compounds 28, 29, 30, 31, and 32 (Figure 5) did not increase cAMP levels in both cell types even though they contain this moiety. These compounds lacked the phenyl group on the hydroxy end, indicating that the ring system must be present to result in agonist activity. β3‐AR ligands had been categorized into two main chemical classes: arylethanolamines and aryloxypropanolamines both of which feature an aryl group on the hydroxy end.[ 7 , 8 ]
Figure 5.

Hit compounds were found inactive and weakly active.
In prior studies, the development of β3‐AR agonists focused on modification of both the hydroxy and the amine end of the ethanolamine. [1] β3‐AR agonists were usually modified at the amine end since it was proven to improve the activity and influence receptor selectivity over the β1‐ and β2‐AR.[ 1 , 7 ] As a consequence, pharmacophore modeling studies employing ligand‐based approaches extracted more hydrophobic features on the amine end (Table 2). The larger size and the presence of polar and/or ionizable functionalities seem to be beneficial to improve the activity and selectivity. [7]
Based on the cell‐based assay results, compounds 20 and 21 were the two most active ones in both the CHO‐hβ3‐AR and CHO‐mβ3‐AR cells. Even though compound 33 has a similar structure as compound 21, compound 33 only increased cAMP levels in CHO‐hβ3‐AR and CHO‐mβ3‐AR cells by 22.00±5.23 % and 31.14±7.39 % at 100 μM, respectively. Due to the presence of the ethoxy group in the phenyl ring at the amine end, compound 21’s activity was better than compound 33’s. In addition, the presence of a halogen substituent contributed to the higher pEC50 of compound 20 in comparison to compound 22. These facts support the idea that hydrophobic moieties on the amine end would improve activity. Most β3‐AR agonists possess an aromatic ring that is 2–3 linker atoms away from the amine end,[ 1 , 82 ] whereas our active compounds were separated by a methylene bridge. On the other hand, the phenyl or pyridyl groups are common ring systems found on the hydroxy end.[ 1 , 7 ] However, compound 26 carried a smaller ring, a tetrazole group, at this position, allowing further modification on this side.
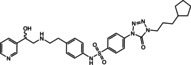
Since β‐AR agonists and antagonists frequently share similar molecular architecture, [8] 35 hit compounds were tested for potential antagonistic activity (Supporting Information Figure S2). Only compound 34 (Figure 6) at 10 μM significantly decreased the cAMP level by 31.75 % in CHO‐mβ3‐AR cells when stimulated by ISO.
Figure 6.

Hit compound was found active as a weak antagonist.
Hence, the pharmacophore model also identified a weak antagonist. Arch stated that the aryloxypropanolamine structure is typical of β3‐AR antagonists. [8] Compound 34 does not bear this structure, suggesting that the core structure of compound 34 acts as a bioisostere of the aryloxypropanolamine substructure. In the end, out of the 35 hit compounds, 26 compounds (compounds 28–33 in Figure 5 and compounds 35–54, provided in Supporting Information Figure S3), were found to be inactive.
The eight compounds found to be active as β3‐AR agonists in this study contained an ethanolamine moiety, and one compound with a different central moiety exhibited antagonist activity. In general, most β3‐AR agonists contain an ethanolamine moiety at the center of structure[ 1 , 8 ] because the development of β3‐AR agonist so far rather focused on modification on the amine and hydroxyl end. [1] This moiety was maintained or preserved since it is the main or minimum pharmacophore as it structurally represents the endogenous agonists epinephrine and norepinephrine. [1] Our initial aim was to seek new scaffolds to replace this moiety. Nevertheless, only compounds which bear this moiety exhibited agonist activity on the β3‐AR. However, when analyzing the novelty of a structure, the whole molecule is to be taken into account, not only a central moiety. Therefore, the discovered compounds were compared to the active compounds in the dataset using a Tanimoto metric with different fingerprints. These included hashed fingerprints and structural keys fingerprints, which are available in Canvas [87] (Supporting Information Section S1). Most of the newly discovered active hits had low score (<0.5), indicating that they were structurally different from the known active compounds.
Across species, the β3‐AR shares 80–90 % homology between human, mouse, and dog.[ 1 , 7 ] Recently, the 3D structure of dog β3‐AR (dβ3‐AR) bound to mirabegron with a resolution value of 3.16 Å (PDB ID: 7DH5) was successfully determined by Cryo‐EM technique. [79] Based on the sequence alignment results, the binding sites of the human and mouse β3‐AR differ only in three and four amino acid residues compared to the dog. Here, we assumed that there was no significant difference in the overall 3D conformation as well as the binding site and thus hβ3‐AR and mβ3‐AR were modeled based on the structure of the dβ3‐AR. Furthermore, the two hβ3‐AR models constructed from hβ2‐AR and dβ3‐AR were also compared to each other to ensure their similarity. The RMSD Cα was calculated to be 1.9 Å and most of the consistency values derived from the lDDT score of each residue fell into the range of 0.5–1, which means that both models were considered identical. The detailed results and explanations are provided in Supporting Information Figures S4 and S5. The most active compounds were docked into hβ3‐AR and mβ3‐AR models to evaluate the interactions. The visualization of docking results exhibited that compound 20 and 21 aligned in a similar orientation with mirabegron interacting with the amino acid residues in the binding site of the receptor (Figure 7).
Figure 7.

The interaction of 20 – yellow, 21 – pink, and mirabegron‐green in hβ3‐AR and mβ3‐AR.
Roy and Saxena concluded based on their docking studies that the amino acid residues involved in the binding with the β3‐AR agonists are localized in the transmembrane (TM) helices (TM3, TM5, TM6, and TM7) and extracellular loop 2 (EL2). [82] In concordance to prior studies,[ 79 , 82 , 83 ] the two amino acid residues D1173.32 and N3327.39 were predicted to be directly involved in binding the active compounds. At the hβ3‐AR, the hydroxyl and amine groups of the ethanolamine moiety interacted with the carboxylic acid group of D1173.32 and the amide group of N3327.39 through HBA and HBD. Besides hydrogen binding, ionic interactions were observed also between the amine group of the ethanolamine and the carboxylate ion of D1173.32. A site‐directed mutagenesis study conducted by Gros et al. proved that mutation of D1173.32 with leucine in hβ3‐AR led to the suppression of ligand binding and signal transduction. [88] In addition, mutation of N3327.39 with alanine in dβ3‐AR reduced the potency of mirabegron 80‐fold. [79] Therefore, both residues were found to be important for ligand binding at the β3‐AR. In addition, the phenyl ring on the hydroxy end in both compounds 20 and 21 contributed to a hydrophobic interaction with F3096.52. These similar interactions were present in the docking solutions in the mouse receptor as well. Sahi et al. found that S2085.42 and Ser2125.46 form hydrogen bonds with the hydroxyl group of catechol of the endogenous agonists. [83] However, most β3‐AR agonists lack a catechol group, therefore this hydrogen bonds were mostly absent. [82] Nagiri et al. proved that they are not essential for mirabegron potency by mutating these serine residues with alanine residues. [79]
Previous studies discovered that the binding affinity and efficacy of noradrenaline and isoprenaline were higher at the human receptors than the murine receptors.[ 89 , 90 , 91 ] Conversely, other β3‐AR agonists such as adrenaline, BRL37344, and CL316243 exhibited lower affinity and efficacy at the human receptors than the rodent receptors.[ 90 , 91 , 92 ] Previous studies showed that many β3‐AR agonists were found to have low efficacy at the human receptors. [93] Our finding also revealed more active compounds for mouse receptors compared to human receptors. This is thought to be due to subtle differences in the binding site of the rodent receptors versus human receptors. [21] As previously stated by Roy and Saxena, A197 in the EL2 domain of the hβ3‐AR that corresponds to the aspartic acid residue at both hβ1‐AR and hβ2‐AR, must be involved in the selectivity within hβ‐ARs. [82] In line with this, the hydroxyl group of S194 (EL2) of mβ3‐ARs interacted with compound 21 (Figure 7) and mirabegron through hydrogen binding. This suggests that this interaction may improve activity at the mouse but not the human receptors explaining why our active compounds appear to have higher activity at the mouse. However, Nagiri et al. tried to prove the involvement of EL2 in selectivity. Three residues in EL2 between dβ3‐AR and hβ2‐AR were swapped, namely A197, A199, and S200 of dβ3‐AR replaced by D192, F194, T195 of hβ2‐AR, and vice versa. [79] The results showed that these residues did not fully explain mirabegron selectivity. [79] Based on the 3D structures of dβ3‐AR, hβ2‐AR, and hβ1‐AR, the upper part of the binding site in dβ3‐AR is narrower, thus it shapes a perpendicular cavity which may affect mirabegron selectivity. [79] This finding may apply between human and dog β3‐ARs since both share more similarity than mouse β3‐AR. Therefore, the mutagenesis study in mouse may need to be carried out to understand the selectivity within species.
4. Conclusions
A ligand‐based pharmacophore model for β3‐AR agonists was developed and experimentally validated. Our approach yielded eight novel β3‐AR agonists that can be further characterized in vitro and may serve as starting points for the further development of β3‐AR agonists. The active compounds were more efficient at the mouse receptors compared to the human receptors. Screening of additional libraries may find compounds that are more active and could also help to improve the quality of the pharmacophore model. The ethanolamine moiety in the center of the ligand structure seemed essential for activity. In addition, agonist activity required a phenyl group at the hydroxy end. In our finding, this could be replaced by another aromatic ring system suggesting scaffold hopping. Further studies are also needed to evaluate potential bioisostere replacements for the ethanolamine moiety. In our study, the pharmacophore model unexpectedly also detected an antagonist.
Authors Contributions
The manuscript was written through contributions of all authors. All authors have given approval to the final version of the manuscript.
Conflict of interest
None declared.
5.
Supporting information
As a service to our authors and readers, this journal provides supporting information supplied by the authors. Such materials are peer reviewed and may be re‐organized for online delivery, but are not copy‐edited or typeset. Technical support issues arising from supporting information (other than missing files) should be addressed to the authors.
Supporting Information
Supporting Information
Supporting Information
Acknowledgements
We thank the Directorate General of Higher Education (DIKTI) and Österreichische Austauschdienst‐Gesellschaft (OeAD) for supporting this research. Prof. Dr. Daniela Schuster is an Ingeborg Hochmair Professor of the University of Innsbruck. We acknowledge the help of Dr. Gudrun C. Thurner, Department of Pathology, Medical University of Innsbruck, and Philipp Schuster for their assistance in the manuscript preparation. Thank you to Prof. Gerhard Wolber for the technical description of the exclusion volume placement algorithm implemented in LigandScout's ligand‐based pharmacophore modeling tool espresso.
N. S. O. Ujiantari, S. Ham, C. Nagiri, W. Shihoya, O. Nureki, D. S. Hutchinson, D. Schuster, Mol. Inf. 2022, 41, 2100223.
Data Availability Statement
All relevant data are fully disclosed in the supporting information files. If further data are required, they are available from the corresponding author upon request.
References
- 1. Edmondson S. D., Comprehensive Medicinal Chemistry III, Vol. 7 (Eds: Chackalamannil S., Rotella D., Ward S. E.), Elsevier, Oxford: 2017, pp. 714–737. [Google Scholar]
- 2. Alexander S. P. H., Christopoulos A., Davenport A. P., Kelly E., Mathie A., Peters J. A., Veale E. L., Armstrong J. F., Faccenda E., Harding S. D., Pawson A. J., Sharman J. L., Southan C., Davies J. A., Br. J. Pharmacol. 2019, 176, S21–S141. [DOI] [PMC free article] [PubMed] [Google Scholar]
- 3. Emorine L. J., Marullo S., Sutren M. M. B., Patey G., Tate K., Klutchko C. D., Strosberg A. D., Science 1989, 245, 1118–1121. [DOI] [PubMed] [Google Scholar]
- 4. Arch J. R. S., Ainsworth A. T., Cawthorne M. A., Piercy V., Sennitt M. V., Thody V. E., Wilson C., Wilson S., Nature 1984, 309, 163–165. [DOI] [PubMed] [Google Scholar]
- 5. Schena G., Caplan M. J., Cells 2019, 8, 1–24. [DOI] [PMC free article] [PubMed] [Google Scholar]
- 6. Cernecka H., Sand C., Michel M. C., Mol. Pharmacol. 2014, 86, 479–484. [DOI] [PubMed] [Google Scholar]
- 7. Arch J. R. S., Eur. J. Pharmacol. 2002, 440, 99–107. [DOI] [PubMed] [Google Scholar]
- 8. Perrone M. G., Scilimati A., Expert Opin. Ther. Pat. 2011, 21, 505–536. [DOI] [PubMed] [Google Scholar]
- 9. Harada H., Hirokawa Y., Suzuki K., Hiyama Y., Oue M., Kawashima H., Kato H., Yoshida N., Furutani Y., Kato S., Chem. Pharm. Bull. 2005, 53, 184–198. [DOI] [PubMed] [Google Scholar]
- 10. Redman L. M., d Jonge L., Fang X., Gamlin B., Recker D., Greenway F. L., Smith S. R., Ravussin E., J. Clin. Endocrinol. Metab. 2007, 92, 527–531. [DOI] [PubMed] [Google Scholar]
- 11. Jesudason C. D., Baker J. E., Bryant R. D., Fisher J. W., O'Farrell L. S., Gaich G. A., He M. M., Kahl S. D., Kriauciunas A. V., Heiman M. L., Peters M. A., Rito C. J., Satterwhite J. H., Tinsley F. C., Trankle W. G., Shuker A. J., ACS Med. Chem. Lett. 2011, 2, 583–586. [DOI] [PMC free article] [PubMed] [Google Scholar]
- 12. Evans B. A., Merlin J., Bengtsson T., Hutchinson D. S., Br. J. Pharmacol. 2019, 176, 2416–2432. [DOI] [PMC free article] [PubMed] [Google Scholar]
- 13. Michel M. C., Bond R. A., Summers R. J., Br. J. Pharmacol. 2019, 176, 2339–2342. [DOI] [PMC free article] [PubMed] [Google Scholar]
- 14. Overstreet D. H., Stemmelin J., Griebel G., Pharmacol. Biochem. Behav. 2008, 89, 623–626. [DOI] [PubMed] [Google Scholar]
- 15. Ohlstein E. H., Keitz A. V., Michel M. C., Eur. Urol. 2012, 62, 834–840. [DOI] [PubMed] [Google Scholar]
- 16. Maruyama I., Goi Y., Tatemichi S., Maruyama K., Hoyano Y., Yamazaki Y., Kusama H., Naunyn-Schmiedeberg's Arch. Pharmacol. 2012, 385, 845–852. [DOI] [PubMed] [Google Scholar]
- 17. Takasu T., Ukai M., Sato S., Matsui T., Nagase I., Maruyama T., Sasamata M., Miyata K., Uchida H., Yamaguchi O., J. Pharmacol. Exp. Ther. 2007, 321, 642–647. [DOI] [PubMed] [Google Scholar]
- 18. Sacco E., Bientinesi R., Ther. Adv. Urol. 2012, 4, 315–324. [DOI] [PMC free article] [PubMed] [Google Scholar]
- 19. Keam S. J., Drugs 2018, 78, 1835–1839. [DOI] [PubMed] [Google Scholar]
- 20. Yuan S., Luo Y. Q., Zuo J. H., Liu H., Li F., Yu B., Eur. J. Med. Chem. 2021, 215, 113284. [DOI] [PubMed] [Google Scholar]
- 21. Dehvari N., Junior E. D. S., Bengsston T., Hutchinson D. S., Br. J. Pharmacol. 2018, 175, 4072–4082. [DOI] [PMC free article] [PubMed] [Google Scholar]
- 22. Staskin D., Frankel J., Varano S., Shortino D., Jankowich R., Mudd P. N., J. Urol. 2021, 205, 1421–1429. [DOI] [PubMed] [Google Scholar]
- 23. Vuorinen A., Schuster D., Methods 2015, 71, 113–34. [DOI] [PubMed] [Google Scholar]
- 24. Noha S. M., Jazzar B., Kuehnl S., Rollinger J. M., Stuppner H., Schaible A. M., Werz O., Wolber G., Schuster D., Bioorg. Med. Chem. Lett. 2012, 22, 1202–1207. [DOI] [PMC free article] [PubMed] [Google Scholar]
- 25. Schuster D., Laggner C., Steindl T. M., Palusczak A., Hartmann R. W., Langer T., J. Chem. Inf. Model. 2006, 43, 1301–1311. [DOI] [PubMed] [Google Scholar]
- 26. Vuorinen A., Nashev L. G., Odermatt A., Rollinger J. M., Schuster D., Mol. Inf. 2014, 33, 15–25. [DOI] [PubMed] [Google Scholar]
- 27. Prathipati P., Saxena A. K., J. Comput.-Aided Mol. Des. 2005, 19, 93–110. [DOI] [PubMed] [Google Scholar]
- 28. Shakya N., Roy K. K., Saxena A. K., Bioorg. Med. Chem. 2009, 17, 830–47. [DOI] [PubMed] [Google Scholar]
- 29. Telvekar V. N., Patel D. J., Jadhav N. C., Mishra S. J., Med. Chem. Res. 2010, 19, 1174–1190. [Google Scholar]
- 30. Jin F., Lu C., Sun X., Li W., Liu G., Tang Y., Mol. Diversity 2011, 15, 817–831. [DOI] [PubMed] [Google Scholar]
- 31. Saxena A. K., Roy K. K., SAR QSAR Environ. Res. 2012, 23, 389–407. [DOI] [PubMed] [Google Scholar]
- 32. Waterhouse A., Bertoni M., Bienert S., Studer G., Tauriello G., Gumienny R., Heer F. T., Beer T. A. P., Rempfer C., Bordoli L., Lepore R., Schwede T., Nucleic Acids Res. 2018, 46, W296–W303. [DOI] [PMC free article] [PubMed] [Google Scholar]
- 33. Studer G., Tauriello G., Bienert S., Biasini M., Johner N., Schwede T., PLoS Comput. Biol. 2021, 17, 1–18. [DOI] [PMC free article] [PubMed] [Google Scholar]
- 34. Boutet E., Lieberherr D., Tognolli M., Schneider M., Bairoch A., Plant Bioinformatics, vol. 406 (Eds: Edwards D.), Humana Press; 2007, pp 89–112. [DOI] [PubMed] [Google Scholar]
- 35. Rasmussen S. G. F., Choi H. J., Rosenbaum D. M., Kobilka T. S., Thian F. S., Edwards P. C., Burghammer M., Ratnala V. R. P., Sanishvili R., Fischetti R. F., Schertler G. F. X., Weis W. I., Kobilka B. K., Nature 2011, 477, 549–555.21772288 [Google Scholar]
- 36. Berman H. M., Westbrook J., Feng Z., Gilliland G., Bhat T. N., Weissig H., Shindyalov I. N., Bourne P. E., Nucleic Acids Res. 2000, 28, 235–242. [DOI] [PMC free article] [PubMed] [Google Scholar]
- 37.Schrödinger Release 2018–4: Maestro, Schrödinger, LLC, New York, NY. 2018.
- 38. Jacobson M. P., Pincus D. L., Rapp C. S., Day T. J. F., Honig B., Shaw D. E., Friesner R. A., Proteins 2004, 55, 351–367. [DOI] [PubMed] [Google Scholar]
- 39. Sastry G. M., Adzhigirey M., Day T., Annabhimoju R., Sherman W., J. Comput.-Aided Mol. Des. 2013, 27, 221–234. [DOI] [PubMed] [Google Scholar]
- 40. Shelley J. C., Cholleti A., Frye L. L., Greenwood J. R., Timlin M. R., Uchimaya M., J. Comput.-Aided Mol. Des. 2007, 21, 681–691. [DOI] [PubMed] [Google Scholar]
- 41. Olsson M. H. M., Søndergaard C. R., Rostkowski M., Jensen J. H., J. Chem. Theory Comput. 2011, 7, 525–537. [DOI] [PubMed] [Google Scholar]
- 42. Roos K., Wu C., Damm W., Reboul M., Stevenson J. M., Lu C., Dahlgren M. K., Mondal S., Chen W., Wang L., Abel R., Friesner R. A., Harder E. D., J. Chem. Theory Comput. 2019, 15, 1863–1874. [DOI] [PubMed] [Google Scholar]
- 43. Chen V. B., W. B. Arendall III , Headd J. J., Keedy D. A., Immormino R. M., Kapral G. J., Murray L. W., Richardson J. S., Richardson D. C., Acta Crystallogr. Sect. D 2010, 66, 12–21. [DOI] [PMC free article] [PubMed] [Google Scholar]
- 44. Haddad Y., Adam V., Heger Z., PLoS Comput. Biol. 2020, 16, 1–19. [DOI] [PMC free article] [PubMed] [Google Scholar]
- 45. Carugo O., Carugo K. D., Acta Crystallogr. Sect. D 2013, 69, 1333–1341. [DOI] [PubMed] [Google Scholar]
- 46. Lovell S. C., Davis I. W., W. B. Arendall III , de Bakker P. I. W., Word J. M., Prisant M. G., Richardson J. S., Richardson D. C., Proteins 2003, 50, 437–450. [DOI] [PubMed] [Google Scholar]
- 47. Benkert P., Biasini M., Schwede T., Bioinformatics 2011, 27, 343–350. [DOI] [PMC free article] [PubMed] [Google Scholar]
- 48. Weber A. E., Ok H. O., Alvaro R. F., Candelore M. R., Cascieri M. A., Chiu S. L., Deng L., Forrest M. J., Hom G. J., Hutchins J. E., Kao J., Maclntyre D. E., Mathvink R. J., McLoughlin D., Miller R. R., Newbold R. C., Olah T. V., Parmee E. R., Perkins L., Steams R. A., Strader C. D., Szumiloski J., Tang Y. S., Tota L., Vicario P. P., Wyvratt M. J., Fisher M. H., Bioorg. Med. Chem. Lett. 1998, 8, 2111–2116. [DOI] [PubMed] [Google Scholar]
- 49. Hu B., Ellingboe J., Han S., Largis E., Mulvey R., Oliphant A., Sum F., Tillett J., J. Med. Chem. 2001, 44, 1456–1466. [DOI] [PubMed] [Google Scholar]
- 50. Parmee E. R., Brockunier L. L., He J., Singh S. B., Candelore M. R., Cascieri M. A., Deng L., Liu Y., Tota L., Wyvratt M. J., Fisher M. H., Weber A. E., Bioorg. Med. Chem. Lett. 2000, 10, 2283–2286. [DOI] [PubMed] [Google Scholar]
- 51. Shih T. L., Candelore M. R., Cascieri M. A., Chiu S. L., L. F. Colwell Jr , Deng L., Feeney W. P., Forrest M. J., Hom G. J., Maclntyre D. E., Miller R. R., Stearns R. A., Strader C. D., Tota L., Wyvratt M. J., Fisher M. H., Weber A. E., Bioorg. Med. Chem. Lett. 1999, 9, 1251–1254. [DOI] [PubMed] [Google Scholar]
- 52. Brockunier L. L., Candelore M. R., Cascieri M. A., Liu Y., Tota L., Wyvratt M. J., Fisher M. H., Weber A. E., Parmee E. R., Bioorg. Med. Chem. Lett. 2001, 11, 379–382. [DOI] [PubMed] [Google Scholar]
- 53. Weber A. E., Mathvink R. J., Perkins L., Hutchins J. E., Candelore M. R., Tota L., Strader C. D., Wyvratt M. J., Fisher M. H., Bioorg. Med. Chem. Lett. 1998, 8, 1101–1106. [DOI] [PubMed] [Google Scholar]
- 54. Igawa Y., Michel M. C., Naunyn-Schmiedeberg's Arch. Pharmacol. 2013, 386, 177–183. [DOI] [PubMed] [Google Scholar]
- 55. Mathvink R. J., Tolman J. S., Chitty D., Candelore M. R., Cascieri M. A., L. F. Colwell Jr , Deng L., Feeney W. P., Forrest M. J., Hom G. J., MacIntyre D. E., Miller R. R., Stearns R. A., Tota L., Wyvratt M. J., Fisher M. H., Weber A. E., J. Med. Chem. 2000, 43, 3832–3836. [DOI] [PubMed] [Google Scholar]
- 56. Mizuno K., Sawa M., Harada H., Taoka I., Yamashita H., Oue M., Tsujiuchi H., Arai Y., Suzuki S., Furutani Y., Kato S., Bioorg. Med. Chem. 2005, 13, 855–868. [DOI] [PubMed] [Google Scholar]
- 57. Baker J. G., Br. J. Pharmacol. 2010, 160, 1048–61. [DOI] [PMC free article] [PubMed] [Google Scholar]
- 58. Cavasotto C. N., Phatak S. S., Drug Discovery Today 2009, 14, 676–683. [DOI] [PubMed] [Google Scholar]
- 59. Davies M., Nowotka M., Papadatos G., Dedman N., Gaulton A., Atkinson F., Bellis L., Overington J. P., Nucleic Acids Res. 2015, 43, W612–W620. [DOI] [PMC free article] [PubMed] [Google Scholar]
- 60. Kim S., Chen J., Cheng T., Gindulyte A., He J., He S., Li Q., Shoemaker B. A., Thiessen P. A., Yu B., Zaslavsky L., Zhang J., Bolton E. E., Nucleic Acids Res. 2021, 49, D1388–D1395. [DOI] [PMC free article] [PubMed] [Google Scholar]
- 61. Liu T., Lin Y., Wen X., Jorissen R. N., Gilson M. K., Nucleic Acids Res. 2007, 35, D198–D201. [DOI] [PMC free article] [PubMed] [Google Scholar]
- 62. Tasler S., Baumgartner R., Aschenbrenner A., Ammendola A., Wolf K., Wieber T., Schachtner J., Blisse M., Quotschalla U., Ney P., Bioorg. Med. Chem. Lett. 2010, 20, 3399–3404. [DOI] [PubMed] [Google Scholar]
- 63. Oriowo M. A., Chapman H., Kirkham D. M., Sennitt M. V., R. R. Ruffolo Jr , Cawthorne M. A., J. Pharmacol. Exp. Ther. 1996, 277, 22–27. [PubMed] [Google Scholar]
- 64. Harada H., Hirokawa Y., Suzuki K., Hiyama Y., Oue M., Kawashima H., Yoshida N., Furutani Y., Kato S., Bioorg. Med. Chem. Lett. 2003, 13, 1301–1305. [DOI] [PubMed] [Google Scholar]
- 65. Sander T., Freyss J., Korff M. V., Rufener C., J. Chem. Inf. Model. 2015, 55, 460–473. [DOI] [PubMed] [Google Scholar]
- 66. Hawkins P. C. D., Nicholls A., J. Chem. Inf. Model. 2012, 52, 2919–2936. [DOI] [PubMed] [Google Scholar]
- 67. Wolber G., Langer T., J. Chem. Inf. Model. 2005, 45, 160–169. [DOI] [PubMed] [Google Scholar]
- 68. Mysinger M. M., Carchia M., Irwin J. J., Shoichet B. K., J. Med. Chem. 2012, 55, 6582–6594. [DOI] [PMC free article] [PubMed] [Google Scholar]
- 69. Seidel T., Wolber G., Murgueitio M. S., Applied Chemoinformatics, (Eds: Engel T., Gasteiger J.), Wiley-VCH, Weinheim: 2018, pp 259–282. [Google Scholar]
- 70.Specs, Compound management services and research compounds for the life science industry, https://www.specs.net, accessed 26th May 2019.
- 71.D. S. Wishart 1, C. Knox, A. C. Guo, S. Shrivastava, M. Hassanali, P. Stothard, Z. Chang, J. Woolsey, Nucleic Acids Res. 2006, 34, D668–D672. [DOI] [PMC free article] [PubMed]
- 72. Jones G., Willett P., Glen R. C., Leach A. R., Taylor R., J. Mol. Biol. 1997, 267, 727–748. [DOI] [PubMed] [Google Scholar]
- 73. Korb O., Stützle T., Exner T. E., J. Chem. Inf. Model. 2009, 49, 84–96. [DOI] [PubMed] [Google Scholar]
- 74. Kirchmair J., Markt P., Distinto S., Wolber G., Langer T., J. Comput.-Aided Mol. Des. 2008, 22, 213–28. [DOI] [PubMed] [Google Scholar]
- 75.SciFinder, Chemical Abstracts Service, https://scifinder.cas.org, accessed 10th June 2019.
- 76. Sato M., Hutchinson D. S., Evans B. A., Summers R. J., Mol. Pharmacol. 2008, 74, 1417–1428. [DOI] [PubMed] [Google Scholar]
- 77. Hutchinson D. S., Bengtsson T., Evans B. A., Summers R. J., Br. J. Pharmacol. 2002, 135, 1903–1914. [DOI] [PMC free article] [PubMed] [Google Scholar]
- 78. da Silva Junior E. D., Sato M., Merlin J., Broxton N., Hutchinson D. S., Ventura S., Evans B. A., Summers R. J., Br. J. Pharmacol. 2017, 174, 2318–2333. [DOI] [PMC free article] [PubMed] [Google Scholar]
- 79. Nagiri C., Kobayashi K., Tomita A., Kato M., Kobayashi K., Yamashita K., Nishizawa T., Inoue A., Shihoya W., Nureki O., Mol. Cell 2021, 81, 3205–3215. [DOI] [PubMed] [Google Scholar]
- 80. Mariani V., Biasini M., Barbato A., Schwede T., Bioinformatics 2013, 29, 2722–2728. [DOI] [PMC free article] [PubMed] [Google Scholar]
- 81. Kobilka B. K., Trends Pharmacol. Sci. 2011, 32, 213–218. [DOI] [PMC free article] [PubMed] [Google Scholar]
- 82. Roy K. K., Saxena A. K., J. Chem. Inf. Model. 2011, 51, 1405–1422. [DOI] [PubMed] [Google Scholar]
- 83. Sahi S., Tewatia P., Malik B. K., Curr. Comput.-Aided Drug Des. 2012, 8, 283–295. [DOI] [PubMed] [Google Scholar]
- 84. Cherezov V., Rosenbaum D. M., Hanson M. A., Rasmussen S. G. F., Thian F. S., Kobilka T. S., Choi H. J., Kuhn P., Weis W. I., Kobilka B. K., Stevens R. C., Science 2007, 318, 1258–1265. [DOI] [PMC free article] [PubMed] [Google Scholar]
- 85. Vrydag W., Michel M. C., Naunyn-Schmiedeberg's Arch. Pharmacol. 2007, 374, 385–398. [DOI] [PubMed] [Google Scholar]
- 86. Hughes J. P., Rees S., Kalindjian S. B., Philpott K. L., Br. J. Pharmacol. 2011, 162, 1239–1249. [DOI] [PMC free article] [PubMed] [Google Scholar]
- 87. Duan J., Dixon S. L., Lowrie J. F., Sherman W., J. Mol. Graphics Modell. 2010, 29, 157–170. [DOI] [PubMed] [Google Scholar]
- 88. Gros J., Manning B. S., Rouxel F. P., Guillaume J. L., Drumare M. F., Strosberg A. D., Eur. J. Biochem. 1998, 251, 590–596. [DOI] [PubMed] [Google Scholar]
- 89. Popp B. D., Hutchinson D. S., Evans B. A., Summers R. J., Eur. J. Pharmacol. 2004, 484, 323–331. [DOI] [PubMed] [Google Scholar]
- 90. Liggett S. B., Mol. Pharmacol. 1992, 42, 634–637. [PubMed] [Google Scholar]
- 91. Nahmias C., Blin N., Elalouf J. M., Mattei M. G., Strosberg A. D., Emorine L. J., EMBO J. 1991, 10, 3721–3727. [DOI] [PMC free article] [PubMed] [Google Scholar]
- 92. Hutchinson D. S., Chernogubova E., Sato M., Summers R. J., Bengtsson T., Naunyn-Schmiedeberg's Arch. Pharmacol. 2006, 373, 158–68. [DOI] [PubMed] [Google Scholar]
- 93. Arch J. R. S., Ther. Adv. Endocrinol. Metab. 2011, 2, 59–64. [DOI] [PMC free article] [PubMed] [Google Scholar]
Associated Data
This section collects any data citations, data availability statements, or supplementary materials included in this article.
Supplementary Materials
As a service to our authors and readers, this journal provides supporting information supplied by the authors. Such materials are peer reviewed and may be re‐organized for online delivery, but are not copy‐edited or typeset. Technical support issues arising from supporting information (other than missing files) should be addressed to the authors.
Supporting Information
Supporting Information
Supporting Information
Data Availability Statement
All relevant data are fully disclosed in the supporting information files. If further data are required, they are available from the corresponding author upon request.