Abstract
Quantitative fluorescence spectroscopy requires corresponding reflectance measurements to correct for tissue absorption and scattering. However, it is unclear whether fluorescence adds value beyond the diffuse reflectance measurements necessary for correction. The goal of this study was to compare the accuracy of fluorescence and diffuse reflectance spectroscopy in recovering the concentration of a high-extinction fluorophore, methylene blue (MB), using a compact fiber-optic probe. Fluorescence and diffuse reflectance measurements of tissue simulating phantoms were made using a fiber-optic probe with source-detector separations of 288-1300 μm. Average error in recovered fluorophore concentration was 20.4% for fluorescence and 15.0% for reflectance, though this difference was not significant (p=0.77). Both methods returned concentrations that were similar to known MB concentrations (p≥0.79 in both cases). Fluorescence quantification of the concentration of a high extinction fluorophore did not significantly improve accuracy relative to diffuse reflectance. Investigators should consider whether fluorescence measurements are necessary for a given application.
Keywords: Fluorescence, diffuse reflectance, intrinsic fluorescence, methylene blue
Introduction
Fluorescence spectroscopy has been used historically to examine many biologically relevant fluorophores and fluorescently labeled drugs[1]. Many of these applications rely on ratiometric approaches, which do not determine absolute fluorophore concentration but instead examine the ratio between fluorescence emitted at multiple wavelengths[2,3]. However, for applications where determination of the absolute concentration of a fluorescent substance is required, such as for photodynamic therapy (PDT) dosimetry[4,5], these ratiometric techniques cannot be applied. A crucial piece of quantitative fluorescence spectroscopy is correction for distortion of the excitation source and emitted fluorescence by tissue absorption and scattering[6]. A number of techniques have been proposed to perform this correction, ranging from simplistic division by a diffuse reflectance spectrum captured in the same geometry[7] to empirical correction[8-10] to model-based techniques that seek to explicitly account for background optical properties extracted using quantitative diffuse reflectance spectroscopy[11-13].
A common feature of these correction methods is the requirement for diffuse reflectance measurements to be performed at the time of fluorescence measurement. As reflectance data must be gathered, it is reasonable to ask whether these reflectance data are sufficient to extract the fluorophore concentration, without the additional hardware and complexity necessary for fluorescence measurements. Particularly for fluorescent molecules with strong absorption, such as methylene blue (MB), the absorption/excitation spectrum of the molecule may be directly detectable on reflectance. This is the case for our ongoing Phase 1 clinical trial involving MB as a photosensitizer for PDT of deep tissue abscess cavities (ClinicalTrials.gov identifier: NCT02240498). We have designed a reflectance and fluorescence spectroscopy system for determination of patient-specific optical properties and MB uptake, with pre-clinical validation of the reflectance capabilities recently reported[14]. For MB and other highly absorbing fluorophores, fluorescence measurements could potentially be eliminated to reduce experimental complexity, particularly in clinical applications, if they do not significantly improve the accuracy of fluorophore concentration recovery relative to diffuse reflectance.
Therefore, in the present study, we compare the accuracy of methylene blue (MB) concentration recovery using fluorescence and reflectance measurements at short source-detector separations.
Materials and Methods
Fluorescence and reflectance measurements were performed using an optical spectroscopy system and fiber-optic probe that have been described in detail previously[14]. Briefly, this system allows for delivery of broadband white light or 640 nm laser light by a custom optical probe. Diffuse reflectance or emitted fluorescence spectra are then detected sequentially by eight detector fibers embedded in the probe, with source-detector separations ranging from 288 μm to 1.30 mm.
Measurements were performed in phantoms consisting of 1 L water, Intralipid 20% (Fresenius Kabi AG, Bad Homburg, Germany) as the scatterer, and methylene blue (MB, American Regent, Inc., Shirley, NY) as the fluorophore/absorber. Intralipid concentrations of 0.5-3.2% were used to generate scattering coefficients (μs) corresponding to 25-150 cm−1 at 665 nm. MB concentrations of 0.32-6.4 μM were utilized, corresponding to absorption coefficients (μa) of 0.05-1.0 cm−1 at 665 nm. Experiments were performed at 36 combinations of these Intralipid and MB concentrations in order to examine recovery of fluorophore concentration over a range of optical properties. The explored absorption and scattering coefficients are meant to replicate conditions used in our previous diffuse reflectance experiments[14], which are based upon ranges reported for intraperitoneal tissue[15].
For each experiment, the distal face of the optical probe was held in surface contact with the liquid phantom. Reflectance spectra were captured sequentially using the broadband lamp source at all eight source-detector separations, followed by detection of fluorescence spectra excited by the laser source at each fiber. Reflectance and fluorescence spectra were corrected for dark background, integration time, measured optical power, and system throughput. These steps are described in detail elsewhere[14]. In order to remove any effects of day-to-day changes in lamp/laser power, fiber throughput, and/or spectral response of the system, calibration measurements were also performed using an integrating sphere prior to each phantom experiment to ensure accurate data interpretation. To perform these measurements, the optical probe’s distal face was placed at the open port of an integrating sphere, white light or 640 nm laser light was delivered, and spectra collected through either the reflectance or fluorescence channel for all eight detector fibers. Reflectance spectra for each detector fiber were directly divided by the corresponding calibration reflectance spectrum. For fluorescence measurements, the calibration measurement corresponded to the tails of the 640 nm laser spectrum that were transmitted through the long-pass emission filter (LP02-664RU-25, IDEX Health & Science, LLC – Semrock, Rochester, NY). Direct division of the experimental fluorescence spectrum by this calibration spectrum was therefore not appropriate due to the low detected signal at longer wavelengths, as it could artificially introduce noise into the corrected spectrum. Instead, to remove the effects of laser power and fiber throughput from the fluorescence measurements, each laser calibration measurement was smoothed, assuming a Gaussian spectral shape. Measured fluorescence spectra were then divided by the mean value of this smoothed calibration spectrum from 674-678 nm.
Fluorescence spectra were then corrected for the effects of phantom optical properties using the method of Hull et al[8], in order to recover intrinsic fluorescence spectra. This correction is of the form,
| (1) |
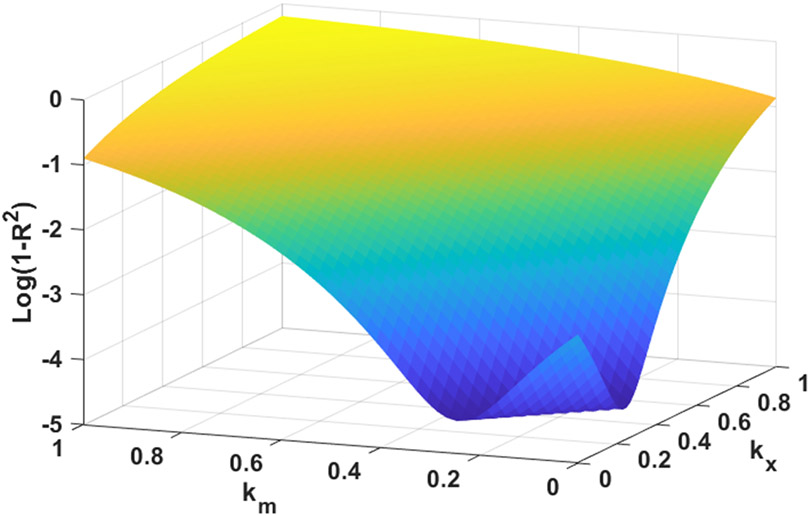
where fintrinsic(λ,d) is the recovered intrinsic fluorescence spectrum over the wavelength range λ at detector fiber d, fmeas,corr(λ,d) is the measured fluorescence spectrum for the same wavelength range and detector after the corrections performed in the previous paragraph, and Rmeas,corr(λ,d) and Rmeas,corr(640 nm,d) correspond to corrected reflectance spectra over the whole wavelength range and at the excitation wavelength of 640 nm, respectively. The exponents kx and km,d correspond to an overall exponent for reflectance at the excitation wavelength and fiber-specific exponents over the entire wavelength range, respectively. In order to determine the values of these exponents, equation (1) was first applied across a range of (kx, km,d) combinations for each detector fiber for all phantom measurements. At each combination, the relationship between known MB combination and the mean value of fintrinsic(λ,d) from 670-700 nm was plotted and fit with a first-order polynomial. The error at each combination was quantified as 1-R2 for the linear fit, resulting in error metrics such as the one shown in Figure 1 for detector fiber 1.
Figure 1.
Error metric used to optimize (kx,km,d) exponents shown in Equation 1. Error is displayed here as the logarithm of (1-R2), where R2 is the goodness of fit metric returned by fitting a first-order polynomial to the relationship between corrected fluorescence and known MB concentration.
As can be seen, there is a family of (kx, km,d) combinations that minimize the error function. We therefore impose the knowledge that the source fiber geometry is identical for all detector fibers. As a result, kx is fixed at a value that lies within the minimum “trough” for each detector fiber, which we found to be 0.2. Individual exponents km,d were then found as the value that minimizes the error metric at kx=0.2, with resultant values shown in Table 1.After applying the exponents defined in Table 1 to Equation 1, a linear calibration curve between fintrinsic(λ,d) and known MB concentration was generated for each fiber. Calibration was performed using two sets of phantoms with MB concentrations ranging from 0-7 μM, and scattering coefficients of 50 and 100 cm−1 at 665 nm. As generation of this curve was performed after the correction described in Equation 1 was applied, the resultant calibration was found to be independent of background scattering coefficient. This calibration curve was then applied to each set of fluorescence data in order to generate a recovered MB concentration for each detector fiber, as well as a mean concentration across all detector fibers.
Table 1.
Reflectance correction exponents for excitation (kx) and emission (km,d) windows for each detector fiber
| Detector Fiber | k x | k m,d |
|---|---|---|
| 1 | 0.2 | 0.04 |
| 2 | 0.65 | |
| 3 | 0.53 | |
| 4 | 0.43 | |
| 5 | 0.61 | |
| 6 | 0.71 | |
| 7 | 0.55 | |
| 8 | 0.96 |
MB concentrations recovered from corrected fluorescence measurements were compared to those recovered purely from diffuse reflectance measurements, as described by Bridger et al[14]. This was done using repeated measures one-way ANOVA across detector fibers, with pairwise comparisons between individual detectors and reflectance performed using the Holm-Sidak multiple comparison test. Mean MB concentration recovered from fluorescence across all fibers was compared to values extracted from reflectance using the Wilcoxon test. The relationship between error in MB recovery and source-detector separation was examined with linear regression. Percent error was calculated by dividing the absolute value of the difference between known and recovered MB concentration by the known MB concentration. All statistical analysis was performed in MATLAB (R2019b, The Mathworks, Inc., Natick, MA) and GraphPad Prism (GraphPad Software, Inc., San Diego, CA).
Results
Representative fluorescence spectra before and after application of the correction in Equation 1 are shown in Figure 2 for a fixed MB concentration of 3.2 μM and varying Intralipid concentrations of 1.1-3.2%. As can be seen, this correction has an impact on both the shape and magnitude of the recovered fluorescence spectra. This correction is crucial, particularly in the presence of changing background scattering. It is apparent that correction of detected fluorescence spectra is vital for accurate recovery of fluorophore concentration, even at short source-detector separations.
Figure 2.
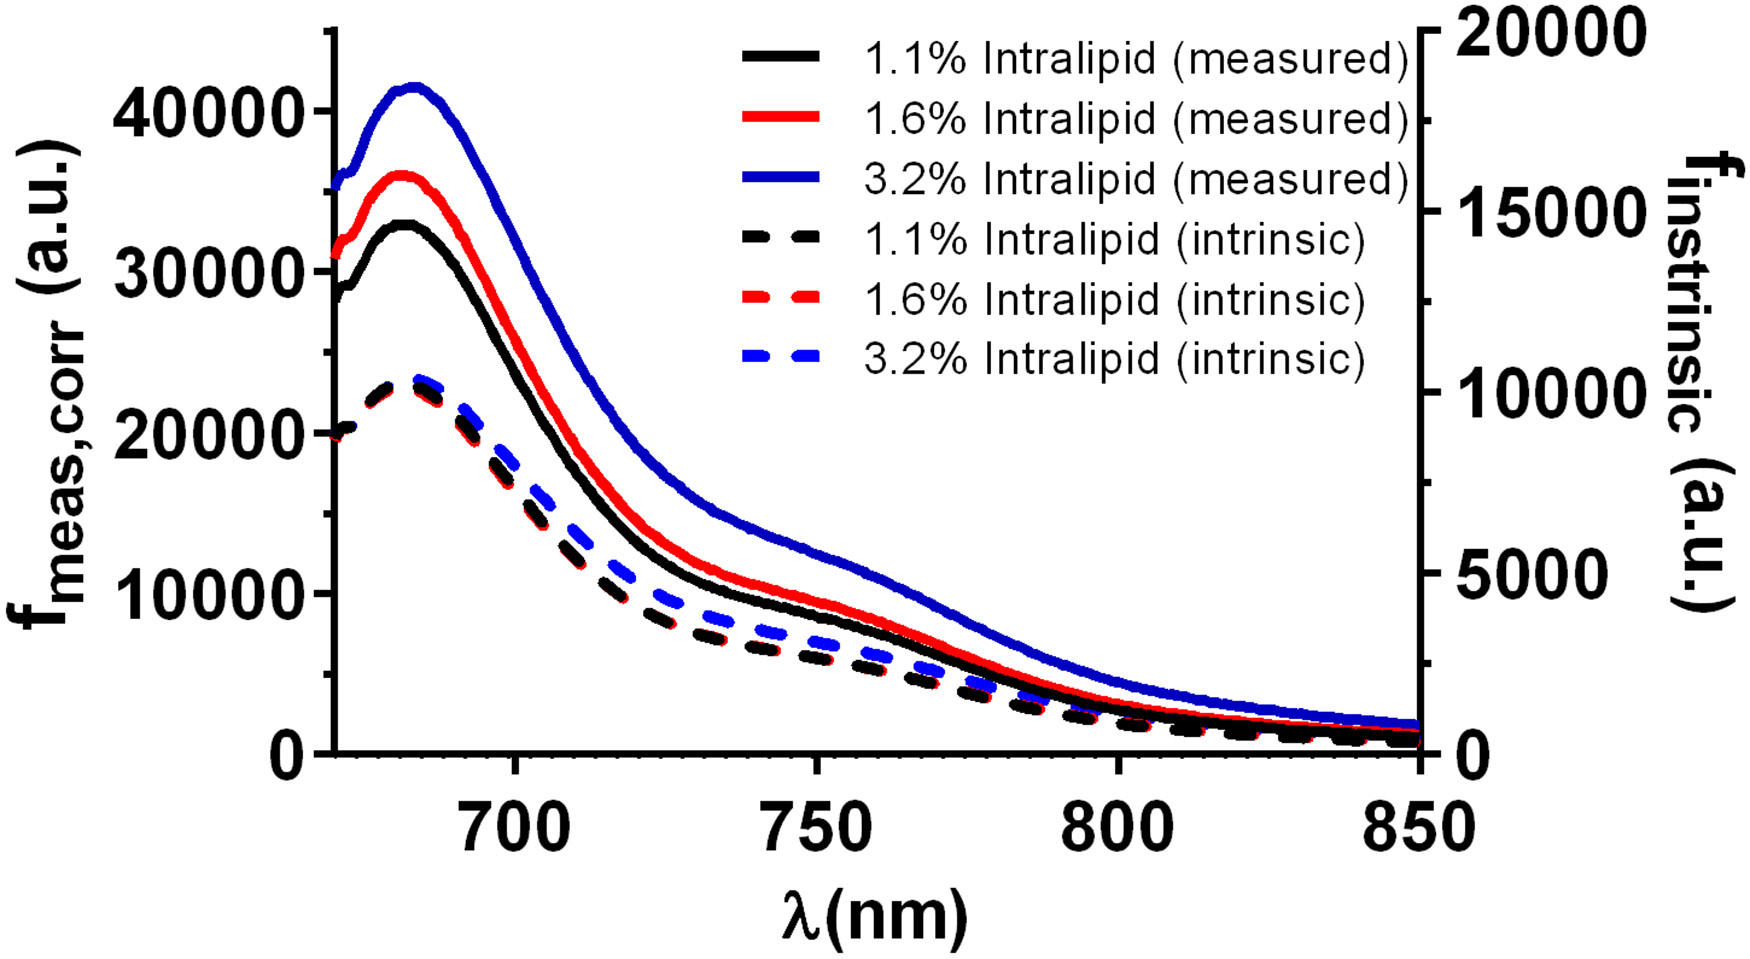
Fluorescence spectra captured at a source-detector separation of 288 μm and [MB] = 3.2 μM, prior to and following the correction shown in Equation 1. Solid lines correspond to measured fluorescence spectra that have been corrected for dark background, integration time, measured optical power, and system throughput. Dashed lines refer to corresponding intrinsic fluorescence spectra that have been corrected using Equation 1. Note that measured fluorescence magnitude is shown on the left y-axis, while recovered intrinsic fluorescence is on the right y-axis.
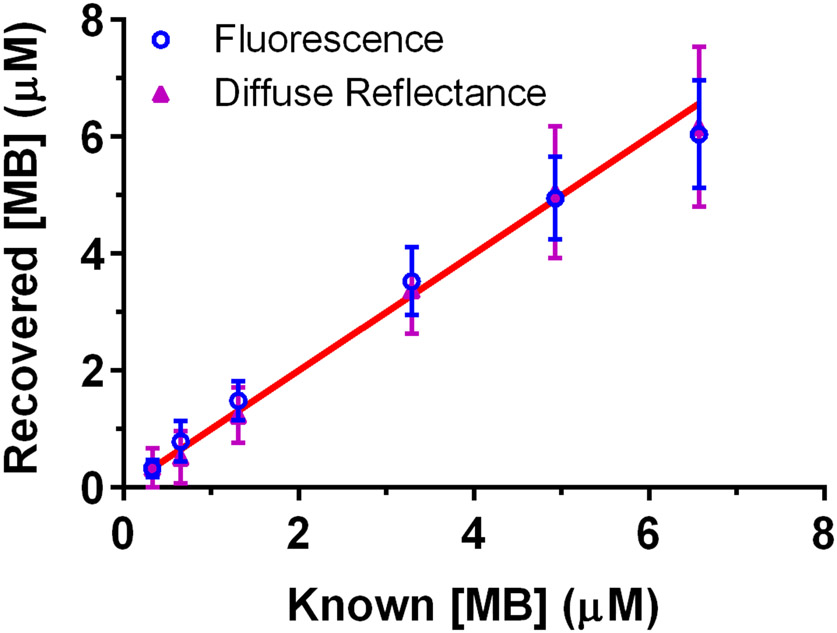
MB concentration recovery was compared between diffuse reflectance results and the mean concentration recovered from fluorescence across all detector fibers. These results are shown in Figure 3, with data points representing means across all phantom measurements made at a particular MB concentration and error bars corresponding to standard deviation. For fluorescence, the average error in MB concentration recovery was 20.4%, compared to 15.0% for diffuse reflectance. However, values recovered via fluorescence were not significantly different from those obtained via diffuse reflectance (p=0.77). When compared to known MB concentration, fluorescence extraction of concentration was similar to known values (p=0.93). This was also true of reflectance recovery of concentration (p=0.79). These results indicate that recovery of MB concentration is substantially equivalent between fluorescence and reflectance when fluorescence results are averaged across source-detector separations.
Figure 3.
Recovery of MB concentration by averaging across fluorescence results at all eight detector fibers, compared to diffuse reflectance. Data points represent means across all phantom measurements made at a given MB concentration, with μs at 665 nm ranging from 25-150 cm−1. The red line corresponds to perfect agreement between known and recovered MB concentration.
We then examined MB recovery at individual detector fibers using fluorescence, with the average error compared to known values for each shown in Figure 4. As can be seen, error is generally lower at smaller source-detector separations, with linear regression showing a significant positive relationship between average error and source-detector separation (slope = 0.015 % error/μm (0.008-0.023 %/μm 95% confidence interval), p=0.003). However, absolute recovered MB concentrations from fluorescence were not significantly different for any pairwise comparisons between detector fibers (p>0.99 in all cases). Additionally, MB concentration extracted from fluorescence was not significantly different between any detector fiber and the value obtained via reflectance (p>0.98 in all cases).
Figure 4.
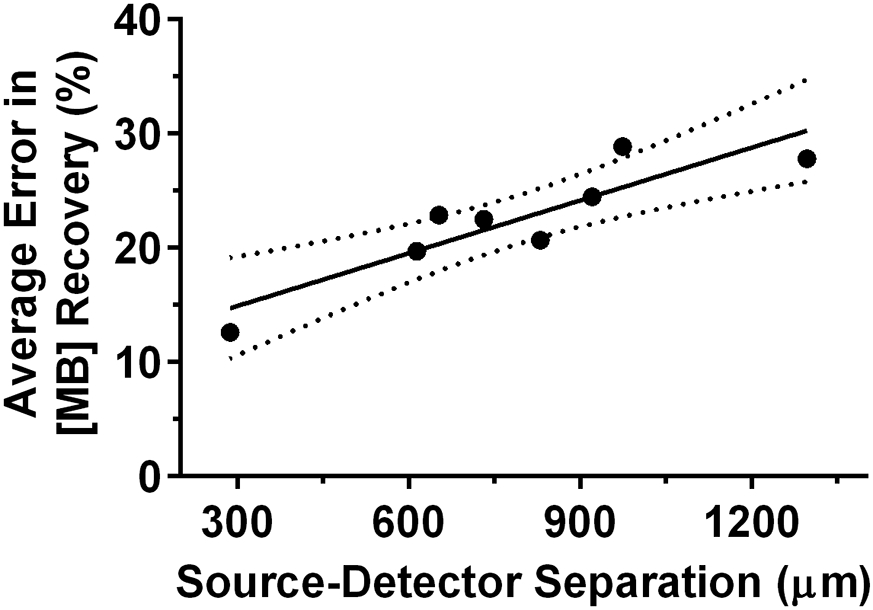
Relationship between average error in recovery of methylene blue concentration using a single detector fiber and the source-detector separation for that fiber. The solid line represents a linear regression fit, with dotted lines corresponding to the 95% confidence interval.
Finally, we looked at whether sub-sets of detector fibers resulted in improved performance. In order to do this, we calculated the mean recovered MB concentration for all combinations of a particular number of detector fibers. For example, for 2 detector fibers, the mean was calculated across all combinations of (di,dj), where i and j range from one to eight. Error was then summarized as mean and standard deviation across detector combinations, as shown in Figure 5. There was a slight decrease in average error as more detector fibers were incorporated into the determination of MB concentration, although this difference was not significant (p=0.20). Large standard deviations at smaller sub-sets of detector fibers were likely a result of greater weight being given to detector fibers that were less accurate (see Figure 4).
Figure 5.
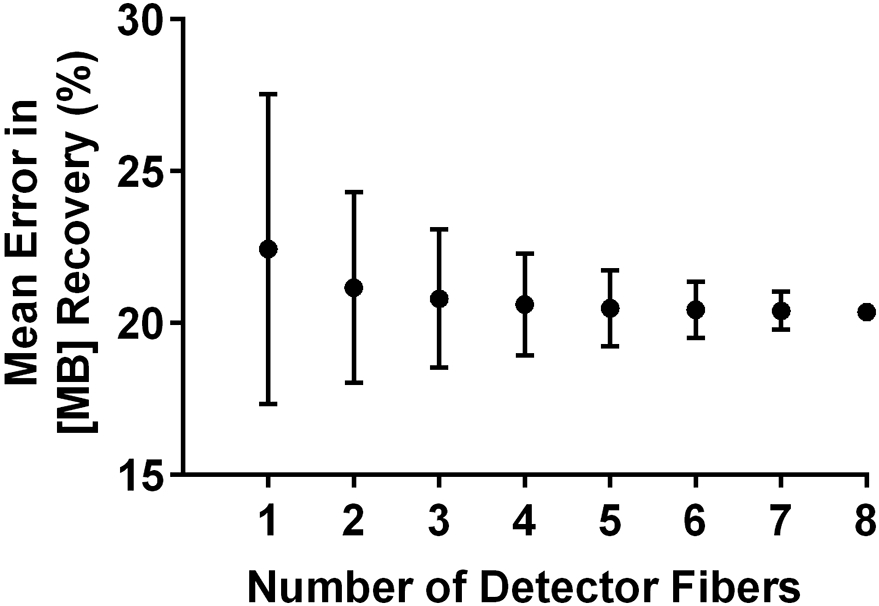
Mean percent error in recovery of MB concentration using a given number of detector fibers. Data points are averages across all possible combinations of a particular number of detector fibers, with error bars representing standard deviation.
Discussion
We have demonstrated that recovery of fluorophore concentration using fluorescence measurements is similar in accuracy to extraction using diffuse reflectance measurements at source-detector separations ranging from 288 μm to 1.30 mm. There was a slight reduction in error for fluorescence at shorter source-detector separations, but this difference was not statistically significant. Error was also slightly reduced by inclusion of data from multiple source-detector separations. Accurate recovery of fluorophore concentration using fluorescence requires careful correction to remove the effects of background optical properties. As diffuse reflectance measurements are necessary for this correction to be performed, elimination of fluorescence measurements in favor of a reflectance-only approach could decrease instrumental complexity without a loss of accuracy.
Fluorescence and diffuse reflectance both offer advantages and disadvantages for determination of the concentration of fluorescent compounds. Fluorescence measurements have a more identifiable “fingerprint,” as the shape of the fluorescence emission spectrum is known a priori. In fact, this knowledge of spectral shape has been exploited to recover fluorophore concentration without corresponding reflectance measurements[16,17], although applicability is limited to specific geometries and background optical properties. This can result in fluorescence measurements being more accurate at low concentrations, though we did not observe this at the concentrations examined in the present study. Further, diffuse reflectance requires measurable attenuation of the illumination source by fluorophore absorption in order to recover fluorophore concentration. Here, we have used MB as the fluorophore, as this is the photosensitizer we employ in our ongoing Phase 1 clinical trial of PDT for deep tissue abscesses. MB has a relatively high extinction coefficient of approximately 74,021 cm−1/M[18]. On the other hand, native fluorophores such as collagen have lower extinction coefficients and are generally excited at UV wavelengths[19,20]. Fluorescence may therefore be better suited for recovery of the concentration of these lower-extinction fluorophores, as well as for low fluorophore concentrations. Diffuse reflectance spectroscopy can utilize a significantly simpler optical design, as laser excitation and emission filtering are not required. Many fluorescence systems also require additional switching optics to accommodate excitation sources and filters[21-23], which increases cost and complexity. The decision of whether to add fluorescence measurements to a diffuse reflectance spectroscopy system should therefore be guided by the fluorophores of interest, and investigators should consider whether these fluorescence measurements are necessary for the desired application.
As shown in Figure 5, there was a decrease in error in the determination of MB concentration by fluorescence when including more detector fibers in the recovery, although this decrease was not statistically significant. However, previous reports have demonstrated that varying the source-detector separation changes the depth from which fluorescence is detected[24], meaning that different source-detector separations sample different regions of the tissue. Here we have investigated homogeneous liquid phantoms, so the detectors all sample an identical fluorophore concentration. In future clinical application, this assumption of homogeneity may not hold. Based on the modest improvement in accuracy afforded by averaging of data from multiple source-detector separations, these additional detector fibers may therefore be better employed for coarse depth resolution of fluorophore concentration. This has been demonstrated by multiple investigators[25,26], with longer source-detector separations generally probing deeper into the tissue. Investigation of this is ongoing for the present system.
We acknowledge a number of limitations in the current study. First, only a limited range of fluorophore concentrations were examined, corresponding to μa=0.05-1.0 cm−1 at 665 nm. It is possible that the results presented here may not hold at methylene blue concentrations outside of this range. Further, methylene blue is a fluorophore with a relatively high extinction coefficient. As discussed above, the ability to recover fluorophore concentration using diffuse reflectance data may be reduced for fluorophores with lower extinction coefficients. Finally, an empirical correction was employed for recovery of intrinsic fluorescence. Others have shown that model-based fluorescence correction techniques that incorporate absolute measurements of background absorption and scattering coefficients may result in greater accuracy[11]. However, these methods require explicit recovery of optical properties from diffuse reflectance using appropriate modelling and instrumentation, rather than a simple measure of reflectance in the same geometry as the fluorescence measurement.
Acknowledgements
This work was supported by the National Institute of Biomedical Imaging and Bioengineering (NIBIB) under NIH grant EB029921.
Footnotes
Disclosures
The authors declare no conflicts of interest.
Code, Data, and Materials Availability
The data and code underlying the results outlined here are not currently publicly available, but may be obtained from the authors upon reasonable request.
References
- [1].Wehry EL. Modern Fluorescence Spectroscopy. Boston, MA: Springer; 1981. (Modern Analytical Chemistry). [Google Scholar]
- [2].Suresh A, Riccardo C, Alfonso C, et al. Fluorescence spectroscopy incorporating a ratiometric approach for the diagnosis and classification of urothelial carcinoma. Proc.SPIE 9689, 2016 [Google Scholar]
- [3].Yang F, Lin D, Pan L, et al. Portable Smartphone Platform Based on a Single Dual-Emissive Ratiometric Fluorescent Probe for Visual Detection of Isopropanol in Exhaled Breath. Analytical Chemistry. 2021;93(43):14506–14513. [DOI] [PubMed] [Google Scholar]
- [4].Wang KK-H, Finlay JC, Busch TM, et al. Explicit dosimetry for photodynamic therapy: macroscopic singlet oxygen modeling [ 10.1002/jbio.200900101]. Journal of Biophotonics. 2010;3(5-6):304–318. [DOI] [PMC free article] [PubMed] [Google Scholar]
- [5].Ong YH, Kim MM, Finlay JC, et al. PDT dose dosimetry for Photofrin-mediated pleural photodynamic therapy (pPDT). Physics in Medicine & Biology. 2017;63(1):015031. [DOI] [PMC free article] [PubMed] [Google Scholar]
- [6].Bradley RS, Thorniley MS. A review of attenuation correction techniques for tissue fluorescence. Journal of The Royal Society Interface. 2006;3(6):1–13. [DOI] [PMC free article] [PubMed] [Google Scholar]
- [7].Wu J, Feld MS, Rava RP. Analytical model for extracting intrinsic fluorescence in turbid media. Applied Optics. 1993;32(19):3585–3595. [DOI] [PubMed] [Google Scholar]
- [8].Hull EL, Ediger MN, Unione AHT, et al. Noninvasive, optical detection of diabetes: model studies with porcine skin. Opt Express. 2004;12(19):4496–4510. [DOI] [PubMed] [Google Scholar]
- [9].Tengfei S, Caigang Z. Empirical method for rapid quantification of intrinsic fluorescence signals of key metabolic probes from optical spectra measured on tissue-mimicking turbid medium. Journal of Biomedical Optics. 2021;26(4):1–12. [DOI] [PMC free article] [PubMed] [Google Scholar]
- [10].Gnanatheepam E, Kanniyappan U, Prakasarao A, et al. Intrinsic fluorescence of protein in turbid media using empirical relation based on Monte Carlo lookup table. Proc.SPIE 10063, 2017 [Google Scholar]
- [11].Palmer GM, Ramanujam N. Monte-Carlo-based model for the extraction of intrinsic fluorescence from turbid media. Journal of Biomedical Optics. 2008;13(2):1–9. [DOI] [PMC free article] [PubMed] [Google Scholar]
- [12].Zhu C, Palmer GM, Breslin TM, et al. Diagnosis of breast cancer using fluorescence and diffuse reflectance spectroscopy: a Monte-Carlo-model-based approach. Journal of Biomedical Optics. 2008;13(3):1–15. [DOI] [PMC free article] [PubMed] [Google Scholar]
- [13].Muller M, Hendriks BHW. Recovering intrinsic fluorescence by Monte Carlo modeling. Journal of Biomedical Optics. 2013;18(2):1–14. [DOI] [PubMed] [Google Scholar]
- [14].Bridger KG, Roccabruna JR, Baran TM. Optical property recovery with spatially-resolved diffuse reflectance at short source-detector separations using a compact fiber-optic probe. Biomed Opt Express. 2021;12(12):7388–7404. [DOI] [PMC free article] [PubMed] [Google Scholar]
- [15].Hsing-Wen W, Timothy CZ, Mary PP, et al. Broadband reflectance measurements of light penetration, blood oxygenation, hemoglobin concentration, and drug concentration in human intraperitoneal tissues before and after photodynamic therapy. Journal of Biomedical Optics. 2005;10(1):1–13. [DOI] [PubMed] [Google Scholar]
- [16].Baran TM, Foster TH. Recovery of intrinsic fluorescence from single-point interstitial measurements for quantification of doxorubicin concentration. Lasers Surg Med. 2013;45:542–550. [DOI] [PMC free article] [PubMed] [Google Scholar]
- [17].Finlay JC, Foster TH. Recovery of hemoglobin oxygen saturation and intrinsic fluorescence with a forward-adjoint model. Appl Opt. 2005;44(10):1917–1933. [DOI] [PubMed] [Google Scholar]
- [18].Prahl S. Methylene Blue Spectra 2017. [cited 2021 November 24, 2021]. Available from: omlc.org/spectra/mb/ [Google Scholar]
- [19].Finch AJ, Benson JM, Donnelly PE, et al. Light Absorptive Properties of Articular Cartilage, ECM Molecules, Synovial Fluid, and Photoinitiators as Potential Barriers to Light-Initiated Polymer Scaffolding Procedures. CARTILAGE. 2017;10(1):82–93. [DOI] [PMC free article] [PubMed] [Google Scholar]
- [20].Sanathana Konugolu Venkata S, Ilaria B, Alberto Dalla M, et al. Diffuse optical characterization of collagen absorption from 500 to 1700 nm. Journal of Biomedical Optics. 2017;22(1):1–6. [DOI] [PubMed] [Google Scholar]
- [21].Cottrell WJ, Oseroff AR, Foster TH. A portable instrument that integrates irradiation with fluorescence and reflectance spectroscopies during clinical photodynamic therapy of cutaneous disease. Rev Sci Instrum. 2006;77:064302. [Google Scholar]
- [22].Hu N, Antoury L, Baran TM, et al. Non-invasive monitoring of alternative splicing outcomes to identify candidate therapies for myotonic dystrophy type 1. Nat Commun. 2018;9:5227. [DOI] [PMC free article] [PubMed] [Google Scholar]
- [23].Kanick SC, Davis SC, Zhao Y, et al. Dual-channel red/blue fluorescence dosimetry with broadband reflectance spectroscopic correction measures protoporphyrin IX production during photodynamic therapy of actinic keratosis. Journal of Biomedical Optics. 2014;19(7):1–15. [DOI] [PMC free article] [PubMed] [Google Scholar]
- [24].Pfefer TJ, Schomacker KT, Ediger MN, et al. Multiple-fiber probe design for fluorescence spectroscopy in tissue. Appl Opt. 2002;41(22):4712–4721. [DOI] [PubMed] [Google Scholar]
- [25].Zhu C, Liu Q, Ramanujam N. Effect of fiber optic probe geometry on depth-resolved fluorescence measurements from epithelial tissues: a Monte Carlo simulation. Journal of Biomedical Optics. 2003;8(2):237–247. [DOI] [PubMed] [Google Scholar]
- [26].Ong YH, Zhu TC. Estimation of fluorescence probing depth dependence on the distance between source and detector using Monte Carlo modeling. Proc.SPIE 11628, Mechanisms and Techniques in Photodynamic Therapy and Photobiomodulation. 2021:116280X. [DOI] [PMC free article] [PubMed] [Google Scholar]


