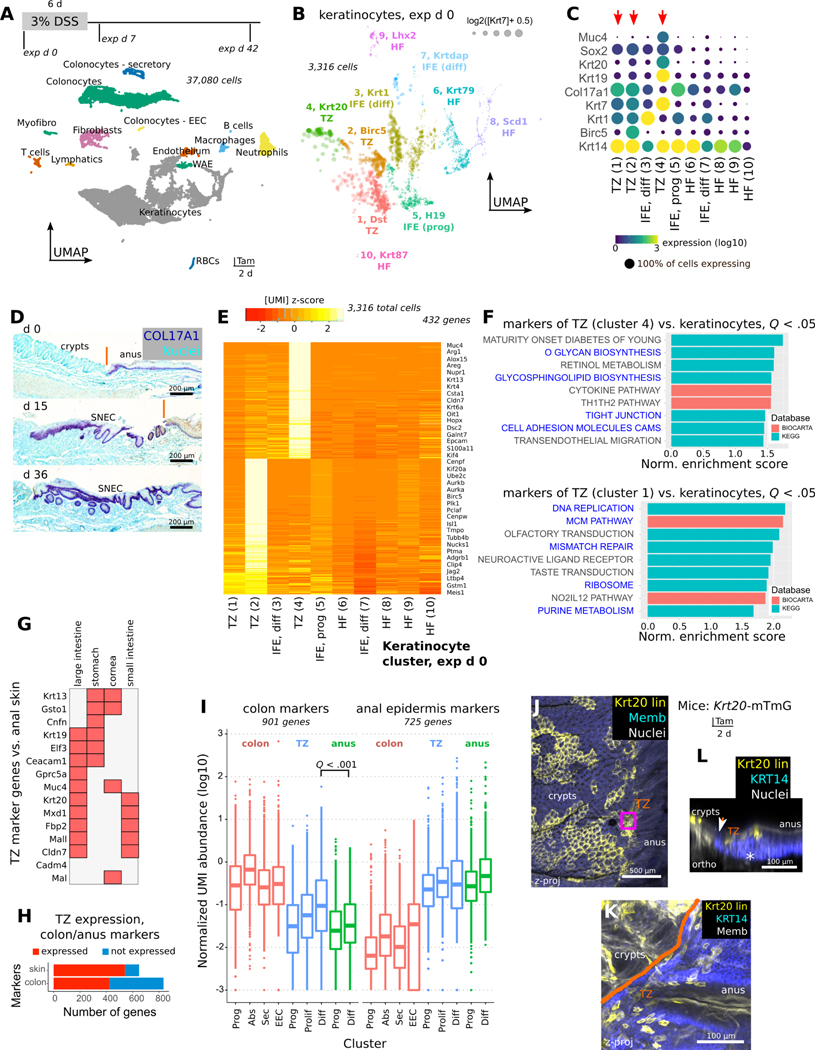
Figure 3: Anal TZ is a molecularly distinct squamous tissue with colonic expression.
A) Single-cell RNA sequencing (scRNA-Seq) of >35,000 cells from 3 different timepoints (n=5 pooled mice/timepoint) during DSS-induced injury and repair. Discrete clusters of epithelial and stromal cells from the anorectal junction can be identified in the UMAP visualization. B-C) Louvain subclustering (B) of uninjured (exp d 0) keratinocytes reveals putative TZ (Krt7hi) cell clusters (#1, #2, #4) (C). HF = hair follicle, IFE = interfollicular epithelium. D) COL17A1 staining shows that TZ, anal epidermis, and SNEC have a basal layer that is marked by expression of this collagen isoform. E) Heatmap of aggregated gene expression compared between clusters shows specific genes to clusters #1, #2, and #4 representing unique TZ-related transcripts. F) GSEA of markers of cluster #4 (differentiated TZ) and #1 (basal TZ) identifies junctional and mucus-producing pathways (#4) and mitotic pathways (#1) (blue text) enriched in the TZ. Normalized enrichment score and adjusted p values (q values) were obtained from GSEA software. G) Specific markers of the TZ cross-compared to other tissues using BioGPS. H,I) Summary (H) of colonic or anal epidermal (skin) marker expression in the TZ. By definition, skin and colonic markers were mutually exclusive. The boxplot (I) shows the distribution of expression of colonic or anal epithelial markers in different colonic or anal epithelial cell types. Each dot represents a gene. Expression is quantified as the mean UMI abundance (including the 0-count cells) among the cells within a cluster. Colon and anus markers were defined by identifying genes that had >4-fold expression difference between colonic and anal epithelium (the TZ was excluded for gene identification). The “differentiated” TZ cells exhibit significantly enriched overall expression of colonic epithelial markers compared to differentiated cells of the anal IFE (paired t-test, Holm-Bonferroni correction). In H, a marker was deemed expressed in the TZ if its mean log TZ abundance was >50% of the abundance in the reference anal or colonic tissue. Abbreviations: Prog = progenitors, Abs = absorptive cells, Sec = secretory cells, EEC = enteroendocrine cells, Diff = differentiated cells. Box plot: center line, median; hinges, 25–75th percentiles; whiskers, 1.5x interquartile range; points, outliers. J-L) Krt20 expression in the uninjured anal TZ was confirmed using Krt20-mTmG mice (n=3 mice). Tamoxifen administration induces lineage labeling of Krt20+ cells in colon and in the TZ (J). TZ-labeled cells distal to the dentate line (orange) are KRT14+ in the zoomed image (K) and are found only in the suprabasal layer of cells (L). See also Figures S6, S7.

