

Abstract
High-flow oxygen therapy using a tracheostomy tube is a promising clinical approach to reduce the work of breathing in tracheostomized patients. Positive end-expiratory pressure (PEEP) is usually applied during oxygen inflow to improve oxygenation by preventing end-expiratory lung collapse. However, much is still unknown about the geometrical effects of PEEP, especially regarding tracheostomy tube connectors (or adapters). Quantifying the degree of end-expiratory pressure (EEP) that takes patient-specific spirometry into account would be useful in this regard, but no such framework has been established yet. Thus, a platform to assess PEEP under respiration was developed, wherein three-dimensional simulation of airflow in a tracheostomy tube connector is coupled with a lumped lung model. The numerical model successfully reflected the magnitude of EEP measured experimentally using a lung phantom. Numerical simulations were further performed to quantify the effects of geometrical parameters on PEEP, such as inlet angles and rate of stenosis in the connector. Although sharp inlet angles increased the magnitude of EEP, they cannot be expected to achieve clinically reasonable PEEP. On the other hand, geometrical constriction in the connector can potentially result in PEEP as obtained with conventional nasal cannulae.
Graphical abstract
Keywords: Tracheostomy tube connector, Positive end-expiratory pressure (PEEP), Lumped lung model, Computational fluid dynamics, Computational biomechanics
Introduction
High-flow oxygen therapy, including that administered via high-flow nasal cannula therapy (HFNC), has been applied as a promising treatment for patients with lung injury [8]. One approach to this therapy is to perform tracheostomy by surgically creating an opening through the neck into the trachea to allow direct access to a tracheostomy tube and a connector attached to the tube [10]. The tracheostomized patients can then breathe through the tube rather than through the nose and mouth. Administration of an air-oxygen mixture is required to achieve positive end-expiratory pressure (PEEP) to assist in breathing and avoid pulmonary collapse [21]. HFNC has conventionally been used with an inflow rate between 20–60 L/min [25, 35], because it produces PEEP in the range of 2–8 cmH2O [6, 26], and can also wash out CO2 from the upper airways [22, 23]. Furthermore, HFNC can decrease the work of breathing and also enhance neuroventilatory drive [35]. More recently, benchtop experiments were performed with a high-flow tracheostomy circuit, and the so-called potential PEEP, defined as the blow-off pressure of the open gas delivery system, was approximately 0.3–0.9 cmH2O (≈ 29.4–88.3 Pa) for an inflow rate of 40–60 L/min [38].
The ability to successfully achieve PEEP by tracheostomy cannulae is especially important in ill patients who need long-term (2–3 weeks) ventilation, because such cannulae are used for almost 90% of these patients and also because there is a correlation between high survival rates and short ventilation duration [7]. Hence, providing adequate gas exchange is necessary for early ventilator removal in tracheostomized patients. Considering fast-increasing worldwide incidence of COVID-19, it is currently of paramount importance to identify the mechanical conditions required for PEEP generation in lung therapy. The mechanical conditions necessary to produce PEEP are therefore fundamentally important not only for tracheostomized patients but also for individuals with acute lung injury or acute respiratory distress syndrome (ARDS, the most severe form of acute lung injury) [20] and for patients assisted by extracorporeal membrane oxygenation (ECMO) [28]. Since it is expected that PEEP generation results from the hydrodynamical interplay between pulmonary dynamics (e.g., stress and deformation) and the geometrical characteristics of the tracheostomy tube connector, which can be characterized as a bifurcated tube, understanding the outlet pressure of the connector during respiration is of fundamental importance in high-flow oxygen therapy. However, much is still unknown about the geometrical effects of tracheostomy tube connectors (or adapters) on PEEP.
Along with the aforementioned clinical studies, recent theoretical and computational approaches have successfully been used to investigate aspects of pulmonary dynamics such as stresses and deformation [29, 31], as well as the fully turbulent nature of tracheal flow during inhalation [5, 13, 14, 30, 37, 42]. For instance, Brouns et al. (2007) systematically investigated how pressure drop affected tracheal stenosis in the range between 50 and 90% and showed that the pressure drop over the normal glottis (~ 40% constriction) was negligible with respect to that induced by constrictions greater than 70%, which impaired breathing [5]. Their numerical results suggest that PEEP can be caused by luminal stenosis in the connector. In other numerical studies using a reduced-dimensional (or lumped) model of pulmonary networks that included alveoli, the mechanical effects of downstream regions on airflow in upstream regions were quantified [12, 15, 17]. Such coupled analysis of three-dimensional (3D) fluid flow and reduced-dimensional models of the mechanical pulmonary response will be useful to understand the mechanical conditions of PEEP while considering both airflow in the connector and patient-specific spirometry. However, no such framework has been established yet.
Therefore, the first objective of this study was to develop a computational platform to evaluate PEEP, taking into consideration the 3D nature of the airflow in the tracheostomy tube connector. The second objective was to quantify how luminal stenosis in the connector affected the magnitude of end-expiratory pressure (EEP).
Methods
EEP was calculated as the area-averaged tracheal pressure, which corresponded to the outlet pressure in the connector (Ptr or Pout3) as described below. Calculated EEPs for different inflow rates Qin were compared with those obtained experimentally. The effects of connector inlet angles θ and luminal stenosis on EEP were further investigated using a newly developed model.
Lumped lung model
In the lumped lung model, the lung tissue is modeled as an isotropic material, and only diagonal components of elastic stress Pe are considered to effectively achieve lung volume change. Alveolar pressure Pal is balanced with pleural pressure Ppl, the latter of which is driven by respiratory muscle contraction as well as pressure (or isotropic elastic stress) Pe due to lung elasticity acting on the lung tissue, i.e.,
| 1 |
Ppl is given as the sinusoidal function
| 2 |
where T is the respiratory period (5 s), is the amplitude of pleural pressure (250 Pa [40]), and is the baseline pleural pressure (750 Pa [40]). Both the inspiration and expiration phases last for T/2 (2.5 s). The isotropic elastic stress Pe can be given as [9]:
| 3 |
where k is the coefficient of lung elastic stress (10.1 Pa), a is a model coefficient (3.0), and E (= (λ2—1)/2) is Green’s strain defined by the stretch ratio λ (= (V (t)/V0)1/3) between the lung volume V(t) at time t and the reference lung volume V0. The total gas volume in the lung is about 3 × 10⁻³ m3, and the volume inspired per breath during quiet breathing is about 0.45 × 10⁻³ m3 in a typical man about 40 years old and about 1.7 m tall [27]. Thus, in this study the reference lung volume was defined as V0 = 1.5 × 10⁻³ m3.
Flow model and geometry of tracheostomy tube connectors
Flow was assumed as incompressible, Newtonian viscous fluid flow, and hence, the governing equation of the airflow velocity v in the connector is expressed as
| 4 |
| 5 |
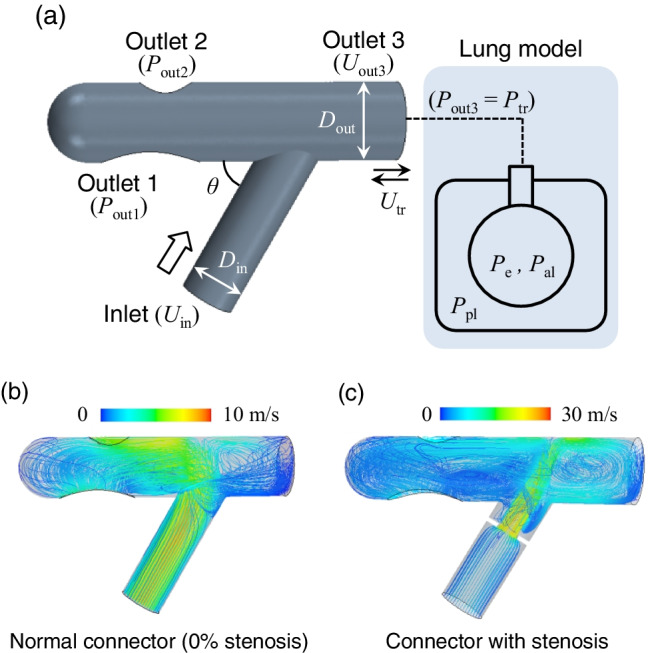
where ρ is the air density (1.18 kg/m3), μ is the viscosity (1.86 × 10⁻⁵ Pa·s), and p is the pressure. The computational domain for 3D computational fluid dynamics (CFD) is shown in Fig. 1a, where the lumped lung model is attached to outlet 3, assuming an open area in the trachea. There are two other outlets (outlet 1 and outlet 2) in the connector, both of which are exposed to the open air (Fig. 1a). The geometry of a connector with 50% stenosis and its internal meshing are also shown in Fig. 1b and 1c. Here, the rate of stenosis was defined as (1—Dmin/Din), where Din is the inlet diameter (11 mm) and Dmin is the minimum connector diameter. The length of the constricted portion of the connectors was set at 1 mm (Fig. 1b and 1c. Unless otherwise specified, we show the results obtained with an inlet angle of θ = 60°.
Fig. 1.

a Computational domain for 3D CFD involving a modeled connector and schematics of a lumped lung model. b 3D CFD computational model with 50% stenosis, and c generated meshes where adaptive mesh refinement and prismatic layers lining the walls are considered in addition to a polyhedral mesh. The boundary conditions of the lumped lung model were set as inlet velocity Uin, outlet pressures Pout1 and Pout2, and outlet velocity Uout3 (= Utr (t, Pe, Pal, Ppl)). The standard inlet angle was set as θ = 60°. The inlet and outlet diameters in connectors were commonly set as Din = 11 mm and Dout = 15.4 mm. The rate of stenosis was defined using the minimum connector diameter Dmin as (1—Dmin/Din). The length of the constricted portion of each connector was set as 1 mm
Numerical simulation
The clinically relevant range of inlet velocity Uin in the connector could be determined by inlet flow rates Qin (= Uinπ /4) = 10, 30, and 50 L/min [24]. Hence, the inflow was characterized by Reynolds number (Re) from 1.2 × 10³ to 6.1 × 10³; Re was defined as ρDinUin/μ. Taking into account the connector stenosis and bifurcation, the local Re in the stenotic region was over 104, and it was also expected that laminar, transitional, and turbulent flows would coexist in the flow field. In this study, a realizable k-ε turbulence model [32] was implemented to simulate the turbulence mean flow field. This model was successfully applied to steady inhalation in a simulation of tracheal flow in a human airway [13, 16, 37]. The CFD software Simcenter STAR-CCM + 2020.2 (Siemens Digital Industries Software Inc., Plano, TX) was used for mesh generation and to solve the Navier–Stokes equations. The flow was driven by Dirichlet boundary conditions, where the air velocity in the inlet (Uin), that in the outlet connected to the trachea (Uout3 = Utr(t, Pe, Pal, Ppl)), and the constant pressure in the outlet (Pout1 = Pout2 = 0 Pa) were defined. A polyhedral mesh was considered for the fluid mesh, and adaptive meshing, including prismatic layers, was also considered in the stenotic region and to line the walls; in total, approximately 40,000 meshes were considered in each airway model. The dependence of the meshes on EEP was also confirmed with double resolution (approximately 80,000 meshes in total) (see result in Sect. 3.1).
Although several lumped models of airways consisting of different types of electrical components (lumped parameters) have been proposed [3, 12], taking into account the structural hierarchy in the human trachea [39, 41], the tracheal velocity Utr was simply defined as the Dirichlet boundary condition in the 3D CFD model, using the following linear equation:
| 6 |
| 7 |
where Ptr is the tracheal pressure, Γ is the airway resistance (200 kPa/m3), and Atr (= π /4) is the opening area in the trachea (or tracheostomy tube) that is given as the outlet diameter of the connector Dout (15.4 mm). In general, the end-expiratory phase was defined as the expiratory flow rate (≥ 0 L/min) reaching zero, as shown in expiratory and inspiratory flow-volume curves [40]. Therefore, in this study, the end of expiration was defined by Utr = 0. The present lung volume V(t) could be calculated as:
| 8 |
where Δt is set as 0.05 s. 3D CFD was started from temporal tracheal velocity Utr = 0, and continued while updating Utr until the tracheal pressure Ptr became almost constant such that |/—1|≤ ε = 0.01, where the superscript n (or n + 1) is the number of trials at time t. The simulation was started with = . The boundary velocity Uout3, which changed over time, was determined using a coefficient α (0 ≤ α ≤ 1); Uout3 = α + (1—α). In this study, to achieve numerical stability, α was set as 0.3 in a normal connector and 0.8 in a constricted connector. This computational algorithm is summarized in Fig. 2. Simulations lasted for three periods (3 T), during which the calculated variables reached a stable periodicity. As described below, the time history of Ptr was preliminarily checked by experimental measurements as shown in Fig. 3c and found that the time history did not affect the EEP; i.e., the effect of airflow dynamics on EEP was negligible, at least for a physiologically relevant respiratory rate (0.2 Hz). Hence, in the model algorithm to update the flow fields, the steady state under the calculated Utr in the lumped lung model was considered at each time step.
Fig. 2.

Flow chart for updating the Dirichlet boundary condition Uout3 in 3D CFD, where α is the coefficient for the temporal updating of Uout3 (0 ≤ α ≤ 1), ε and t∞ are set as ε = 0.01 and t∞ = 3 T, respectively. The simulation ends at t = t∞ = 3 T
Fig. 3.

a Snapshot of entire experimental setup and b schematic of experiment. c Time history of tracheal pressure Ptr in a normal connector (i.e., inlet angle θ = 60° without stenosis) at Qin = 30 L/min. d A comparison of EEP obtained with experimental measurements (blank triangles) versus numerical simulations (solid triangles) as a function of inlet flow rate Qin in a normal connector, where the errors in experimental data represent temporal fluctuations during the end-expiratory phase
Experimental setup
To simulate spontaneous breathing, a double-chamber Training and Test Lung model (TTL) (Michigan Instruments, Grand Rapids, MI) was used, following a previous study [43]. A Puritan- Bennett 840 ventilator (Nellcor Puritan Bennett, Carlsbad, CA) was used as the driving chamber in the TTL model. An Optiflow Plus Tracheostomy Interface Direct Connector (Fisher & Paykel Healthcare, Auckland, New Zealand) was connected to the chamber via an endotracheal tube with an 8-mm internal diameter. Different inflow rates were generated by the Optiflow attached to the connector inlet. The two chambers were connected to each other to stimulate spontaneous breathing during the experiment. The tracheal pressure (Ptr) was measured at the proximal end of the tracheal tube using a pressure transducer (True Wave, Edwards, Irvine, CA). Pressure signals were sampled at a rate of 250 Hz. A surgical support and intensive care management system (Nihon Kohden, Tokyo, Japan) were used to compute Ptr. Considering that patients who require tracheostomy tube connectors are in recovery (i.e., candidates for ventilator withdrawal) but are not fully healed, the compliance of the model lung was set as 0.08 L/cmH2O, which is slightly smaller than that in healthy subjects (0.094–0.136 L/cmH2O [18]). The resistance of the model lung was imposed with a parabolic airway resistor (5 cmH2O/L/s, Pneuflo resistor Rp5, Michigan Instruments). The PB840 ventilator parameters were set as follows: volume control mode, 500 ml of tidal volume; respiratory rate, 15 breaths/min (0.25 Hz); PEEP, 0 cmH2O; and inspiratory time, 0.7 s. To easily detect EEP from periodic tracheal pressure profiles, the expiratory time was set to be relatively longer (3.3 s) than the inspiratory time (0.7 s). Figure 3a shows the experimental setup. A piezometer was attached to the connector to measure the pressure at the chamber inlet. Figure 3b shows a schematic of the experimental setup. The time history of tracheal pressure Ptr in a normal connector at Qin = 30 L/min is shown in Fig. 3c, where the moving-average was obtained for the data of Ptr with a window size of 76 ms.
The parameters for the lumped lung model (a, k, Γ, and α) were determined so that the order of magnitude of the calculated EEP was the same as that obtained with experimental measurements (see Fig. 3d), while preserving the physiologically relevant lung deformation ΔV = 500 cm3 [27, 40] and pleural pressure difference ΔPpl = 500 Pa [19] during respiration under a baseline pleural pressure of 750 Pa [40] with an amplitude of 250 Pa [40]. The model parameters are summarized in Table 1.
Table 1.
Nomenclature of parameters and variables
| Symbol | Physical meaning | Value (Dimension) |
Reference |
|---|---|---|---|
| Ppl | Pleural pressure | - | |
| Amplitude of the pleural pressure | 250 Pa | [40] | |
| Baseline of the pleural pressure | 750 Pa | [40] | |
| Pe | Pressure due to lung elasticity | - | |
| Pal (= Ppl + Pe) | Alveolar pressure | - | |
| Ptr | Tracheal pressure | - | |
| Qin | Inflow rate | 10–50 L/min | [24] |
| Uin | Inflow velocity | - | |
| Utr | Tracheal velocity | - | |
| Din | Inlet diameter of connector | 11 mm | - |
| Dout | Outlet diameter of connector | 15.4 mm | - |
| V | Present lung volume | - | |
| V0 | Reference lung volume | 1.5 × 10⁻³ m3 | [27] |
| λ (= (V/V0)1/3) | Stretch ratio | - | |
| E (= (λ2—1)/2) | Green’s strain | - | |
| Γ | Airway resistance | 200 kPa/m3 | - |
| T | Respiratory period | 5 s | - |
| a | Model coefficient | 3.0 | - |
| k | Coefficient of elastic stress of the lung | 10.1 Pa | - |
| Ρ | Fluid density | 1.18 kg/m3 | - |
| µ | Fluid viscosity | 1.86 × 10⁻⁵ Pa·s | - |
| θ | Inlet angle | 30°, 45°, 60° | - |
| α | Coefficient for temporal updating of the velocity of outlet3 (Uout3) |
0.3 (in normal) 0.8 (in stenosis) |
- |
Results
Model validation and EEP in a normal connector
Figure 3d shows a comparison of the magnitude of EEP obtained with numerical simulation versus experimental measurements as a function of inlet flow rate Qin in a normal connector (i.e., inlet angle θ = 60° and without stenosis). It is expected that clinically reasonable PEEP is over 2 cmH2O (196.2 Pa [6, 26]). Calibrations were performed for the parameters in the lumped lung model (a, k, and Γ) shown in Eqs. (3) and (7), including the coefficient α for the temporal updating of Utr. The EEP values obtained via experimental measurements (EEPexp) and numerical simulations (EEPsim) are summarized in Table 2. For the smallest Qin = 10 L/min, the EEP value was very small and sometimes became negative. Thus, the EEP value for such small Qin (≤ 10 L/min) was defined as 0. When these values were evaluated in terms of the difference in the magnitude of EEP per 1 cmH2O between the numerical and experimental results |EEPexp—EEPsim|/cmH2O, the differences did not exceed than 0.061 for all Qin, and the calculated magnitudes of EEPsim were within the range of error of the experimental data (Fig. 3d). The results indicate that the developed model makes it possible to investigate the magnitude of EEP within an accuracy of 1 cmH2O, and thus, the same model parameters are used hereafter (see Table 1).
Table 2.
EEP values via experimental measurements (EEPexp) and numerical simulations (EEPsim)
|
Qin [L/min] |
EEPexp [Pa] |
EEPsim [Pa] |
|EEPexp – EEPsim|/EEPexp [-] |
|EEPexp – EEPsim|/cmH2O [-] |
|---|---|---|---|---|
| 10 | 0 | 2.331 | - | 0.024 |
| 30 | 16.66 | 20.58 | 0.235 | 0.040 |
| 50 | 49.98 | 55.96 | 0.120 | 0.061 |
The dependence of the meshes on the magnitude of EEP was tested, and the calculated EEP was 20.58 Pa with the present resolution (i.e., 40 000 meshes) and 20.84 Pa with double resolution (approximately 80,000 meshes in total). Because the relative difference in the magnitude of EEP between the present and higher resolutions was less than 1%, it was considered appropriate to examine the numerical results obtained with the present resolution.
A different meshing style, involving increasing the number of prismatic layer and the adaptive meshes in the constricted area, was tested for severe geometry, characterized by 60% stenosis and the sharpest inlet angle (30°). The present model, with a total of ~ 60,000 meshes for this type of constricted connector, is called model C1, while the reconstructed model with a total of over 100,000 meshes is called model C2. The calculated magnitude of EEP obtained with model C1 for Qin = 30 L/min was 156.5 Pa, and that obtained with model C2 was 172.1 Pa. The relative difference in the magnitude of EEP was 0.098. Hence, the present meshing style still preserves a 1-cmH2O accuracy for the magnitude of EEP.
The flow field in a normal connector and the tracheal pressure Utr during the respiratory period were investigated. Figure 4a shows the time history of the given pleural pressure Ppl, the calculated alveoli pressure Pal obtained with the lumped lung model, and the calculated tracheal pressure Ptr obtained with CFD. Data are shown after Pal and Ptr have reached to the stable periodic phase (t ≥ 2.0 s). All data used hereafter were obtained after these calculated values reached a stable periodicity, in order to avoid the influence of the initial condition ( = = 0).
Fig. 4.

a Time history of the pleural pressure Ppl, calculated alveoli pressure Pal, and tracheal pressure Ptr (= Pout3), where data are shown after Pal and Ptr have reached the stable periodic phase. Snapshots of b pressure and c velocity fields in a normal connector in each respiratory phase: (left) inspiration, (middle) expiration, and (right) the end of expiration defined with Utr = 0. Snapshots of streamlines in each phase are also displayed in c, where the color represents the velocity magnitude. The results were obtained with Qtr = 30 L/min
Figure 4b and 4c show snapshots of pressure and velocity fields, respectively, in a normal connector for each respiratory state. During inspiration, the pressure in the upper bifurcated area was relatively high because the inlet flow directly reached that location with large momentum and diverged to the tracheal and outlet regions (left in Fig. 4b and 4c. This high-pressure field shifted and expanded toward the tracheal regions during expiration. The direction of the inlet flow was sharply changed by the expiratory flow from outlet 3 (middle in Fig. 4b and 4c. At the end of expiration, defined by Utr = 0, a high-pressure field again emerged in the upper bifurcated area, and some amount of the inflow moved to the tracheal region, resulting in recirculation there (right in Fig. 4b and 4c.
Figure 5a shows the time history of Utr and lung volume V during period T (= 5 s) at Qin = 30 L/min in a normal connector, where the data were obtained only after the stable periodic behavior was achieved. When Utr reaches zero (i.e., start and end of expiration), the lung volume approaches its maximum and minimum (Fig. 5a). Thus, there is a finite phase difference between the two waves. This phase difference remains the same even for different Qin (data not shown). Figure 5b shows the tidal volume ΔVtidal as a function of Qin. ΔVtidal was calculated as the volume change from minimum Vmin to maximum Vmax, i.e., ΔVtidal = Vmax—Vmin. The pressure difference between the tracheal pressure and alveolar pressure (Ptr—Pal) in Eq. (7) decreased as Qin increased, resulting in a decrease in tidal volume; i.e., the magnitude of Utr decreased. Such passive regulation during exhalation qualitatively agrees with experimental measurements using high-flow nasal ventilation, especially in healthy subjects [4].
Fig. 5.

a Time history of the tracheal velocity Utr and lung volume V during a period T (= 5 s) at Qin = 30 L/min. b The tidal volume ΔVtidal as a function of Qin. Data were obtained after reaching stable periodic behavior
Figure 6 shows the calculated magnitude of EEP for different inlet angles θ (= 30° and 45°) as a function of inflow rate Qin. Although the magnitude of EEP increased as the inflow rate Qin increased and as the inlet angle decreased (Fig. 6), the relative difference in EEP between the normal (θ = 60°) and sharpest angle (θ = 30°) decreased as the inflow rate increased; (EEP|θ = 30°—EEP|θ = 60°)/EEP|θ = 60° = 0.47, 0.41, and 0.38 for Qin = 10, 30, and 50 L/min, respectively.
Fig. 6.

EEP as a function of inlet flow rate Qin in a normal connector for different inlet angles θ
Effect of connector stenosis on EEP
The effect of connector stenosis on EEP was investigated. Figure 7a shows the time history of the pleural, alveolar, and tracheal pressures (Ppl, Pal, and Ptr) in a connector with 50% stenosis. The baseline of Pal and Ptr values were higher than those in a normal connector, even for the same amplitude of Ppl (Fig. 7a).
Fig. 7.

a Time histories of Ppl, Pal, and Ptr. Snapshots of b pressure and c velocity fields in each respiratory phase in a connector with 50% stenosis: (left) inspiration, (middle) expiration, and (right) end of expiration. The results were obtained with Qtr = 30 L/min
The mechanism of generating such large EEP involves the pressure field in the connector, as shown in Fig. 7b. The pressure field was constantly high during inspiration. This was especially true in the inlet region (i.e., upstream region before stenosis) and the upper bifurcated area; indeed, in the bifurcated area the pressure reached 250 Pa, which was approximately 7 times higher than that in a normal connector (Fig. 7b). Since a reduced area generates fast flow, flow administrated at the inlet can reach the tracheal region even during and at the end of expiration, as shown in Fig. 7c. These results suggest that connector constriction potentially generates PEEP.
Figure 8a shows the effect of the stenosis rate on EEP and ΔVtidal at Qin = 30 L/min. The calculated EEP normalized by the EEP value obtained with a normal connector (0% stenosis) drastically increased for stenosis over 50% (Fig. 8a, left axis). Similar results were also obtained in previous numerical analyses of tracheal flow using the Yang-shih k-ε turbulence model [5], where the simulated pressure drop in the stenotic region dramatically increased only when far more than 70% of the tracheal lumen was obliterated, both for Qin = 15 and 30 L/min. The calculated EEP at 70% stenosis was almost 8 times higher than that in the normal connector (Fig. 8a, left axis). ΔVtidal normalized by that obtained with a normal connector sharply decreased for stenosis over 50% (Fig. 8a, right axis). ΔVtidal was commonly decreased in both a normal and constricted connector when Qin was increased, while the rate of decrease for Qin was almost unchanged in the constricted connector (Fig. 8b).
Fig. 8.

a Normalized EEP (left axis) and normalized tidal volume (right axis) by those obtained with a normal connector (0% stenosis) at Qin = 30 L/min as a function of the degree of stenosis. b Tidal volume ΔVtidal obtained with the connector with 50% stenosis as a function of Qin. The results of ΔVtidal in a normal connector, as shown in Fig. 5, is also displayed
Figure 9 shows calculated EEPs for different degrees of stenosis as a function of Qin. The EEP obtained with a normal connector, as shown in Fig. 6, is also displayed. Although PEEP at the smallest Qin (= 10 L/min) was not expected even in the connector with 70% stenosis, the contribution of stenosis to PEEP generation became greater as Qin increased. At the maximum Qin (= 50 L/min), PEEP was estimated as 465.8 Pa (≈ 4.7 cmH2O), which is within the range of PEEP values (2–8 cmH2O) achieved by high-flow oxygen therapy [6, 26].
Discussion
PEEP attained by high-flow oxygen therapy using a tracheostomy tube in tracheostomized patients has been shown to have various clinical benefits [8, 35]. Although the relationship between the magnitude of EEP and inflow rates was previously investigated experimentally using high-flow tracheostomy [24, 38], it was still unknown whether simple geometrical changes in tracheostomy tube connectors, including the stenosis rate and inlet angles, could potentially generate PEEP. Since it is thought that PEEP is a consequence of the balance between connector fluid flow and lung mechanical responses, the 3D CFD of airflow in the connector during respiration under boundary conditions will be useful to understand the mechanical conditions necessary for PEEP generation. This will also be true while considering geometrical effects on EEP, especially those related to tracheostomy tube connectors. However, such computational frameworks have not yet been established. Thus, a numerical platform was developed in this study to investigate connector airflow and the magnitude of EEP under respiration, as represented by a lumped (0D lung) model. This numerical model made it possible to investigate the flow field in the connector (Figs. 4 and 7) and to quantify the magnitude of EEP (Figs. 3d and 6). Furthermore, the developed model demonstrated passive regulation of tidal volume (Figs. 5 and 8), which was impeded by large inflow rates as reported by previous studies involving experimental measurements using high-flow nasal ventilation [4]. The effect of connector stenosis on EEP was also quantified, and the results showed that PEEP can be expected by simply creating a stenosis, at least for stenosis over 50% and for Qin ≥ 30 L/min (Fig. 9). The calculated EEP obtained with the largest degree of stenosis (= 70% stenosis) led to an eightfold greater EEP than that in the normal connector at Qin = 30 L/min (Fig. 8a). This was consistent with the results obtained with the largest inflow rate (Qin = 50 L/min) (Fig. 9), specifically 55.96 Pa in the normal connector and 465.8 Pa (≈ 4.7 cmH2O) with 70% stenosis. Since it is expected that clinically reasonable PEEP is over 2 cmH2O [6, 26], numerical results suggest that geometrical constriction in a connector can potentially produce PEEP, which is conventionally obtained with nasal cannulae [6, 26]. Although sharp inlet angles also increased the magnitude of EEP, they cannot be expected to achieve clinically reasonable PEEP, since the PEEP value was less than 1 cmH2O even for the sharpest inlet angle θ = 30° and largest inflow rate Qin = 50 L/min (Fig. 6).
Fig. 9.

EEP for different degrees of stenosis as a function of inlet flow rate Qin. EEP obtained with a normal connector, as shown in Fig. 6, is also displayed
In experimental measurements using a lung phantom, the expiratory time (3.3 s) was set to be relatively longer than the inspiratory time (0.7 s) so that the EEP could be easily detected from periodic tracheal pressure profiles (Fig. 3c). Thus, comparison between the numerical and experimental measurements was focused on the magnitude of EEP, and they exhibited discrepancies in temporal values such as Ptr and Utr except in the end-expiration phases. Despite these differences, the developed model makes it possible to investigate the magnitude of EEP within 1-cmH2O accuracy, since the differences in this magnitude per 1 cmH2O between the numerical and experimental results |EEPexp—EEPsim|/cmH2O were less than 0.061 for all Qin, and the numerical results were in the range of errors of the experimental results (Fig. 3d).
Since EEP is thought to depend on the length of the constricted portion of tracheostomy tube connectors, future studies should investigate the effect of this length (100–101 mm) on the degree of EEP and also compare the calculated EEP with experimental measurements. The combination of a large degree of stenosis, sharp inlet angle, and large inflow rate may pose a risk of ventilator-associated (or -induced) lung injury [33], caused by a pressure of ≥ 30 cmH2O (≈ 29.43 kPa) [2]. Furthermore, a previous theoretical analysis by Mead et al. (1970) showed that 30 cmH2O of alveolar pressure produced 140 cmH2O of shear stress, which can potentially lead to ARDS [19]. Lesions in such cases are caused by overdistension, collapse and reopening, and oxygen toxicity [33]. Since the change of lung volume was simply modeled by isotropic deformation with isotropic lung tissue [9], prediction of the aforementioned mechanical damage in the lung will be required for more precise modeling that takes into account the viscoelasticity of extra- and intra-parenchymal lung bronchi [29, 31].
Although the material deformability of the connector walls was neglected in this study, it may play important roles, especially for reducing sounds in clinical applications. Expiratory crackles were numerically investigated in terms of the relationship between airway closure dynamics and acoustic fluctuations in a study that considered the elastic deformation of the airway wall [11]. It would be interesting to study how much wall deformability reduces sound, even at high flow rates, while preserving PEEP. Numerical treatment of luminal surfaces may be also important, especially for wet surfaces. It is assumed that the device lumen becomes wet due to patient respiration, especially during long-term application, and therefore, the effect on PEEP of two-phase flow, such as that present at the liquid–air interface, is among the next challenges in terms of future research. Although the tested respiratory rate (0.25 Hz) did not affect the time history of tracheal pressure, as shown in Fig. 3c, more frequent respirations potentially generate harmonic flow behavior in the trachea (i.e., collapsing the airflow during inspiration and expiration). Furthermore, frequent respirations may also cause the pendelluft phenomenon, which decreases gas exchange and is defined as the movement of air within the lung from nondependent to dependent regions without changes in tidal volume during mechanical ventilation [1, 44]. It is known that a humidified and warmed gas mixture favors mucociliary function and reduces upper airway resistance [34, 36]. Thus, it would also be interesting to study whether the synergistic combination of PEEP and pulsatile airflow in the trachea enhance gas exchange or increase the level of oxygen in the blood.
The developed numerical model made it possible to assess both PEEP and tidal volume based on fluid dynamics of the airflow in the connector. Numerical analysis that considers mechanical lung parameters representing patient-specific lung states will be helpful in the clinical care of tracheostomized patients, specifically in decision-making for achieving precise inflow rates while preserving PEEP and determining when to remove the ventilator. Numerical results based on mechanics may also facilitate therapeutic decision-making not only for tracheostomized patients but also for those with lung diseases such as ARDS and those assisted by ECMO.
Conclusion
A computational platform to evaluate PEEP in tracheostomized patients was developed. The airflow in the tracheostomy tube connector was simulated, and the tracheal pressure, which is the outlet pressure of the connector, was calculated by 3D CFD analysis coupled with a lumped lung model. The numerical results for the magnitude of EEP agreed well with experimental measurements and made it possible to investigate the detailed dynamics of airflow in the connector. This suggests that the model can be used to estimate the magnitude of PEEP while taking into account the 3D airflow field in the connector. Although sharp inlet angles increased the magnitude of EEP, they cannot be expected to result in clinically reasonable PEEP. On the other hand, geometrical constriction in a connector can potentially produce PEEP, which is conventionally obtained with nasal cannulae. The numerical results in this study may assist in decision-making regarding the treatment of tracheostomized patients as well as those with other lung diseases such as ARDS and those receiving ECMO.
Acknowledgements
This research was supported by JSPS KAKENHI Grant Numbers JP19H01175 and JP20H04504; by Osaka University Global Center for Medical Engineering and Informatics (MEI center); by the Keihanshin Consortium for Fostering the Next Generation of Global Leaders in Research (K-CONNEX), established by Human Resource Development Program for Science and Technology; and by MEXT as “Program for Promoting Researches on the Supercomputer Fugaku” (Development of personalized medical support technology based on simulation data science of whole brain blood circulation) (hp200136). The authors thank Drs. Naoto Yokoyama and Hiroshi Yamashita for their assistance with the preparation of this work.
Biographies
Shiori Kageyama
, M.E., completed her bachelor’s degree and master’s degree at Osaka University, Japan, in 2020 and 2022, respectively. 
Naoki Takeishi
, Ph.D., completed his master’s degree and Ph.D. degree at Tohoku University, Japan, in 2013 and 2016, respectively. He is currently an assistant professor at Osaka University. He performs research on computational fluid mechanics and biomechanics, with a particular focus on complex fluid dynamics such as cellular-scale blood flow and biorheology. 
Hiroki Taenaka
, M.D., completed his medical degree at Osaka University, Japan, in 2013. He is currently a Ph.D. candidate at the Department of Anesthesiology and Intensive Care Medicine, Osaka University Graduate School of Medicine. 
Takeshi Yoshida
, M.D., completed his medical degree and Ph.D. degree at Mie University School of Medicine, Japan, in 2003 and Osaka University, Japan, in 2013, respectively. He is currently a Lecturer at the Department of Anesthesiology and Intensive Care Medicine, Osaka University Graduate School of Medicine. 
Shigeo Wada
, Ph.D., received his Ph.D. from Osaka University, Japan, in 1991 and is currently a Professor of Mechanical Science and Bioengineering in Osaka University. His expertise is computational biomechanics involving the respiratory and cardiovascular systems. He is a member of the World Council of Biomechanics. 
Author contribution
S.K. and N.T. analyzed data; H.T. and T.Y. performed experiments; S.K., N.T., and S.W. interpreted simulation results; N.T. prepared figures; N.T. drafted the manuscript; N.T. edited and revised the manuscript; S.K., N.T., H.T., T.Y., and S.W. approved the final version of the manuscript; N.T., T.Y., and S.W. contributed to the research conception and design. All authors have read and agreed to the published version of the manuscript.
Declarations
Conflict of interest
The authors declare no competing interests.
Footnotes
Publisher's note
Springer Nature remains neutral with regard to jurisdictional claims in published maps and institutional affiliations.
References
- 1.Alzahranya M, Banerjeea A, Salzman G. The role of coupled resistance-compliance in upper tracheobronchial airways under high frequency oscillatory ventilation. Med Eng Phys. 2014;36:1593–1604. doi: 10.1016/j.medengphy.2014.08.012. [DOI] [PubMed] [Google Scholar]
- 2.Acute Respiratory Distress Syndrome Network. Brower RG, Matthay MA, Morris A, Schoenfeld D, Thompson BT, Wheeler A. Ventilation with lower tidal volumes as compared with traditional tidal volumes for acute lung injury and the acute respiratory distress syndrome. N Engl J Med. 2000;4:1301–1308. doi: 10.1056/NEJM200005043421801. [DOI] [PubMed] [Google Scholar]
- 3.Barbini P, Brighenti C, Gnudi G. A simulation study of expiratory flow limitation in obstructive patients during mechanical ventilation. Ann Biomed Eng. 2006;34:1879–1889. doi: 10.1007/s10439-006-9213-6. [DOI] [PubMed] [Google Scholar]
- 4.Bräunlich J, Beyer D, Mai D, Hammschmidt S, Seyfarth H-J, Wirtz H. Effects of nasal high flow on ventilation in volunteers, COPD and idiopathic pulmonary fibrosis patients. Respiration. 2013;85:319–325. doi: 10.1159/000342027. [DOI] [PubMed] [Google Scholar]
- 5.Brouns M, Jayaraju ST, Lacor C, Mey JD, Noppen M, Vincken W, Verbanck S. Tracheal stenosis: a flow dynamics study. J Appl Physiol. 2007;103:1178–1184. doi: 10.1152/japplphysiol.01063.2006. [DOI] [PubMed] [Google Scholar]
- 6.Corley A, Caruana LR, Barnett AG, Tronstad O, Fraser JF. Oxygen delivery through high-flow nasal cannulae increase end-expiratory lung volume and reduce respiratory rate in post-cardiac surgical patients. Br J Anaesth. 2011;107:998–1004. doi: 10.1093/bja/aer265. [DOI] [PubMed] [Google Scholar]
- 7.Engoren M, Arslanian-Engoren C, Fenn-Buderer N. Hospital and longterm outcome after tracheostomy for respiratory failure. Chest. 2004;125:220–227. doi: 10.1378/chest.125.1.220. [DOI] [PubMed] [Google Scholar]
- 8.Franklin D, Babl FE, Schlapbach LJ, Oakley E, Craig S, Neutze J, Furyk J, Fraser JF, Jones M, Whitty JA, Dalziel SR, Schibler A. A randomized trial of high-flow oxygen therapy in infants with bronchiolitis. N Engl J Med. 2018;378:1121–1131. doi: 10.1056/NEJMoa1714855. [DOI] [PubMed] [Google Scholar]
- 9.Fung Y-C. Stress, deformation, and atelectasis of the lung. Circ Res. 1975;37:481–496. doi: 10.1161/01.RES.37.4.481. [DOI] [PubMed] [Google Scholar]
- 10.Hashimoto DA, Axtell AL, Auchincloss HG. Percutaneous tracheostomy. N Engl J Med. 2020;383:e112. doi: 10.1056/NEJMvcm2014884. [DOI] [PubMed] [Google Scholar]
- 11.Ii S, Wada S. Direct numerical simulation of expiratory crackles: relationship between airway closure dynamics and acoustic fluctuations. J Biomech. 2017;50:234–239. doi: 10.1016/j.jbiomech.2016.11.033. [DOI] [PubMed] [Google Scholar]
- 12.Ismail M, Comeford A, Wall WA. Coupled and reduced dimensional modeling of respiratory mechanics during spontaneous breathing. Int J Numer Meth Biomed Eng. 2013;29:1285–1305. doi: 10.1002/cnm.2577. [DOI] [PubMed] [Google Scholar]
- 13.Kageyama S, Takeishi N, Harada N, Taniguchi K, Morita K, Wada S. Airway performance in infants with congenital tracheal stenosis associated with unilateral pulmonary agenesis: effect of tracheal shape on energy flux. Med Biol Eng Comput. 2022 doi: 10.1007/s11517-022-02601-4. [DOI] [PubMed] [Google Scholar]
- 14.Kim M, Collier GJ, Wild JM, Chung YM. Effect of upper airway on tracheobronchial fluid dynamics. Int J Numer Meth Biomed Eng. 2018;34:e3112. doi: 10.1002/cnm.3112. [DOI] [PubMed] [Google Scholar]
- 15.Ma B, Lutchen K. An anatomically based hybrid computational model of the human lung and its application to low frequency oscillatory mechanics. Ann Biomed Eng. 2006;34:1691–1704. doi: 10.1007/s10439-006-9184-7. [DOI] [PubMed] [Google Scholar]
- 16.Ma B, Lutchen KR. CFD simulation of aerosol deposition in an anatomically based human large-medium airway model. Ann Biomed Eng. 2008;37:271–285. doi: 10.1007/s10439-008-9620-y. [DOI] [PubMed] [Google Scholar]
- 17.Malvè M, Chandra S, López-Villalobos JL, Finol EA, Ginel A, Doblaré M. CFD analysis of the human airways under impedance-based boundary conditions: application to healthy, diseased and stented trachea. Comput Methods Biomech Biomed Eng. 2013;16:198–216. doi: 10.1080/10255842.2011.615743. [DOI] [PubMed] [Google Scholar]
- 18.Mead J. Control of respiratory frequency. J Appl Physiol. 1960;15:325–336. doi: 10.1152/jappl.1960.15.3.325. [DOI] [Google Scholar]
- 19.Mead J, Takishima T, Leith D. Stress distribution in lungs: a model of pulmonary elasticity. J Appl Physiol. 1970;28:596–608. doi: 10.1152/jappl.1970.28.5.596. [DOI] [PubMed] [Google Scholar]
- 20.Meade MO, Cook DJ, Guyatt GH, Slutsky AS, Arabi YM, Cooper DJ, Davies AR, Hand LE, Zhou Q, Thabane L, Austin P, Lapinsky S, Baxter A, Russell J, Skrobik Y, Ronco JJ, Stewart TE, Lung Open Ventilation Study Investigators Ventilation strategy using low tidal volumes, recruitment maneuvers, and high positive end-expiratory pressure for acute lung injury and acute respiratory distress syndrome: a randomized controlled trial. JAMA. 2008;299:637–645. doi: 10.1001/jama.299.6.637. [DOI] [PubMed] [Google Scholar]
- 21.Milési C, Baleine J, Matecki S, Durand S, Combes C, Novais ARB, Combonie G. Is treatment with a high flow nasal cannula effective in acute viral bronchiolitis? Intensive Care Med. 2013;39:1088–1094. doi: 10.1007/s00134-013-2879-y. [DOI] [PubMed] [Google Scholar]
- 22.Moller W, Celik G, Feng S, Bartenstein P, Meyer G, Oliver E, Schmid O, Tatkov S. Nasal high flow clears anatomical dead space in upper airway models. J Appl Physiol. 2015;118:1525–1532. doi: 10.1152/japplphysiol.00934.2014. [DOI] [PMC free article] [PubMed] [Google Scholar]
- 23.Moller W, Feng S, Domanski U, Franke KJ, Celik G, Bartenstein P, Becker S, Meyer G, Schmid O, Eickelberg O, Tatkov S, Nilius G. Nasal high flow reduces dead space. J Appl Physiol. 2017;122:191–197. doi: 10.1152/japplphysiol.00584.2016. [DOI] [PMC free article] [PubMed] [Google Scholar]
- 24.Natalini D, Grieco DL, Santantonio MT, Mincione L, Toni F, Anzellotti GM, Eleuteri D, Giannatale PD, Antonelli M, Maggiore SM. Physiological effects of high-flow oxygen in tracheostomized patients. Ann Intensive Care. 2019;9:114. doi: 10.1186/s13613-019-0591-y. [DOI] [PMC free article] [PubMed] [Google Scholar]
- 25.Papazian L, Corley A, Hess D, Fraser JF, Frat J-P, Guitton C, Jaber S, Maggiore SM, Nava S, Rello J, Ricard J-D, Stephan F, Trisolini R, Azoulay E. Use of high-flow nasal cannula oxygenation in ICU adults: a narrative review. Intensive Care Med. 2016;42:1336–1349. doi: 10.1007/s00134-016-4277-8. [DOI] [PubMed] [Google Scholar]
- 26.Parke RL, McGuinness SP. Pressures delivered by nasal high flow oxygen during all phases of the respiratory cycle. Respir Care. 2013;58:1621–1624. doi: 10.4187/respcare.02358. [DOI] [PubMed] [Google Scholar]
- 27.Pedley TJ. Pulmonary fluid dynamics. Ann Rev Fluid Mech. 1977;9:229–274. doi: 10.1146/annurev.fl.09.010177.001305. [DOI] [Google Scholar]
- 28.Peek GJ, Mugford M, Tiruvoipati R, Wilson A, Allen E, Thalanany MM, Hibbert CL, Truesdale A, Clemens F, Cooper N, Firmin RK, Elbourne D, CESAR trial collaboration Efficacy and economic assessment of conventional ventilatory support versus extracorporeal membrane oxygenation for severe adult respiratory failure (CESAR): a multicentre randomised controlled trial. Lancet. 2009;374:1351–1363. doi: 10.1016/S0140-6736(09)61069-2. [DOI] [PubMed] [Google Scholar]
- 29.Rausch SMK, Martin C, Bornemann PB, Uhlig S, Wall WA. Material model of lung parenchyma based on living precision-cut lung slice testing. J Mech Behav Biomed Mater. 2011;4:583–592. doi: 10.1016/j.jmbbm.2011.01.006. [DOI] [PubMed] [Google Scholar]
- 30.Van Rhein T, Alzahrany M, Bajerjee A, Salzman G. Fluid flow and particle transport in mechanically ventilated airways. part I. fluid flow structures. Med Biol Eng Comput. 2016;54:1085–1096. doi: 10.1007/s11517-015-1407-3. [DOI] [PubMed] [Google Scholar]
- 31.Sattari S, Eskandari M. Characterizing the viscoelasticity of extra- and intra-parenchymal lung bronchi. J Mech Behav Biomed Mater. 2020;110:103824. doi: 10.1016/j.jmbbm.2020.103824. [DOI] [PubMed] [Google Scholar]
- 32.Shih TH, Liou WW, Shabbir A, Yang Z, Zhu J (1995) A new k-ε eddy viscosity model for high reynolds number turbulent flows. Comput Fluids 24:227–238. 10.1016/0045-7930(94)00032-T
- 33.Slutsky AS, Ranieri VM. Ventilator-induced lung injury. N Engl J Med. 2013;369:2126–2136. doi: 10.1056/NEJMra1208707. [DOI] [PubMed] [Google Scholar]
- 34.Spoletini G, Alotaibi M, Blasi F, Hill NS. Heated humidified high-flow nasal oxygen in adults: mechanisms of action and clinical implications. Chest. 2015;148:253–261. doi: 10.1378/chest.14-2871. [DOI] [PubMed] [Google Scholar]
- 35.Stripoli T, Spadaro S, Di mussi R, Volta CA, Trerotoli P, Carlo FD, Iannuzziello R, Sechi F, Pierucci P, Staffieri F, Bruno F, Camporota L, Grasso S. High-flow oxygen therapy in tracheostomized patients at high risk of weaning failure. Ann Intensive Care. 2019;9:4. doi: 10.1186/s13613-019-0482-2. [DOI] [PMC free article] [PubMed] [Google Scholar]
- 36.Sztrymf B, Messika J, Bertrand F, Hurel D, Leon R, Dreyfuss D, Ricard J-D. Beneficial effects of humidified high flow nasal oxygen in critical care patients: a prospective pilot study. Intensive Care Med. 2011;37:1780–1786. doi: 10.1007/s00134-011-2354-6. [DOI] [PubMed] [Google Scholar]
- 37.Takeishi N, Miki T, Otani T, Ii S, Morita K, Wada S. Fluid dynamic assessment of tracheal flow in infants with congenital tracheal stenosis before and after surgery. Med Biol Eng Comput. 2019;57:837–847. doi: 10.1007/s11517-018-1928-7. [DOI] [PubMed] [Google Scholar]
- 38.Thomas M, Joshi R, Cave G. How much PEEP does high flow deliver via tracheostomy? a literature review and benchtop experiment. Crit Care Res Pract. 2021;2021:6036891. doi: 10.1155/2021/6036891. [DOI] [PMC free article] [PubMed] [Google Scholar]
- 39.Weibel ER, Gomez DM. Architecture of the human lung. Science. 1962;137:577–585. doi: 10.1126/science.137.3530.577. [DOI] [PubMed] [Google Scholar]
- 40.West JB, Luks AM (2021) West’s respiratory physiology. 11th edn. Wolters Kluwer, Philadelphia
- 41.Wilson TA. Design of the bronchial tree. Nature. 1967;213:668–669. doi: 10.1038/213668a0. [DOI] [PubMed] [Google Scholar]
- 42.Xiao Q, Cetto R, Doorly DJ, Bates AJ, Rose JN, McIntyre C, Comerford A, Madani G, Tolley NS, Schroter R. Assessing changes in airflow and energy loss in a progressive tracheal compression before and after surgical correction. Ann Biomed Eng. 2020;48:822–833. doi: 10.1007/s10439-019-02410-1. [DOI] [PMC free article] [PubMed] [Google Scholar]
- 43.Yoshida T, Uchiyama A, Mashimo T, Fujino Y. The effect of ventilator performance on airway pressure release ventilation: a model lung study. Anesth Analg. 2011;113:529–533. doi: 10.1213/ANE.0b013e31821d72d0. [DOI] [PubMed] [Google Scholar]
- 44.Yoshida T, Torsani V, Gomes S, De Santis RR, Beraldo MA, Costa ELV, Tucci MR, Zin WA, Kavanagh BP, Amato MBP. Spontaneous effort causes occult pendelluft during mechanical ventilation. Am J Respir Crit Care Med. 2013;188:1420–1427. doi: 10.1164/rccm.201303-0539OC. [DOI] [PubMed] [Google Scholar]