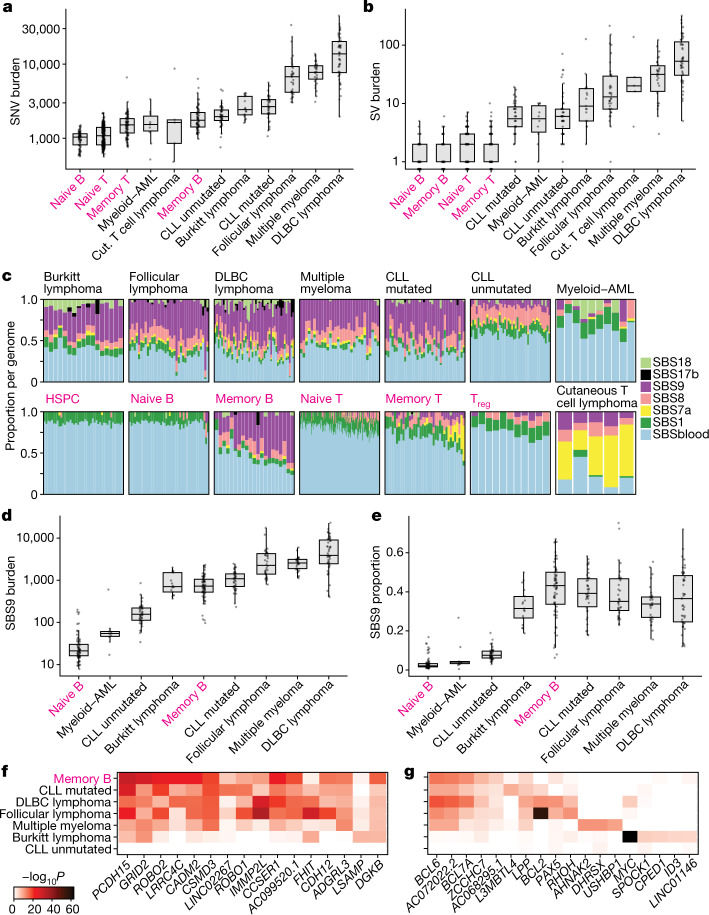
Fig. 5. Comparison of mutational patterns with malignancy.
a,b, SNV (a) and structural variation (SV) burden (b) by normal cell type or malignancy. The box shows the interquartile range and the centre line shows the median. Whiskers extend to the minimum of either the range or 1.5× the interquartile range. Normal lymphocytes (magenta) exclude paediatric samples. AML, acute myeloid leukaemia; CLL, chronic lymphocytic leukaemia; Cut, cutaneous; DLBC, diffuse large B cell. c, The proportion of mutational signatures per genome. For each genome, signatures with a 90% confidence interval lower bound of less than 1% are excluded. Normal lymphocytes (labelled in magenta) are from donor AX001. Treg, T regulatory cells. d,e, SBS9 burden (d) and proportion (e) by cell type or malignancy. The box shows the interquartile range and the centre line shows the median. Whiskers extend to the minimum of either the range or 1.5× the interquartile range. f,g, Heat map showing the level of enrichment of SBS9 (f) and SHM (g) signatures near frequently mutated genes for that signature compared with the whole genome. Number of structural variants per group: B cell: 145, T cell: 841, ALL: 523, Burkitt lymphoma: 305, CLL mutated: 252, CLL unmutated: 440, cutaneous T cell lymphoma: 204, DLBC lymphoma: 3,754, follicular lymphoma: 1,095. a,b,d,e, Number of genomes per group: naive B: 68, memory B: 68, naive T: 332, memory T: 87, Burkitt lymphoma: 17, CLL mutated: 38, CLL unmutated: 45, cutaneous T cell lymphoma: 5, DLBC lymphoma: 47, follicular lymphoma: 36, multiple myeloma: 30, myeloid–AML: 10.

