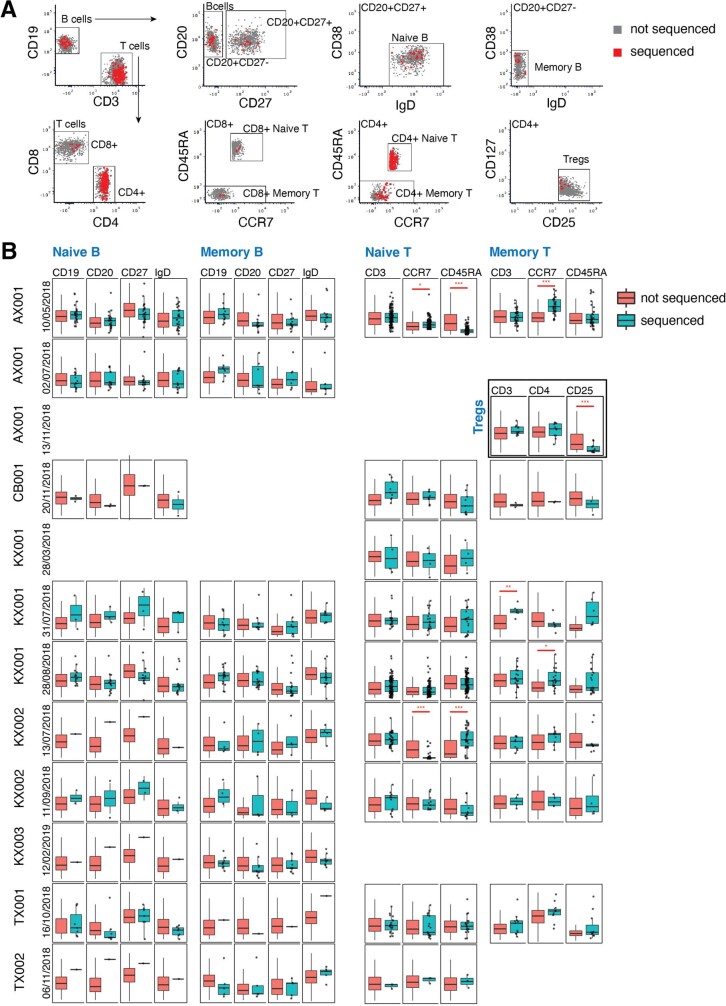
Extended Data Fig. 1. Assessment of culture bias by index flow-sorting.
(A) Representative scatterplots of cell surface marker fluorescence intensity measured by flow cytometry (sort AX001 10/05/2018; AX001 13/11/2018 for Treg gate). Cells that successfully seeded colonies are coloured red; cells that did not form colonies are coloured grey. (B) Box-and-whisker plots showing fluorescence intensity for different cell surface markers in the various lymphocyte populations (columns) across different patients and days of flow-sorting (rows). Cells that successfully seeded colonies are shown in teal; cells that did not form colonies in orange. Boxes show the interquartile range and the centre horizontal lines show the median. Whiskers extend to the minimum of either the range or 1.5× the interquartile range. Red asterisks show a statistically significant difference between the fluorescence values of colony forming versus non-colony forming cells (two-sided t-test, false-discovery rate *q < 0.05, **q < 0.01, ***q < 0.001, P-values in Table S10). The number of colony and non-colony forming cells per sort per subset can be found in Table S1.

