

Abstract
Medicaid expansion has been associated with improved colorectal cancer screening rates and earlier stage diagnosis, but its impact on survival among colon cancer patients is unknown. We hypothesized that patients with invasive, nonmetastatic colon cancer residing in Medicaid expansion states (MES) would have better survival rates compared to patients in non-expansion states (NES).
Methods:
This retrospective study of 86 413 patients (40-64 years old) undergoing surgical resection for a new diagnosis of invasive, nonmetastatic colon cancer included in the National Cancer Database (NCDB) from 2010 to 2015 compared overall survival (OS) in MES to NES. Cox proportional hazard models, fit for OS, and propensity score-matching (PSM) analysis were performed.
Results:
In this sample, 51 297 cases (59.2%) lived in MES and 35 116 (40.8%) in NES. Medicaid expansion states had earlier pathological stage compared to NES (stage I 25.38% vs 24.17%, stage II 32.93 vs 33.4%, and stage III 41.69 vs 42.43%; P < .001). 5-year OS in MES was higher than NES (79.1% vs 77.3%; P < .001); however, on both multivariable analysis (MVA) and PSM analysis, MES did not have significantly different OS from NES (hazard ratio (HR), .99, 95% confidence interval (CI), .95-1.03; P = .570; HR, .99, 95% CI, .95-1.03; P = .68).
Conclusion:
Among NCDB patients with invasive, nonmetastatic colon cancer residing in MES at time of diagnosis was associated with earlier pathological stage. However, on both MVA and PSM analysis, OS was not significantly different in MES vs NES. Research on patient outcomes, such as receipt of guideline concordant care, can further inform the impact of insurance coverage expansion efforts on cancer outcomes.
Keywords: colorectal, socioeconomic
Introduction
While colorectal cancer (CRC) remains the second leading cause of cancer death in the United States, its incidence and mortality rates have steadily declined over decades. This decline in mortality, largely attributed to effective screening, changes in risk factors, and improved treatments, has not been equitably distributed.1,2 In the 1970s, CRC mortality rates in the poorest counties were 20% lower than those in affluent counties; they are now 35% higher.3 Lack of health insurance coverage is associated with poorer outcomes for colon cancer patients, and the number of uninsured adults under age 65 years steadily rose to a high of 48.2 million persons in 2010.4,5
Enacted in 2010, the Affordable Care Act (ACA) led to a nationwide decrease in the rate of uninsured nonelderly adults from 17.8% in 2010 to 10.4% in 2018.6 Low-income adults, in particular, benefited from the ACA’s Medicaid expansion (ME) which extended Medicaid to households earning up to 138% the federal poverty line. However, the Supreme Court ruling in National Federation of Independent Business vs Sebelius led ME to become effectively optional at the state level. As of June 2021, 14 states have not implemented Medicaid expansion. This disparate implementation led to higher rates of uninsured nonelderly adults in non-expansion states (NES) compared to Medicaid expansion states (MES). In 2019, 15.5% of nonelderly adults in NES were uninsured compared to 8.3% in MES.7
Several recent studies have evaluated the impact of Medicaid expansion on colorectal cancer outcomes by examining colorectal cancer screening rates and stage at diagnosis in MES compared to NES.8–12 Additionally, Gan et al demonstrated a survival benefit for colorectal cancer patients in Kentucky following that state’s ME.13 We sought to build upon these earlier studies to determine the relationship between ME and colon cancer survival among nonmetastatic colon cancer patients in a national sample from the National Cancer Database. We expected patients undergoing definitive surgical resection for a new diagnosis of invasive, nonmetastatic colon cancer disease and residing in Medicaid expansion states at time of diagnosis to have better survival rates compared to patients in NES.
Methods
Data Source
Data were obtained from the National Cancer Database (NCDB), a clinical oncology database sourced from more than 1500 hospital registries. The NCDB is jointly sponsored by the American College of Surgeons and the American Cancer Society, and it is estimated to capture more than 70% of newly diagnosed cancer cases nationwide.
Population
Our retrospective cohort study consisted of individuals with colon cancer registered in the NCDB. We identified 908 503 eligible patients (see Figure 1). Inclusion criteria included patients with pathologic stage I-III colon cancer who underwent definitive surgical treatment. We excluded patients 65 years and older, patients with in situ tumors, and patients younger than 40 years, as Medicaid expansion status is censored in the NCDB for this younger age group. Patients with pathologic metastatic disease, missing survival data, diagnosis prior to early Medicaid expansion (2004-2009), previous cancers, secondary cancers, diagnosis at a different facility from where they obtained treatment, and those not receiving treatment were excluded.
Figure 1.
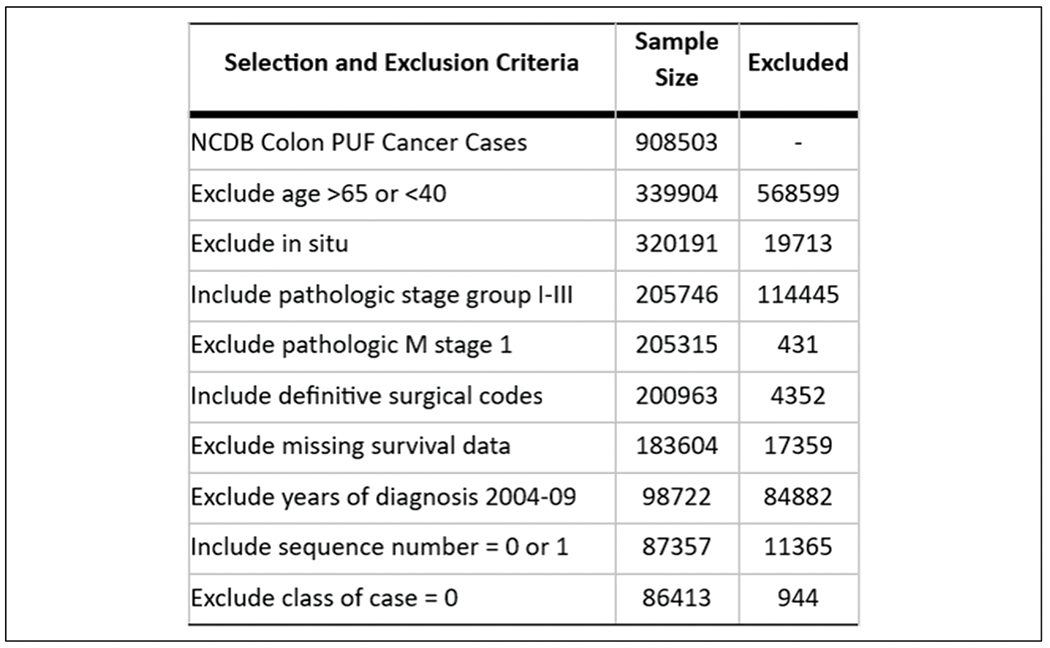
Study population.
Study Variables
Our primary exposure was residing in a state at time of diagnosis as defined by the Medicaid expansion categories utilized in the NCDB 2016 participant user file (PUF): early expansion (2010-2013), January 2014 expansion, late expansion (after January 2014), and non-expansion. Our primary outcome was overall survival (OS) defined as years from diagnosis to death or last contact. Cause-specific mortality is not available in the NCDB. We also examined pathologic stage, 30-day mortality, 90-day mortality, unplanned hospital readmission, days to surgery from diagnosis, and days to chemotherapy from diagnosis.
Characteristics studied included facility location by region (Northeast, Midwest, South, and West), facility type (community cancer, integrated network cancer, comprehensive community cancer, and academic/research), distance to facility (straight line distance in miles between a patient’s residential zip code and reporting hospital’s street address), year of diagnosis, age at diagnosis, race, sex, insurance status (private, government, and uninsured), median household income quartile (based on patient’s zip code and American Community Survey data), and educational attainment (based on the percentage of adults age 25 or older who did not graduate from HS in the patient’s zip code). Clinical stage was defined by the American Joint Committee on Cancer (AJCC) sixth and seventh editions staging for colon cancer. While the AJCC seventh edition brought new changes in substages for colon cancer, it did not include changes impacting overall stage.14
Statistical Analysis
Descriptive statistics were generated for categorical variables using frequencies and percentages, and for numeric variables using mean, median, standard deviation, and range. Overall survival was estimated using the Kaplan-Meier method and was compared using log-rank tests. Median follow-up time was 3.7 years. Kaplan-Meier curves were generated overall, and then were stratified by pathological stage and insurance. Select patient, facility, and treatment characteristics were compared across Medicaid expansion, both overall, and stratified by pathological stage group (I/II and III), using chi-squared tests and ANOVA. Time to surgery was included for all stages, while time to chemotherapy was also included for Stage III analysis.
Univariate Cox proportional hazards models were fit for OS as a function of covariates, both overall and stratified by stage. Multivariable Cox models were fit for OS as a function of pathological stage, zip code level education and income, year of diagnosis, insurance, race, facility type, distance to facility, and age, both overall and stratified by stage. In addition, propensity score matching (PSM) was also implemented, where ME status was matched on propensity scores using a greedy 5-1 digit match algorithm. Variables included stage, census tract level education and income, year of diagnosis, insurance, race, facility type, distance to facility, and age. Balance across covariates was checked using standardized differences between variables (see Supplemental Tables 1–4). Values less than 1 indicate appropriate balance.15 The effects were estimated in the matched sample with a Cox model with a robust variance estimator.16 propensity score matching was also performed overall and stratified by stage. Another multivariable Cox model was fit using the 4-level Medicaid expansion variable, and an interaction model was fit using the interaction of Medicaid expansion and insurance status. Finally, PSM was implemented using a generalized propensity score-matching approach to match across 4 groups.17 Statistical analysis was performed using SAS 9.4 (SAS Institute Inc., Cary, NC), and statistical significance was assessed at the .05 level.
Results
General Characteristics
After all exclusions, 86 413 patients were analyzed with 51 297 (59.36%) patients in the Medicaid expansion group and 35 116 (40.64%) in the non-expansion group. Mean patient age was 55.8 years (standard deviation (SD) 6.6 years). 53.3% of patients were male. Medicaid expansion states significantly differed from non-expansion states in several demographic factors (see Table 1) including having a higher proportion of patients treated at academic programs, a lower proportion of black patients, a lower rate of uninsured patients, shorter distances traveled to treatment centers, higher household median income, and higher HS degree attainment rates.
Table 1.
Descriptive Statistics of Nonmetastatic Colon Cancer Patients diagnosed 2010-2015 in the NCDB by State Medicaid Expansion Status.
| Medicaid expansion state |
|||||
|---|---|---|---|---|---|
| Covariate | Statistics | Level | No N = 35 116 | Yes N = 51 297 | Parametric P-valuea |
| Facility location | N (Col %) | Northeast | 478 (1.36) | 16067 (31.32) | <.001 |
| N (Col %) | South | 28904 (82.31) | 6995 (13.64) | ||
| N (Col %) | Midwest | 4965 (14.14) | 16077 (31.34) | ||
| N (Col %) | West | 769 (2.19) | 12158 (23.7) | ||
| Facility type | N (Col %) | Community cancer program | 3754 (10.69) | 6191 (12.07) | <.001 |
| N (Col %) | Comprehensive community cancer program | 17179 (48.92) | 20322 (39.62) | ||
| N (Col %) | Academic/research program | 8308 (23.66) | 18036 (35.16) | ||
| N (Col %) | Integrated network cancer program | 5875 (16.73) | 6748 (13.15) | ||
| Year of diagnosis | N (Col %) | 2010 | 5405 (15.39) | 7598 (14.81) | .051 |
| N (Col %) | 2011 | 5520 (15.72) | 8138 (15.86) | ||
| N (Col %) | 2012 | 5814 (16.56) | 8377 (16.33) | ||
| N (Col %) | 2013 | 5960 (16.97) | 8660 (16.88) | ||
| N (Col %) | 2014 | 6092 (17.35) | 9243 (18.02) | ||
| N (Col %) | 2015 | 6325 (18.01) | 9281 (18.09) | ||
| Race | N (Col %) | White | 26288 (74.86) | 40436 (78.83) | <.001 |
| N (Col %) | Black | 7506 (21.37) | 6923 (13.5) | ||
| N (Col %) | Asian | 620 (1.77) | 2527 (4.93) | ||
| N (Col %) | Other | 702 (2) | 1411 (2.75) | ||
| Sex | N (Col %) | Male | 18695 (53.24) | 27325 (53.27) | .930 |
| N (Col %) | Female | 16421 (46.76) | 23972 (46.73) | ||
| Insurance status | N (Col %) | Not insured | 3702 (10.76) | 2420 (4.79) | <.001 |
| N (Col %) | Private | 22004 (63.93) | 34414 (68.07) | ||
| N (Col %) | Government | 8711 (25.31) | 13725 (27.15) | ||
| Clinical stage group | N (Col %) | 1 | 6160 (44.28) | 8616 (42.84) | .019 |
| N (Col %) | 2 | 4313 (31) | 6478 (32.21) | ||
| N (Col %) | 3 | 3438 (24.71) | 5019 (24.95) | ||
| Pathologic stage group | N (Col %) | 1 | 8489 (24.17) | 13018 (25.38) | <.001 |
| N (Col %) | 2 | 11729 (33.4) | 16892 (32.93) | ||
| N (Col %) | 3 | 14898 (42.43) | 21387 (41.69) | ||
| Great circle distance | N (Col %) | ≤10 miles | 16715 (47.65) | 30416 (59.38) | <.001 |
| N (Col %) | 10-50 miles | 15137 (43.15) | 17482 (34.13) | ||
| N (Col %) | >50 miles | 3230 (9.21) | 3325 (6.49) | ||
| Median income quartiles | N (Col %) | < $38,000 | 9278 (26.47) | 7622 (14.9) | <.001 |
| 2008-2012 | N (Col %) | $38,000-$47,999 | 9558 (27.27) | 10294 (20.12) | |
| N (Col %) | $48,000-$62,999 | 8498 (24.24) | 13938 (27.24) | ||
| N (Col %) | ≥$63,000 | 7721 (22.03) | 19309 (37.74) | ||
| Percent No high school degree 2008-2012 | N (Col %) | ≥21.0% | 8825 (25.16) | 8570 (16.74) | <.001 |
| N (Col %) | 13.0-20.9% | 10754 (30.66) | 12617 (24.64) | ||
| N (Col %) | 7.0-12.9% | 9461 (26.98) | 17198 (33.59) | ||
| N (Col %) | <7.0% | 6031 (17.2) | 12821 (25.04) | ||
| Chemotherapy | N (Col %) | No | 17510 (51.75) | 25933 (52.12) | .290 |
| N (Col %) | Yes | 16327 (48.25) | 23823 (47.88) | ||
| 30 Day mortality | N (Col %) | Patient alive, or died more than 30 days after surgery performed | 34263 (97.57) | 50197 (97.86) | .021 |
| N (Col %) | Patient died 30 or fewer days after surgery performed | 340 (.97) | 447 (.87) | ||
| N (Col %) | Patient alive with fewer than 30 days of follow-up, surgery date missing, or last contact date m | 513 (1.46) | 653 (1.27) | ||
| 90 Day mortality | N (Col %) | Patient alive, or died more than 90 days after surgery performed | 33276 (94.76) | 48962 (95.45) | <.001 |
| N (Col %) | Patient died 90 or fewer days after surgery performed | 613 (1.75) | 768 (1.5) | ||
| N (Col %) | Patient alive with fewer than 90 days of follow-up, surgery date missing, or last contact date m | 1227 (3.49) | 1567 (3.05) | ||
| Unplanned hospital readmission within 30 days | N (Col %) | No | 32937 (94.83) | 48341 (95.4) | <.001 |
| N (Col %) | Yes | 1795 (5.17) | 2329 (4.6) | ||
| Age at diagnosis | N | 35116 | 51297 | .341 | |
| Mean | 55.83 | 55.79 | |||
| Median | 57 | 57 | |||
| Tumor size (cm) | N | 33071 | 48181 | .007 | |
| Mean | 4.71 | 4.63 | |||
| Median | 4.2 | 4.1 | |||
The parametric P-value is calculated by ANOVA for numerical covariates and chi-square test for categorical covariates.
Overall Survival Analysis Based on Medicaid Expansion Status in State of Residence
Figure 2 shows overall 5-year survival rate in Medicaid expansion states was higher than non-expansion states (79.1 vs 77.3%; P < .001). Figure 3 also shows overall survival rates across Medicaid expansion timing demonstrating early Medicaid expansion states had a 5-year survival rate (80.2%) greater than January 2014 expansion states (79.3%), late expansion states (77.4%), and non-expansion states (77.3%; P < .0001).
Figure 2.
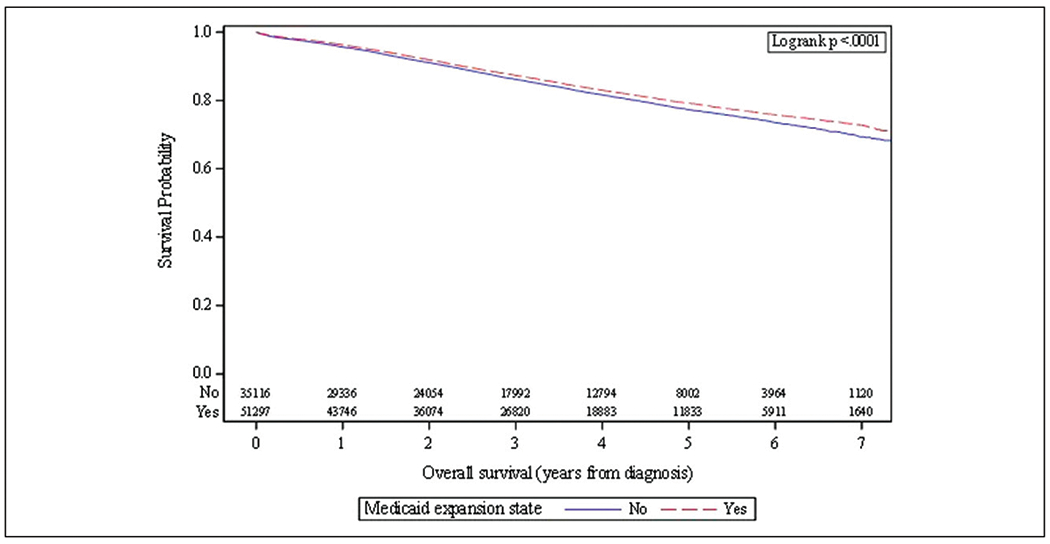
Unadjusted Kaplan-Meier curve of overall survival of colon cancer patients by resident state’s Medicaid expansion status. Blue solid line = non-expansion state and red dotted line = Medicaid expansion state.
Figure 3.
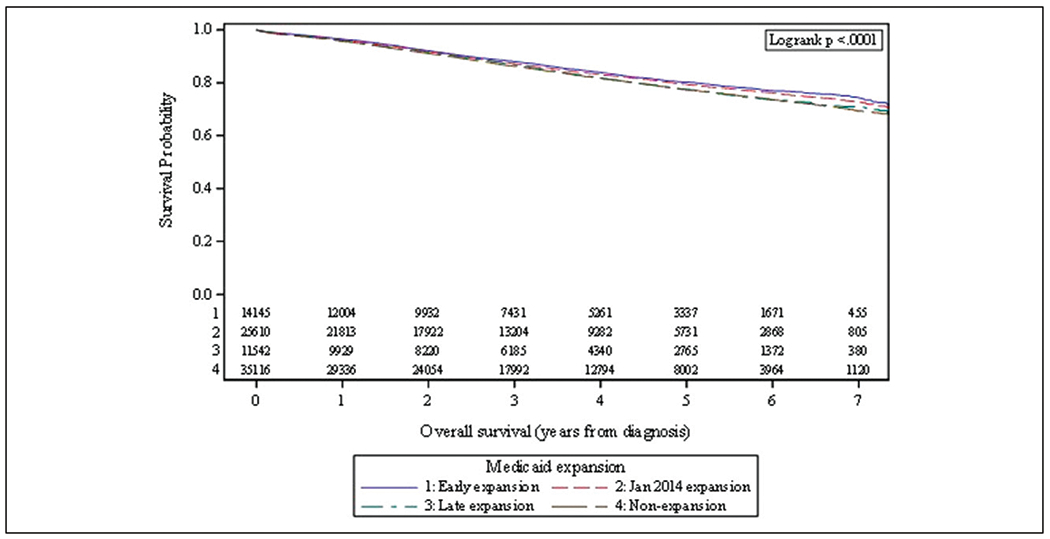
Unadjusted Kaplan-Meier curve of overall survival of colon cancer patients by resident state’s time of Medicaid expansion. Blue solid line = early expansion state, red dotted line = January 2014 expansion state, green dashed line = late expansion state, and gray dashed line = non-expansion state.
When insurance status was compared, uninsured patients did not have a demonstrable survival difference in 5-year survival rate between MES vs non-expansion states (72.1% vs 71.1%; P = .30), but patients with government insurance and private insurance had higher rates of survival in MES (70.0% vs 67.7%; P < .001; 83.3% vs 82.3%; P < .001). Medicaid expansion states also had significantly lower 30-day and 90-day mortality rates (.87%%vs .97%; P = .021; 1.5% and 1.75%; P < .001), as well as lower rates of unplanned hospital readmissions (4.6% vs 5.2%; P < .001).
When examining survival rates by pathological stage, patients with clinical stage I and II in expansion states had a significantly higher overall survival rate in Medicaid expansion states (86.7% vs 84.8%; P < .001) as well as Stage III (69.0% vs 67.4%; P = .005). When we examined the timeliness of treatment, those with clinical stage I/II disease in MES had a statistically significant, but clinically non-significant, greater time from diagnosis to surgery than in NES (17.3 days vs 15.6 days; P < .001). For Stage III disease, there was a significant difference in time to surgical procedure (17.3 days vs 15.7 days; P < .001) and time to chemotherapy (65.9 days vs 63.3 days; P < .001), although these time differences are unlikely to be clinically meaningful.
Univariate and Multivariable Analysis
With univariate analysis, expansion states had better survival compared to non-expansion states (hazard ratio (HR), .91; 95% CI, .88-.94) with the best survival noted in early expansion states vs non-expansion states (HR, .85; 95% CI, .81-.90) as seen in Table 2. Characteristics associated with decreased survival included male sex (HR, 1.27, 95% CI, 1.23-1.32), black race vs white race (HR, 1.28, 95% CI, 1.23-1.34), government insurance vs not insured (HR, 1.14, 95% CI, 1.08-1.22), residing more than 50 miles from treatment vs less than 10 miles (HR, 1.09, 95% CI, 1.02-1.16), lowest median household income quartile vs highest quartile (HR 1.64, 95% CI, 1.57-1.72), highest quartile of percentage of no high school graduates vs lowest quartile (HR 1.59, 95% CI, 1.51-1.68), and unplanned readmission (HR 1.61, 95% CI, 1.51-1.72). Notably, private insurance was significantly associated with improved survival compared to being uninsured (HR, .55, 95% CI, .52-.59).
Table 2.
Univariate Analysis of Overall Survival of NCDB Nonmetastatic Colon Cancer Patients diagnosed 2010-2015 in the NCDB.
| Overall Survival (years from diagnosis) |
|||||
|---|---|---|---|---|---|
| Covariate | Level | N | Hazard ratio (95% CI) | HR P-value | Log-rank P-value |
| Medicaid expansion state | Yes | 51297 | .91 (.88-.94) | <.001 | <.001 |
| No | 35116 | — | — | ||
| Medicaid expansion | Early expansion | 14145 | .85 (.81-.90) | <.001 | <.001 |
| Jan 2014 expansion | 25610 | .90 (.87-.94) | <.001 | ||
| Late expansion | 11542 | .98 (.93-1.03) | .431 | ||
| Non-expansion | 35116 | — | — | ||
| Facility location | Northeast | 16545 | 1.01 (.95-1.07) | .776 | <.001 |
| South | 35899 | 1.21 (1.15-1.28) | <.001 | ||
| Midwest | 21042 | 1.15 (1.08-1.21) | <.001 | ||
| West | 12927 | — | — | ||
| Facility type | Community cancer program | 9945 | 1.14 (1.07-1.22) | <.001 | <.001 |
| Comprehensive community cancer program | 37501 | 1.08 (1.03-1.14) | .004 | ||
| Academic/research program | 26344 | 1.01 (.96-1.07) | .718 | ||
| Integrated network cancer program | 12623 | — | — | ||
| Year of diagnosis | 2015 | 15606 | 1.11 (1.04-1.20) | .004 | <.001 |
| 2014 | 15335 | 1.18 (1.11-1.26) | <.001 | ||
| 2013 | 14620 | 1.12 (1.05-1.18) | <.001 | ||
| 2012 | 14191 | 1.10 (1.04-1.16) | <.001 | ||
| 2011 | 13658 | 1.01 (.96-1.06) | .794 | ||
| 2010 | 13003 | — | — | ||
| Race | Other | 2113 | .82 (.72-.93) | .002 | <.001 |
| Asian | 3147 | .75 (.67-.83) | <.001 | ||
| Black | 14429 | 1.28 (1.23-1.34) | <.001 | ||
| White | 66724 | — | — | ||
| Sex | Male | 46020 | 1.27 (1.23-1.32) | <.001 | <.001 |
| Female | 40393 | — | — | ||
| Insurance status | Government | 22436 | 1.14 (1.08-1.22) | <.001 | <.001 |
| Private | 56418 | .55 (.52-.59) | <.001 | ||
| Not insured | 6122 | — | — | ||
| Clinical stage group | 3 | 8457 | 2.62 (2.45-2.80) | <.001 | <.001 |
| 2 | 10791 | 1.56 (1.45-1.68) | <.001 | ||
| 1 | 14776 | — | — | ||
| Pathologic stage group | 3 | 36285 | 3.79 (3.59-4.01) | <.001 | <.001 |
| 2 | 28621 | 1.91 (1.80-2.04) | <.001 | ||
| 1 | 21507 | — | — | ||
| Great circle distance | >50 miles | 6555 | 1.09 (1.02-1.16) | .009 | <.001 |
| 10-50 miles | 32619 | .95 (.92-.99) | .010 | ||
| ≤10 miles | 47131 | — | — | ||
| Median income quartiles 2008-2012 | < $38000 | 16900 | 1.64 (1.57-1.72) | <.001 | <.001 |
| $38000-$47,999 | 19852 | 1.43 (1.36-1.50) | <.001 | ||
| $48000-$62,999 | 22436 | 1.29 (1.23-1.35) | <.001 | ||
| ≥$63000 | 27030 | — | — | ||
| Percent No high school degree 2008-2012 | ≥21.0% | 17395 | 1.59 (1.51-1.68) | <.001 | <.001 |
| 13.0-20.9% | 23371 | 1.54 (1.46-1.62) | <.001 | ||
| 7.0-12.9% | 26659 | 1.31 (1.24-1.38) | <.001 | ||
| <7.0% | 18852 | — | — | ||
| Chemotherapy | Yes | 40150 | 1.54 (1.49-1.59) | <.001 | <.001 |
| No | 43443 | — | — | ||
| Unplanned hospital readmission within 30 days | Yes | 4124 | 1.61 (1.51-1.72) | <.001 | <.001 |
| No | 81278 | — | — | ||
| Age at diagnosis | 86413 | 1.02 (1.02-1.03) | <.001 | — | |
| Tumor size (cm) | 81252 | 1.03 (1.02-1.03) | <.001 | — | |
However, as seen in Table 3, a multivariable analysis (MVA), adjusted for year of diagnosis, pathologic stage, median income, percentage of non-high school graduates, insurance status, race, facility type, great circle distance, and age, did not demonstrate a significant difference in OS from MES to NES (HR, .99, 95% CI, .95-1.03; P = .57). This finding also remained among Stage I/II disease (HR, .97, 95% CI, .92-1.03; P = .36) and Stage III disease (HR, 1.00, 95% CI, .96-1.05). Additionally, an MVA with a 4-level Medicaid expansion variable did not demonstrate a difference in overall survival (early vs non-expansion HR, .98, 95% CI, .93-1.03; January 2014 vs non-expansion HR, .97, 95% CI, .93-1.01; late vs non-expansion HR, 1.04, 95% CI, .98-1.09).
Table 3.
Multivariable Analysis of Overall Survival of Nonmetastatic Colon Cancer Patients Diagnosed 2010-2015 in the NCDB.
| Overall Survival (years from diagnosis) |
|||
|---|---|---|---|
| Covariate | Level | Hazard ratio (95% CI) | HR P-value |
| Medicaid expansion state | Yes | .99 (.95-1.03) | .570 |
| No | — | — | |
| Pathologic stage group | 3 | 3.80 (3.59-4.02) | <.001 |
| 2 | 1.85 (1.74-1.97) | <.001 | |
| 1 | — | — | |
| Median income quartiles 2008-2012 | < $38 000 | 1.21 (1.13-1.29) | <.001 |
| $38 000-$47,999 | 1.12 (1.06-1.19) | <.001 | |
| $48 000-$62,999 | 1.11 (1.05-1.17) | <.001 | |
| ≥$63 000 | — | — | |
| Percent No high school degree 2008-2012 | ≥21.0% | 1.13 (1.05-1.21) | .001 |
| 13.0-20.9% | 1.21 (1.13-1.29) | <.001 | |
| 7.0-12.9% | 1.15 (1.09-1.22) | <.001 | |
| <7.0% | — | — | |
| Year of diagnosis | 2015 | 1.10 (1.02-1.18) | .013 |
| 2014 | 1.15 (1.08-1.22) | <.001 | |
| 2013 | 1.09 (1.02-1.15) | .006 | |
| 2012 | 1.08 (1.02-1.14) | .009 | |
| 2011 | .99 (.94-1.05) | .746 | |
| 2010 | — | — | |
| Insurance status | Government | 1.15 (1.08-1.22) | <.001 |
| Private | .62 (.58-.66) | <.001 | |
| Not insured | — | — | |
| Race | Other | .82 (.72-.93) | .002 |
| Asian | .72 (.65-.80) | <.001 | |
| Black | 1.10 (1.05-1.15) | <.001 | |
| White | — | — | |
| Facility type | Community cancer program | 1.06 (.99-1.13) | .112 |
| Comprehensive community cancer program | 1.08 (1.02-1.14) | .005 | |
| Academic/research program | .98 (.93-1.04) | .564 | |
| Integrated network cancer program | — | — | |
| Great circle distance | >50 miles | 1.04 (.98-1.12) | .202 |
| 10-50 miles | .98 (.94-1.01) | .206 | |
| ≤10 miles | — | — | |
| Age at diagnosis | 1.02 (1.02-1.02) | <.001 | |
Number of observations in the original data set = 86 413. Number of observations used = 84 775.
Propensity Score Analysis
We performed a propensity score analysis with a total of 59 702 patients (29 851 pairs) matched 1:1 between the Medicaid expansion and non-expansion groups. Supplemental Tables 1–4 in the Supplement presents the results of the balance checks for our propensity score-matching analyses. Medicaid expansion states did not have better overall survival than non-expansion states when examined for all stages of disease together (HR, .99; 95% CI, .95-1.03) with similar findings for Stage I/II (HR, .95, 95% CI, .89-1.01; P = .11) and Stage III disease (HR, .99, 95% CI, .94-1.04; P = .78). In a 4-level Medicaid expansion analysis, for early and January 2014 expansion there was no significant difference in overall survival compared to NES (early HR, .98, 95% CI, .91-1.06; P = .64; January 2014 HR, 1.02, 95% CI, .94-1.10; P = .64), although late expansion states had a significantly increased hazard of death (HR, 1.10, 95% CI, 1.02-1.19; P = .02). Additionally, an interaction model, see Supplemental Table 5, was fit indicating that the relationship between insurance status and overall survival did not depend on expansion status (P = .343).
Discussion
Medicaid expansion has significantly reduced the number of uninsured colon cancer patients in MES compared to NES and led to earlier stage diagnoses; however, our findings indicate that Medicaid expansion has yet to demonstrate a survival benefit in multivariable and propensity-matched analyses among nonmetastatic, surgically resected nonelderly colon cancer patients included in the NCDB. To our knowledge, this is one of the first studies to examine Medicaid expansion’s association with overall survival among colorectal cancer patients included in the NCDB. Our findings align with the recent cancer-specific findings of Lam et al which did not find a significant difference-in-difference between hazard of death in MES and NES pre- and post-ME among colon cancer patients in the NCDB.
In-keeping with existing literature, we found a higher rate of uninsured patients in NES compared to MES.18–20 Access to insurance is associated with improved outcomes for colon cancer patients,4,21,22 and a recent article by Hoehn et al demonstrated that Medicaid expansion was associated with fewer urgent cases and more minimally invasive surgeries for colon cancer patients.18 Our findings also provide further evidence of earlier stage diagnosis of colon cancer in MES compared to NES. These results add to the findings of Jemal et al and others.11,12,23 While earlier stage colon cancer diagnoses are associated with improved survival, our study failed to find a significant difference in overall survival between MES and NES, after adjustment for relevant covariates.24 This may be due to the high survival rate of colon cancer, the limited time course of our study, and the younger age of our study population. It is possible that our study is unable to fully capture benefits offered by improved colorectal cancer screening rates in MES since estimates put the time to benefit from colon cancer screening at nearly 10 years.25,26 Additionally, programs such as the Colorectal Cancer Control Program that provide access to screening for low-income patients (including in NES) may diminish the effect of Medicaid expansion’s impact on patients’ access to CRC screening.27
A reassuring finding of our study was the clinically non-meaningful time to treatment (although statistically significant) between MES and NES since a major concern at the time of Medicaid expansion was that an influx of patients would lead to detrimental delays in care. This suggests that an increase in insured patients did not lead to excessive wait times for nonmetastatic colon cancer patients in MES. This may be particularly relevant as an enrollment in Medicaid grew by 15.0% from February 2020 to February 2021 during the SARS-CoV-2 pandemic.28 In addition, Medicaid’s coverage of adults under 65 years of age will be particularly important with the recent USPTF guidelines recommending colorectal cancer screening begin at age 45 years for average risk adults.29
This study has numerous limitations. It is an observational study making it unable to determine the causality of the relationship between Medicaid expansion and colon cancer survival. In addition, the NCDB utilizes overall survival, not cancer-specific survival, which is of greater relevance among our younger cohort. The NCDB is a hospital registry and not a population-based sample, although prior studies have indicated the NCDB has relatively high case coverage.30,31 Importantly, the very large sample size of the NCDB can lead to overpowering so that certain findings may be statistically significant, but not clinically meaningful.
Medicaid expansion has been associated with earlier stage colon cancer diagnoses in MES compared to NES, but its impact on patient survival is not known. Our findings suggest that Medicaid expansion is not yet associated with improved overall survival in adjusted analyses of nonmetastatic colon cancer patients included in the NCDB. It is critical that future assessments of ME continue to better understand the impact of this critical legislation on health outcomes. Research on other important patient cancer outcomes, such as receipt of guideline concordant care, can help further inform policy related to Medicaid expansion.
Supplementary Material
Key Take-Aways.
Among NCDB patients with invasive, nonmetastatic colon cancer residing in Medicaid expansion states at time of diagnosis was associated with earlier pathological stage.
In a multivariable analysis and propensity-matched analysis, overall survival for nonmetastatic colon cancer patients was not significantly different in Medicaid expansion states compared to non-expansion states.
Funding
Research reported in this publication was supported in part by the Biostatistics and Bioinformatics Shared Resource of Winship Cancer Institute of Emory University and NIH/NCI under award number P30CA138292.
Footnotes
Declaration of Conflicting Interests
The author(s) declared no potential conflicts of interest with respect to the research, authorship, and/or publication of this article.
Informed Consent
The content is solely the responsibility of the authors and does not necessarily represent the official views of the National Institutes of Health.
Supplemental Material
Supplemental material for this article is available online.
Data Availability
The data used in the study are derived from a de-identified NCDB file. The American College of Surgeons and the Commission on Cancer have not verified and are not responsible for the analytic or statistical methodology employed, or the conclusions drawn from these data by the investigator.
References
- 1.Siegel RL, Jemal A, Wender RC, Gansler T, Ma J, Brawley OW. An assessment of progress in cancer control. CA Cancer J Clin. 2018;68(5):329–339. [DOI] [PubMed] [Google Scholar]
- 2.Sauer AG, Siegel RL, Jemal A, Fedewa SA. Updated review of prevalence of major risk factors and use of screening tests for cancer in the United States. Cancer Epidemiol Biomark Prev. 2017;26(8):1192–1208. [DOI] [PubMed] [Google Scholar]
- 3.Siegel RL, Miller KD, Jemal A. Cancer statistics, 2016. CA Cancer J Clin. 2019;66(1):7–30. [DOI] [PubMed] [Google Scholar]
- 4.Ahmed A, Tahseen A, England E, et al. Association between primary payer status and survival in patients with stage iii colon cancer: an national cancer database analysis. Clin Colorectal Canc. 2019;18(1):e1–e7. [DOI] [PubMed] [Google Scholar]
- 5.Finegold KCA, Chu RC, Bosworth A, Sommers BD. Trends in the U.S. Uninsured Population, 2010-2020. In: Services. USDoHaH. Washington, DC: Office of the Assistant Secretary for Planning and Evaluation; 2021. [Google Scholar]
- 6.Tolbert J, Orgera K, Singer N, Damico A. Key Facts about the Uninsured Population. San Francisco, CAHenry J Kaiser Family Foundation. Published December 13, 2019. https://www.kff.org/uninsured/issue-brief/key-facts-about-the-uninsured-population/. Accessed May 5, 2020. [Google Scholar]
- 7.Garfield R, Orgera K, Damico A. The Coverage Gap: Uninsured Poor Adults in States that Do Not Expand Medicaid. San Francisco, CA: KFF; 2021. [Google Scholar]
- 8.Zerhouni YA, Trinh QD, Lipsitz S, et al. Effect of medicaid expansion on colorectal cancer screening rates. Dis Colon Rectum. 2019;62(1):97–103. [DOI] [PubMed] [Google Scholar]
- 9.Hendryx M, Luo J. Increased cancer screening for low-income adults under the affordable care act medicaid expansion. Med Care. 2018;56(11):944–949. [DOI] [PubMed] [Google Scholar]
- 10.Fedewa SA, Yabroff KR, Smith RA, Goding Sauer A, Han X, Jemal A. Changes in breast and colorectal cancer screening after medicaid expansion under the affordable care act. Am J Prev Med. 2019;57(1):3–12. [DOI] [PubMed] [Google Scholar]
- 11.Takvorian SU, Oganisian A, Mamtani R, et al. Association of medicaid expansion under the affordable care act with insurance status, cancer stage, and timely treatment among patients with breast, colon, and lung cancer. JAMA Netw Open. 2020;3(2):e1921653. [DOI] [PMC free article] [PubMed] [Google Scholar]
- 12.Jemal A, Lin CC, Davidoff AJ, Han X. Changes in insurance coverage and stage at diagnosis among nonelderly patients with cancer after the affordable care act. J Clin Oncol. 2017;35(35):3906–3915. [DOI] [PubMed] [Google Scholar]
- 13.Gan T, Sinner HF, Walling SC, et al. Impact of the affordable care act on colorectal cancer screening, incidence, and survival in Kentucky. J Am Coll Surg. 2019;228(4): 342–e1. [DOI] [PMC free article] [PubMed] [Google Scholar]
- 14.Hari DM, Leung AM, Lee JH, et al. AJCC cancer staging manual 7th edition criteria for colon cancer: do the complex modifications improve prognostic assessment? J Am Coll Surg. 2013;217(2):181–190. [DOI] [PMC free article] [PubMed] [Google Scholar]
- 15.Austin PC, Grootendorst P, Anderson GM. A comparison of the ability of different propensity score models to balance measured variables between treated and untreated subjects: a Monte Carlo study. Stat Med. 2007;26(4):734–753. [DOI] [PubMed] [Google Scholar]
- 16.Lin DY, Wei LJ. The robust inference for the cox proportional hazards model. J Am Stat Assoc. 1989;84(408): 1074–1078. [Google Scholar]
- 17.Austin PC. Assessing the performance of the generalized propensity score for estimating the effect of quantitative or continuous exposures on binary outcomes. Stat Med. 2018;37(11):1874–1894. [DOI] [PMC free article] [PubMed] [Google Scholar]
- 18.Hoehn RS, Rieser CJ, Phelos H, et al. Association between medicaid expansion and diagnosis and management of colon cancer. J Am Coll Surg. 2021;232(2):e141–e146. [DOI] [PMC free article] [PubMed] [Google Scholar]
- 19.Barnes JM, Srivastava AJ, Gabani P, Perkins SM. Associations of early medicaid expansion with insurance status and stage at diagnosis among cancer patients receiving radiation therapy. Pract Radiat Oncol. 2019. [DOI] [PubMed] [Google Scholar]
- 20.Han X, Yabroff KR, Ward E, Brawley OW, Jemal A. Comparison of insurance status and diagnosis stage among patients with newly diagnosed cancer before vs after implementation of the patient protection and affordable care act. JAMA Oncol. 2018;4(12):1713–1720. [DOI] [PMC free article] [PubMed] [Google Scholar]
- 21.Halpern MT, Pavluck AL, Ko CY, Ward EM. Factors associated with colon cancer stage at diagnosis. Dig Dis Sci. 2009;54(12):2680–2693. [DOI] [PubMed] [Google Scholar]
- 22.Robbins AS, Pavluck AL, Fedewa SA, Chen AY, Ward EM. Insurance status, comorbidity level, and survival among colorectal cancer patients age 18 to 64 years in the National Cancer Data Base from 2003 to 2005. J Clin Oncol. 2009;27(22):3627–3633. [DOI] [PubMed] [Google Scholar]
- 23.Soni A, Simon K, Cawley J, Sabik L. Effect of medicaid expansions of 2014 on overall and early-stage cancer diagnoses. Am J Publ Health. 2018;108(2):216–218. [DOI] [PMC free article] [PubMed] [Google Scholar]
- 24.Siegel RL, Miller KD, Goding Sauer A, et al. Colorectal cancer statistics, 2020. CA Cancer J Clin. 2020;70(3):145–164. [DOI] [PubMed] [Google Scholar]
- 25.Tang V, Boscardin WJ, Stijacic-Cenzer I, Lee SJ. Time to benefit for colorectal cancer screening: survival metaanalysis of flexible sigmoidoscopy trials. BMJ. 2015;350:h1662. [DOI] [PMC free article] [PubMed] [Google Scholar]
- 26.Lee SJ, Boscardin WJ, Stijacic-Cenzer I, Conell-Price J, O’Brien S, Walter LC. Time lag to benefit after screening for breast and colorectal cancer: meta-analysis of survival data from the United States, Sweden, United Kingdom, and Denmark. BMJ. 2013;346:e8441. [DOI] [PMC free article] [PubMed] [Google Scholar]
- 27.DeGroff A, Sharma K, Satsangi A, et al. Increasing Colorectal Cancer Screening in Health Care Systems Using Evidence-Based Interventions. Prev Chronic Dis. 2018;15:E100. [DOI] [PMC free article] [PubMed] [Google Scholar]
- 28.Corallo B, Rudowitz R. Analysis of recent national trends in medicaid and CHIP enrollment. January;20:2021. [Google Scholar]
- 29.USPST Force Davidson KW, Barry MJ, et al. Screening for colorectal cancer: US preventive services task force recommendation statement. J Am Med Assoc. 2021;325(19):1965–1977. [DOI] [PubMed] [Google Scholar]
- 30.Mallin K, Browner A, Palis B, et al. Incident cases captured in the national cancer database compared with those in U.S. population based central cancer registries in 2012-2014. Ann Surg Oncol. 2019;26(6):1604–1612. [DOI] [PubMed] [Google Scholar]
- 31.Lerro CC, Robbins AS, Phillips JL, Stewart AK. Comparison of cases captured in the national cancer data base with those in population-based central cancer registries. Ann Surg Oncol. 2013;20(6):1759–1765. [DOI] [PubMed] [Google Scholar]
Associated Data
This section collects any data citations, data availability statements, or supplementary materials included in this article.
Supplementary Materials
Data Availability Statement
The data used in the study are derived from a de-identified NCDB file. The American College of Surgeons and the Commission on Cancer have not verified and are not responsible for the analytic or statistical methodology employed, or the conclusions drawn from these data by the investigator.