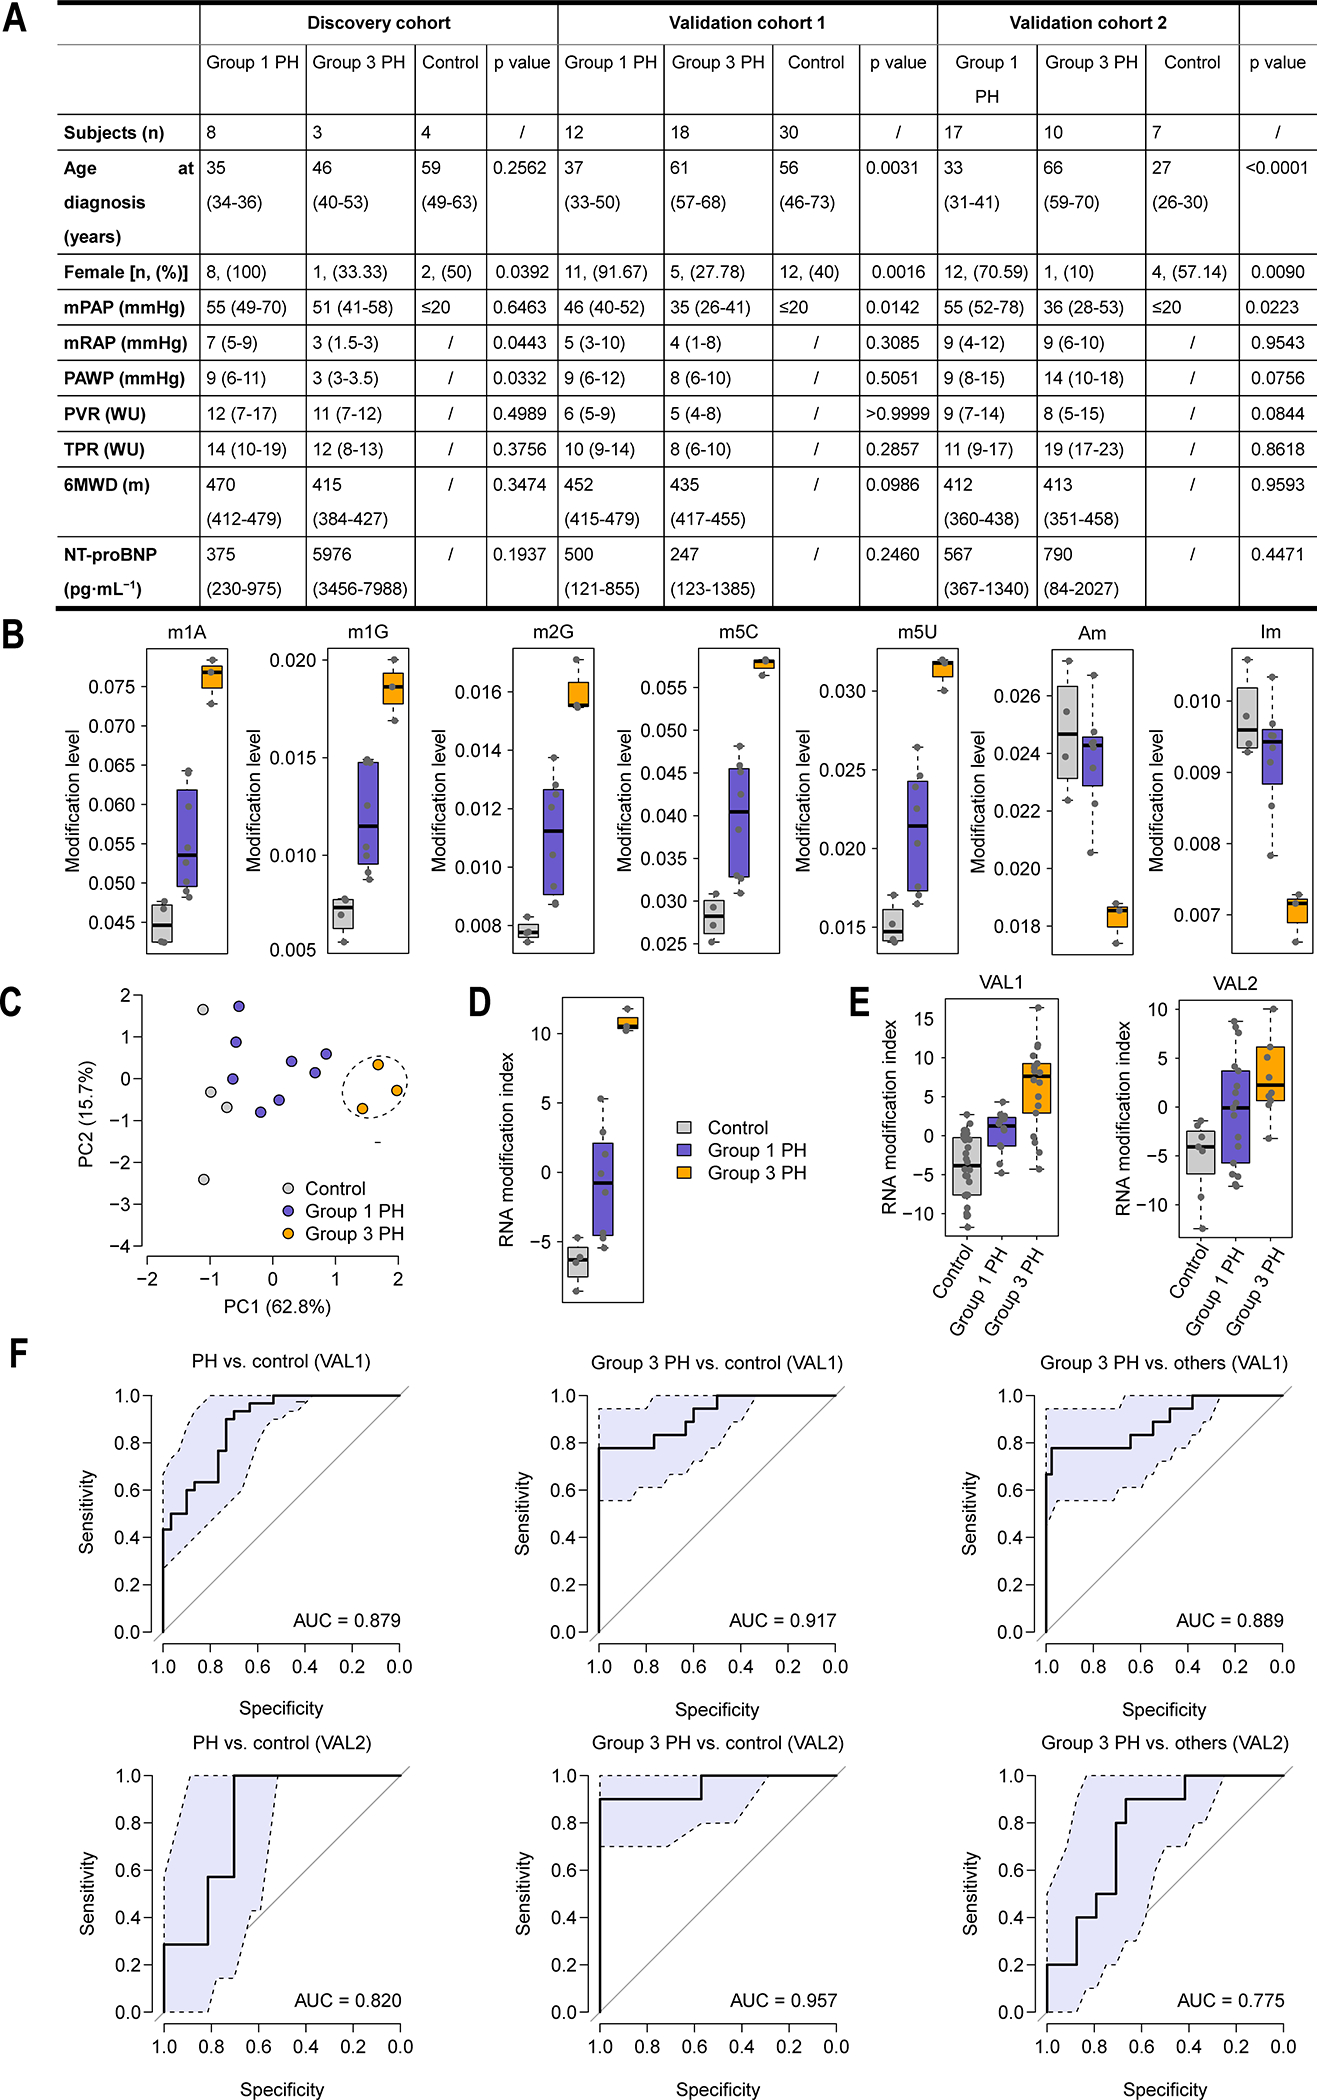
Figure 1. The performance of the RNA modification signature in discovery and validation cohorts.

(A) Patient characteristics of the discovery and validation cohorts. Values are expressed as n, median (interquartile range) or n (%), unless otherwise stated. mPAP mmHg: Mean pulmonary arterial pressure mmHg; mRAP mmHg: Mean right atrial pressure mmHg; PAWP mmHg: Pulmonary arterial wedge pressure mmHg; PVR wood: Pulmonary vascular resistance Wood units; TPR wood: Total pulmonary resistance Wood units; 6MWD: 6-min walk distance; NT-pro BNP: N-terminal pro-brain natriuretic peptide. The t-test was performed for statistical analysis, except age at diagnosis were analyzed by ANOVA test and Chi-Squared test was used for gender comparison. (B) Principal component analysis on the RNA modification data. PC1: the first principal component; PC2: the second principal component. Each dot represents one human subject in the discovery cohort. (C) The RNA modification signature. (D) Comparison of the RNA modification index among the control, Group 1 PH, and Group 3 PH subjects in the discovery cohort. Mean ± standard deviation: −6.48±1.60 for control, −0.83±3.90 for Group 1 PH, and 10.84±0.84 for Group 3 PH. (E) Comparison of the RNA modification index among the control, Group 1 PH, and Group 3 PH subjects in two validation cohorts. Mean ± standard deviation: −3.90±4.16 for control, 0.48±2.72 for Group 1 PH, and 6.19±5.41 for Group 3 PH in VAL1 and −5.22±4.09 for control, −0.43±5.71 for Group 1 PH, and 4.39±6.41 for Group 3 PH in VAL2. (F) The ROC curve of the RNA modification index in distinguishing between the PH and control subjects, between the Group 3 PH and control subjects, and between the Group 3 PH patients and other subjects (controls and Group 1 subjects) in the validation cohorts. The light blue area indicates the confidence interval of the ROC curve. VAL1: the first validation cohort; VAL2: the second validation cohort.
