Abstract
Upconverting (UC) phosphors (UCPs) are ceramic materials doped with rare earth ions. These materials can absorb and upconvert infrared (IR) radiation to emit visible light by the stepwise excitation among discrete energy levels of the rare earth ions. UCPs are potentially useful reagents for use in bioimaging since the use of low energy photons avoids photo-toxicity. The use of UCP nanoparticles as bioimaging probes requires surface modifications in an effort to improve dispersion stability in aqueous milieu. In this study, we covalently attached poly(ethylene glycol) (PEG) to the surface of Er-doped Y2O3 nanoparticles and firstly demonstrated that PEG covalently bound to the Y2O3 surface markedly improved dispersion stability in water. UC emission of PEG-modified Er–Y2O3 nanoparticles excited with IR light was successfully observed. We also showed that PEG-modified Er–Y2O3 nanoparticles exhibit no cell-toxicity. These observations lend strong support to the potential use of PEG-modified UCP nanoparticles as bioimaging tools.
Keywords: Y2O3, Dispersion Stability, Yttrium Oxide, Upconversion Emission, Discrete Energy Level
Introduction
Bioimaging is a technique that can be employed to assist in the visualization of biological phenomena both in vivo and in vitro, and represents one of the key technologies in the field of biomedical research. Fluorescence microscopic observation of tissues has received particular attention as an essential tool in the areas of medical prevention, diagnosis and cure through the investigation of biological phenomena. However, current imaging methodologies utilizing organic dyes or fluorescent proteins as probes remain problematic. The period during which observations are made is limited due to the bleaching of fluorescent probes [1]. Their use in biological tissues is also restricted due to limited light penetration depth associated with strong scattering of the excitation light of short wavelength [2]. Furthermore, short wavelength excitation with high quantum energy results in tissue photo-toxicity. Although the use of quantum dots might solve the first problem [3], the latter two concerns remain outstanding even with the usage of quantum dots [4].
Fluorescence imaging utilizing near-infrared (NIR) excitation is expected to have a major impact on biomedical imaging since the NIR (800–1,500 nm) is located within the so-called biological window, where the absorption of light is comparably lower than that in other wavelength regions [5, 6]. Another advantage is that infrared (IR) light penetrates deeper into tissues given its lower scattering nature resulting from its longer wavelength.
Recently, upconverting (UC) phosphors (UCPs) have been used for bioimaging [7–10]. UC phosphors are ceramic materials in which rare earth ions are embedded in an inorganic host. The materials can absorb IR radiation and upconvert it to emit visible light by the stepwise excitation among discrete energy levels of the rare earth ions [11]. For example, yttrium oxide (Y2O3) works as a good host matrix for several atomic % of erbium (Er2O3), which is known to show upconversion emission at 550 nm (green) and 660 nm (red) following excitation at 980 nm [12, 13].
In order to fabricate UC bioimaging probes emitting visible light following NIR excitation, it is important to prevent aggregation of UCP molecules in aqueous solutions. To this end, surface modification using biocompatible polymers, such as poly(ethylene glycol) (PEG) would be useful, since PEG has been successfully used to improve the dispersion stability of small particles. Examples include improvements in the dispersion stability of gold nanoparticles and cellulose microcrystals by steric repulsion effects of the tethered PEG strands [14–16]. Previously, we reported on the PEG-based surface modification of Er-doped Y2O3 (Er–Y2O3) nanoparticles using electrostatic interactions [17, 18]. In this study, we covalently attached PEG to the surface of Er–Y2O3 nanoparticles and demonstrated that PEG modification drastically improved dispersion stability in aqueous milieu. The PEG-modified Er–Y2O3 nanoparticles were demonstrated to show upconversion emission. We also examined the cell toxicity associated with the use of PEG-modified Er–Y2O3 nanoparticles in an effort to assess the potential use of these particles as bioimaging probes.
Materials and methods
Preparation of UCP nanoparticles
Yttrium oxide (Y2O3) nanoparticles with size range from 30 to 60 nm were synthesized using an enzymatic decomposition method as follows. Forty mmol/L Y(NO3)3 (99.99% purity of Y(NO3)3 · 6H2O, Kanto Chemicals, Tokyo, Japan) and 4 mmol/L Er(NO3)3 (>99% purity of Er(NO3)3 · 5H2O, Kojundo Chemical Laboratory, Saitama, Japan) were dissolved in a solution containing 400 mmol/L Urea (99.0% purity, Kanto Chemicals), to make the nominal molar ratio of Y:Er to be 90:10. After addition of 62.5 nmol/L urease (Wako, Osaka, Japan), the solution was stirred at 25 °C for 1 h. The YCO3(OH) precursors were precipitated by decomposition of the urea into precipitants, carbonic acid and ammonia. Several centrifugal washes of the precursors were then performed using distilled water. The Er–Y2O3 nanoparticles were generated by calcinating the hydroxycarbonate precursors at 900 °C for 1 h.
The surface of the Er–Y2O3 nanoparticles was modified using 3-aminopropyltrimethoxysilane (APTES) and PEG as illustrated in Fig. 1. The Er–Y2O3 nanoparticles (50 mg) were suspended in 45 mL of propanol and subjected to ultrasonication. After 300 μL of APTES was added, the mixture was stirred for 24 h at 70 °C. Particles were then isolated, washed five times with ethanol by centrifugation, and finally dried in air at room temperature.
Fig. 1.
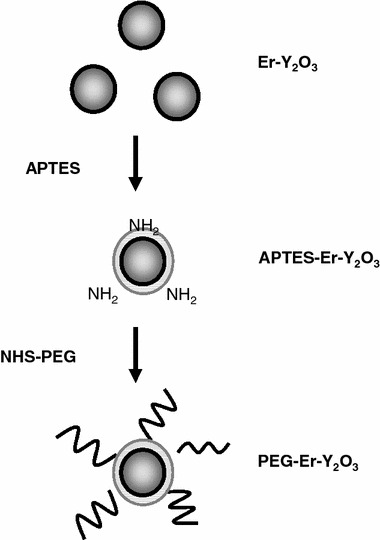
Schematic illustration outlining the preparation of PEG-modified Er-doped Y2O3 nanoparticles
The APTES-modified Er–Y2O3 (APTES–Er–Y2O3) nanoparticles (20 mg) were suspended in 10 mL of dry- N,N-dimethylformamide (DMF, Junsei Chemical, Tokyo, Japan), to which was added N-Hydroxysuccinimide-PEG (NHS-PEG) (MW = 5000, Sunbright MEPA-50H, NOF Corp., Tokyo, Japan) at different concentrations (1.0 ng/mL or 30 μg/mL) and stirred for 24 h at room temperature. The particles were isolated, washed five times with distilled water by centrifugation, and dried in air at room temperature.
Characterization of PEG-modified UPC nanoparticles
SEM observations were employed using a HITACHI FE-SEM S-4200 (Tokyo, Japan) instrument operated with an acceleration voltage of 10.0 keV and a working distance of 15 mm. PEG-modified APTES-Er–Y2O3 (PEG–Er–Y2O3) nanoparticle suspension was placed onto a silicon wafer and dried at room temperature. The observation magnification was 60,000×.
FT-IR spectra of the PEG–Er–Y2O3 nanoparticles were recorded on a FTIR spectrometer (FTIR-6200, Jasco, Tokyo, Japan) with a resolution of 4 cm−1 and 100 times accumulation using the KBr pellet method. Er–Y2O3 and APTES–Er–Y2O3 nanoparticle spectra were also measured for comparisons.
Thermogravimetric analyses (TGA) were carried out using a SHIMADZU DTG-60 (Kyoto, Japan) instrument at a heating rate of 10 °C/min in dry air for the PEG-Er–Y2O3 nanoparticles (2 mg), which were dried at 150 °C for 10 min in air.
The dispersion stability of the PEG-modified nanoparticles was examined by measuring solution turbidity. PEG–Er–Y2O3 nanoparticles (10 mg) were suspended in 25 mL of distilled water or Tris buffer (10 mM Tris–HCl, pH 7.4, 100 mM NaCl) and then subjected to ultrasonication for 1 min. The turbidity was monitored at 500 nm using a UV spectrometer (Cary, Varian, NC, USA).
UC emission spectra were obtained using the SHIMADZU RF-5000 fluorescence spectrometer upon excitation of 980 nm laser diode (800 mA, 980 nm, L9418-04, Hamamatsu Photonics, Shizuoka, Japan).
Imaging of the PEG–Er–Y2O3 nanoparticles by detecting the UC emission under IR excitation was performed using an inverted microscopy system (IX71, Olympus, Tokyo, Japan). The UCP nanoparticles were illuminated with a continuous-wave laser diode (1,200 mA, 980 nm). The UC emission between 660 and 740 nm was collected with 40× microscope object lens (UPlanFLN, Olympus) through a bandpass emission filter (HQ700/75, Chroma Technology, VT, USA). Images were taken using a CCD camera (MC681SPD-R0B0, Texas Instruments, TX, USA) coupled to an image intensifier (C8600-05, Hamamatsu Photonics).
The cell toxicity associated with the use of PEG–Er–Y2O3 nanoparticles was determined using an MTT Cell Proliferation kit (Roche, Basel, Switzerland) [19], based on the conversion of tetrazolium salt by mitochondrial dehydrogenase to a formazan product that can be spectrophotometrically measured at 550 nm, according to the manufacturer’s instructions. Briefly, PC12 cells (a clonal line of rat pheochromocytoma) were maintained in RPMI1640 medium with 10% horse serum, 5% fetal bovine serum, penicillin (100 units/mL) and streptomycin (100 μg/mL) in 5% CO2 at 37 °C. Cells were plated in 96-well plates at a density of 50,000 cells/well and grown overnight. Cells were then incubated in 100 μL medium in the absence (control) or presence of PEG–Er–Y2O3 nanoparticles for 24 h. Following this, 10 μL of MTT reagents was added to each well and the cells were incubated for 4 h at 37 °C in a 5% CO2 incubator. The reaction was stopped by the addition of 100 μL of 10% SDS in 10 mM HCl. Plates were read at 550 nm using a microplate reader (SPECTRAmax, Molecular Devises, CA, USA). Each data point derived represents an average of three triplet-well assays.
Results and discussion
Figure 2a shows a SEM image of the PEG–Er–Y2O3 nanoparticles. Nonagglomerated nanoparticles were successfully obtained. From a detailed particle size analysis of 200 particles from several SEM micrographs, the average particle size was found to be 44.0 nm with a standard deviation of 16 nm (Fig. 2b).
Fig. 2.
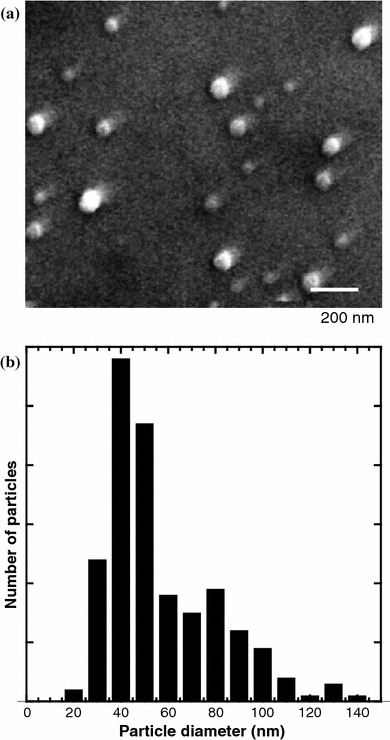
(a) SEM image of PEG–Er–Y2O3 nanoparticles. The scale bar represents 200 nm. (b) Histogram of the particle sizes obtained from SEM images ~200 PEG–Er–Y2O3 nanoparticles
FT-IR spectra of the samples were measured in an effort to confirm that surface modification by APTES and PEG had occurred. Figure 3 shows the FT-IR spectra of (1) Er–Y2O3 nanoparticles, (2) APTES–Er–Y2O3 nanoparticles, and (3 and 4) PEG–Er–Y2O3 nanoparticles (3, 1.0 ng/mL; 4, 30 μg/mL NHS-PEG concentration used for the modification). Spectra of APTES–Er–Y2O3 nanoparticles showed an absorption peak at around 2,900 cm−1, due to disordered alkyl chains in APTES. The absorption at 1,107 cm−1 suggests the presence of a Si–O–Si bond originated from polymerized APTES [20]. The stronger absorption peaks at 1,100 cm−1 in the spectra of the PEG–Er–Y2O3 nanoparticles (3 and 4) were assigned to those of C–O–C bonds in PEG. These data support the notion that the surface of the APTES–Er–Y2O3 nanoparticles were successfully modified with PEG chains [21].
Fig. 3.
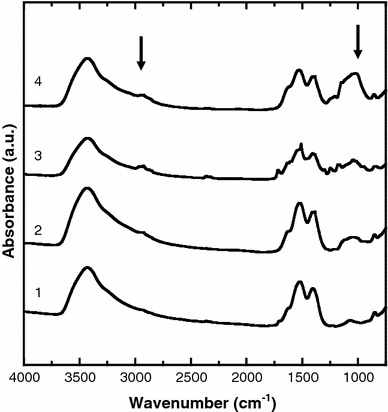
FTIR spectra of (1) Er-Y2O3, (2) APTES–Er–Y2O3, (3 and 4) PEG–Er-doped Y2O3 nanoparticles (3, 1.0 ng/mL; 4, 30 μg/mL NHS-PEG concentration used for the modification). Arrows indicates peaks at 2,900 and 1,100 cm−1 (see text for details)
Additional evidence of PEG modification was obtained from examination of decomposition behavior using thermogravimetry [16]. Figure 4 shows the thermogravimetric curves of (1) Er–Y2O3 nanoparticles, (2) APTES–Er–Y2O3 nanoparticles, and (3 and 4) PEG–Er–Y2O3 nanoparticles (3, 1.0 ng/mL; 4, 30 μg/mL NHS-PEG concentration used for the modification). The weight% was normalized with the value at 600 °C. As shown in curve (1), thermal decomposition of unmodified Er–Y2O3 nanoparticles proceeded gradually from 170 °C. The weight loss with increasing temperature from 170 to 600 °C was calculated to be 4.2%. Curve (2) shows that decomposition of APTES–Er–Y2O3 nanoparticles began at 250 °C with a weight loss of ca. 5.6% at 600 °C. Thus, the amount of APTES relative to Er–Y2O3 was calculated to be 1.4%. The decomposition behavior of PEG–Er–Y2O3 is shown in curves 3 and 4. Decomposition of PEG–Er–Y2O3 nanoparticles clearly began at lower temperatures compared with APTES–Er–Y2O3 nanoparticles. Since the decomposition temperature of the used NHS-PEG was approximately 200 °C (data not shown), this data confirmed that the particles were modified with PEG. The relative amount of attached PEG to Er–Y2O3 was estimated to be 1.7% and 4.8%, respectively.
Fig. 4.
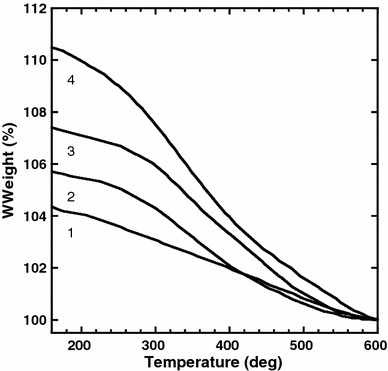
Thermogravimetric curves of (1) Er–Y2O3, (2) APTES–Er–Y2O3, (3 and 4) PEG–Er–Y2O3 nanoparticles (3, 1.0 ng/mL; 4, 30 μg/mL NHS-PEG concentration used for the modification)
The dispersion stability of the PEG–Er–Y2O3 nanoparticles in aqueous milieu was evaluated by monitoring changes in turbidity with time. As shown in plot (1) of Fig. 5a, the turbidity of APTES–Er–Y2O3 in water decreased to 30% at 120 min due to sedimentation. The inset of Fig. 5a shows that sedimentation began at 4 min. Sedimentation began with the same slope for all of the samples during the initial 4 min. After 4 min, however, only the slope corresponding to the APTES–Er–Y2O3 nanoparticle sample changed steeply. This change in slope may have resulted from aggregation of APTES–Er–Y2O3 nanoparticles in water. In contrast, PEG modification markedly improved the dispersion stability of Er–Y2O3 nanoparticles in water (plots 2 and 3 in Fig. 5a). It was shown that PEG–Er–Y2O3 nanoparticles were stably dispersed in water even after a 130-min holding time. As observed in Fig. 5b, PEG modification improved dispersion stability of UCP nanoparticles also in Tris buffer which corresponds to a physiological condition. To our knowledge, this is the first demonstration that PEGylation by covalent bonding to the surface of UCP nanoparticles significantly improved dispersion stability in aqueous milieu.
Fig. 5.
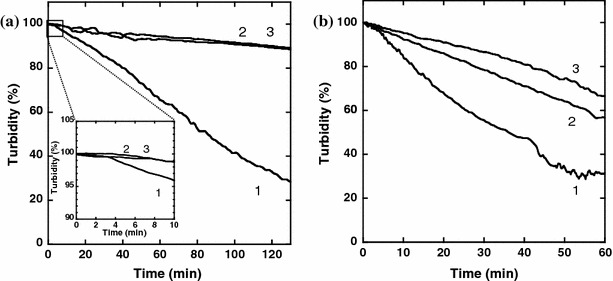
Dispersion stability of (1) APTES–Er–Y2O3, (2 and 3) PEG–Er–Y2O3 nanoparticles (2, 1.0 ng/mL; 3, 30 μg/mL as NHS-PEG concentration used for the modification) in (a) water and (b) Tris buffer (10 mM Tris–HCl, pH 7.4, 100 mM NaCl)
Figure 6 shows the UC emission spectrum of Er3+ ions in the PEG–Er–Y2O3 nanoparticles with peaks at ca. 550 and 660 nm. It should be noted that the emission spectrum of PEG–Er–Y2O3 nanoparticles was similar to that of Er–Y2O3 nanoparticles and APTES–Er–Y2O3 nanoparticles, indicating that modification by PEG and APTES had no effect on the UC emission properties of Er–Y2O3 nanoparticles.
Fig. 6.
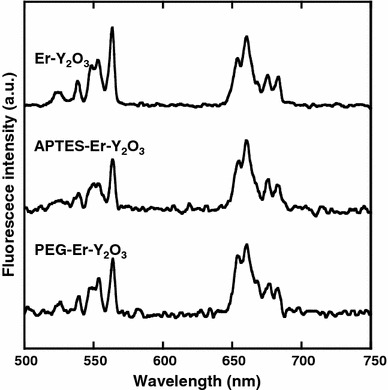
UC emission spectra of Er–Y2O3, APTES–Er–Y2O3 and PEG–Er–Y2O3 nanoparticles (λex = 980 nm)
The UC emission image of PEG–Er–Y2O3 nanoparticles excited by the IR laser is shown in Fig. 7. Since UC emission peak at ca. 660 nm was the strongest, the emission between 660 and 740 nm was collected through a bandpass filter. Each PEG–Er–Y2O3 nanoparticle molecule clearly showed UC emission, supporting the potential use of PEG–Er–Y2O3 nanoparticles as bioimaging probes.
Fig. 7.
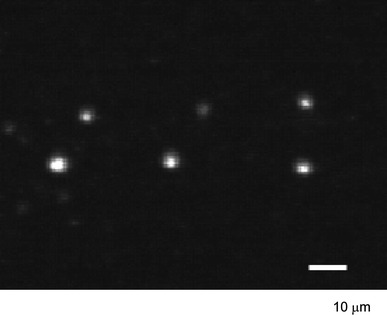
UC emission micrograph of PEG–Er–Y2O3 nanoparticles. The UCP nanoparticles were excited using an IR laser (λex = 980 nm) and the UC emission between 660 and 740 nm was observed. The scale bar represents 10 μm
Cell toxicity is another important issue when considering probes for use in bioimaging. Previously Schubert et al. showed that Y2O3 nanoparticles are nontoxic using an MTT method [22], which agrees well with a previous report showing that the toxicity of rare earth oxides is very low with an LD50 value in the order of 1,000 mg/kg [23]. In this study, effect of Er3+ ion doping into Y2O3 nanoparticles and surface modification to them with APTES and PEG on the cell toxicity was evaluated using an MTT method. As shown in Fig. 8, addition of Er–Y2O3 nanoparticles, APTES–Er–Y2O3 nanoparticles or PEG–Er–Y2O3 nanoparticles to cells resulted in no detectable cell toxicity, even with 10 μg/mL UCP nanoparticles in the culture medium which is a sufficient concentration for use in bioimaging. It should be noted that surface modification with APTES and PEG did not alter the cell toxicity associated with the use of these nanoparticles. In this study, it is not clear whether UCP nanoparticles bind to cell surface or are taken inside of the cell. Recent studies have shown that nanoparticles, such as protein oligomer [24] and water soluble fullerenes [25] are cytotoxic, possibly due to binding to cell surface receptor that causes cell death and oxidative damage to the cell membranes, respectively. These observations suggest that nanoparticles that are not taken inside the cell can also be cytotoxic. Taking these into account, our observations that PEG-modified UCP nanoparticles are not cytotoxic lend strong support to their potential use as bioimaging tools.
Fig. 8.
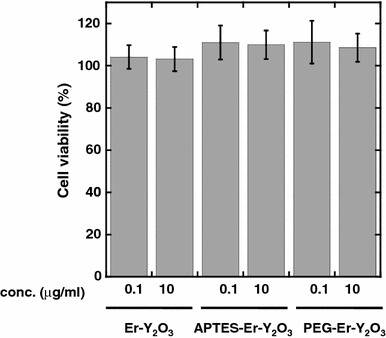
Cell toxicity associated with the use of Er–Y2O3 nanoparticles, APTES–Er–Y2O3 nanoparticles, and PEG–Er–Y2O3 nanoparticles. Cell viabilities following incubation for 24 h in the absence (control) or presence of UCP nanoparticles at the indicated concentration were determined using an MTT Cell Proliferation kit
Conclusions
Covalent PEG-modification of the surface of Er-doped Y2O3 nanoparticles markedly improved dispersion stability in aqueous milieu, which is essential for applications utilizing bioimaging probes. The upconversion emission and low cell toxicity associated with the use of PEG-modified Y2O3 nanoparticles supports its utility as a bioimaging probe. Further bio-functionalization of PEG-modified Y2O3 nanoparticles using bi-functional block copolymer PEG with heterogeneous ends for specific biotargeting is currently in progress.
Acknowledgements
The authors thank Prof. Y. Nagasaki (Univ. of Tsukuba, Ibaraki, Japan) for his advice and discussion on the PEG modification of the particles. This work is financially supported by RIKEN and the Ministry of Education, Science, Sports, Culture, and Technology (MEXT) of Japan. K.S. was financially supported by “Development of upconversion nano-particles for bio-nano-photonics” from New Energy and Industrial Technology Development Organization (NEDO) of Japan.
Open Access
This article is distributed under the terms of the Creative Commons Attribution Noncommercial License which permits any noncommercial use, distribution, and reproduction in any medium, provided the original author(s) and source are credited.
Contributor Information
Tamotsu Zako, Email: zako@riken.jp.
Kohei Soga, Email: mail@ksoga.com.
References
- 1.Holmes KL, Lantz LM. Methods Cell Biol. 2001;63:185. doi: 10.1016/S0091-679X(01)63013-9. [DOI] [PubMed] [Google Scholar]
- 2.Choy G, Choyke P, Libutti SK. Mol Imaging. 2003;2:303. doi: 10.1162/153535003322750646. [DOI] [PubMed] [Google Scholar]
- 3.Jaiswal JK, Mattoussi H, Mauro JM, Simon SM. Nat Biotechnol. 2003;21:47. doi: 10.1038/nbt767. [DOI] [PubMed] [Google Scholar]
- 4.Wang F, Tan WB, Zhang Y, Fan X, Wang M. Nanotechnology. 2006;17:R1. doi: 10.1088/0957-4484/17/1/R01. [DOI] [Google Scholar]
- 5.Chen X, Conti PS, Moats RA. Cancer Res. 2004;64:8009. doi: 10.1158/0008-5472.CAN-04-1956. [DOI] [PubMed] [Google Scholar]
- 6.Cai W, Shin DW, Chen K, Gheysens O, Cao Q, Wang SX, et al. Nano Lett. 2006;6:669. doi: 10.1021/nl052405t. [DOI] [PubMed] [Google Scholar]
- 7.Zijlmans HJ, Bonnet J, Burton J, Kardos K, Vail T, Niedbala RS, et al. Anal Biochem. 1999;267:30. doi: 10.1006/abio.1998.2965. [DOI] [PubMed] [Google Scholar]
- 8.Prasad PN. Mol Cryst Liquid Cryst. 2004;415:1. doi: 10.1080/15421400490482943. [DOI] [Google Scholar]
- 9.Lim SF, Riehn R, Ryu WS, Khanarian N, Tung CK, Tank D, et al. Nano Lett. 2006;6:169. doi: 10.1021/nl0519175. [DOI] [PubMed] [Google Scholar]
- 10.Sivakumar S, Diamente PR, Van Veggel FC. Chem Eur J. 2006;12:5878. doi: 10.1002/chem.200600224. [DOI] [PubMed] [Google Scholar]
- 11.Auzel F. Chem Rev. 2004;104:139. doi: 10.1021/cr020357g. [DOI] [PubMed] [Google Scholar]
- 12.Matsuura D. Appl Phys Lett. 2002;81:4526. doi: 10.1063/1.1527976. [DOI] [Google Scholar]
- 13.Capobianco JA, Vetrone F, Boyer JC, Speghini A, Bettinelli M. J Phys Chem B. 2002;106:1181. doi: 10.1021/jp0129582. [DOI] [PubMed] [Google Scholar]
- 14.Wuelfing W, Gross S, Miles D, Murray R. J Am Chem Soc. 1998;120:12696. doi: 10.1021/ja983183m. [DOI] [Google Scholar]
- 15.Otsuka H, Akiyama Y, Nagasaki Y, Kataoka K. J Am Chem Soc. 2001;123:8226. doi: 10.1021/ja010437m. [DOI] [PubMed] [Google Scholar]
- 16.Araki J, Wada M, Kuga S. Langmuir. 2001;17:21. doi: 10.1021/la001070m. [DOI] [Google Scholar]
- 17.Konishi T, Yamada M, Soga K, Matsuura D, Nagasaki Y. J Photopolym Sci Technol. 2006;19:145. doi: 10.2494/photopolymer.19.145. [DOI] [Google Scholar]
- 18.Soga K, Koizumi R, Yamada M, Nagasaki Y. J Photopolym Sci Technol. 2005;18:73. doi: 10.2494/photopolymer.18.73. [DOI] [Google Scholar]
- 19.Mosmann T. J Immunol Methods. 1983;65:55. doi: 10.1016/0022-1759(83)90303-4. [DOI] [PubMed] [Google Scholar]
- 20.De Palma R, Peeters S, Van Bael MJ, Van Den Rul H, Bonroy K, Laureyn W, et al. Chem Mater. 2007;19:1821. doi: 10.1021/cm0628000. [DOI] [Google Scholar]
- 21.Heggli M, Tirelli N, Zisch A, Hubbell JA. Bioconjug Chem. 2003;14:967. doi: 10.1021/bc0340621. [DOI] [PubMed] [Google Scholar]
- 22.Schubert D, Dargusch R, Raitano J, Chan SW. Biochem Biophys Res Commun. 2006;342:86. doi: 10.1016/j.bbrc.2006.01.129. [DOI] [PubMed] [Google Scholar]
- 23.Palmer RJ, Butenhoff JL, Stevens JB. Environ Res. 1987;43:142. doi: 10.1016/S0013-9351(87)80066-X. [DOI] [PubMed] [Google Scholar]
- 24.Gharibyan AL, Zamotin V, Yanamandra K, Moskaleva OS, Margulis BA, Kostanyan IA, et al. J Mol Biol. 2007;365:1337. doi: 10.1016/j.jmb.2006.10.101. [DOI] [PubMed] [Google Scholar]
- 25.Sayes CM, Fortner JD, Guo W, Lyon D, Boyd AM, Ausman KD, et al. Nano Lett. 2004;4:1881. doi: 10.1021/nl0489586. [DOI] [Google Scholar]


