Abstract
The elastic properties of thermoplastic elastomers based on poly(tetramethylene oxide) and monodisperse amide hard segments (HS) were studied in compression and tensile mode as well as with stress relaxation (SR) measurements. For these copolymers the compression set values were low and increased with the modulus and temperature. At low strains (<50%) the tensile set (TS) values were low and the strain recovered almost completely with time. Furthermore, the TS values increased with strain, due to a deformation of the crystallites and a strain hardening of the polyether segments. During the SR measurements, two processes were observed: a fast initial decay in the first 10 s followed by a relaxation process that was dependant on the logarithm of time. The initial decay during the first seconds increased with the modulus of the copolymers and with the applied strain. The SR values for the second process, normalised to the stress at 100 s, were independent of the strain (within the range of 25–300%) and only little dependant on the modulus of the system. In comparison to the literature data the copolymers with the monodisperse HS displayed improved elastic properties and low SR values.
Keywords: Stress Relaxation, Applied Strain, Hard Segment, Yield Strain, Thermoplastic Elastomer
Introduction
Thermoplastic elastomers (TPEs) are used in a wide variety of applications for their low modulus, high strength, interesting elastic behaviour and ease of processing [1–3]. The knowledge of their elastic behaviour is essential for utilising these materials. One type of TPE is made up of segmented block copolymers comprising a continuous phase with a low glass transition temperature (Tg) and a dispersed phase with a high melting temperature (Tm) [1–3]. In certain cases, they also contain a crystalline soft phase with a melting temperature close to room temperature. The high melting hard segments (HS) provide these TPEs their dimensional stability and easy processability. The tensile and elastic properties of TPEs are sensitive to the type, concentration and morphology of the hard phase [1–4]. Segmented block copolymers often demonstrate relatively low yield stresses, as well as high fracture strains and fracture stresses. Moreover, upon increasing the temperature, polymers exhibit a diminishing modulus, yield stress and the fracture stress as well as an increase in the fracture strain [1–8].
The HS crystallites have a nano-ribbon-like structure with a high aspect ratio [9–13], and offer reinforcement to the soft phase [5, 14, 15]. Upon stretching of such a copolymer, both the soft and the hard phases are deformed, and for a high enough strain, yielding of the hard phase occurs [12, 15–17]. During such yielding, the crystallites are sheared and their orientation becomes changed (Fig. 1) [12, 15].
Fig. 1.

A schematic representation of the change in crystalline morphology of a segmented block copolymer during straining: a long, randomly oriented crystalline ribbons; b broken-up ribbons oriented in the strain direction; and c very small ribbons with an orientation perpendicular to the strain [15]
Upon straining of these materials, a dramatic decrease of the initial E-modulus was observed, which is said to be due to a lowering of the aspect ratio of the ribbon-like crystallites (Fig. 1b) [15]. At a strain of 200%, the E-modulus can be lowered as much as 10-fold and, moreover, the ribbons become oriented in the stretching direction. At even higher strains, the ribbons are further broken up into crystallites with small aspect ratios and now also these smaller ribbons turn, thus orienting themselves perpendicularly to the stretching direction (Fig. 1c). Of the poly(tetra methylene oxide)–polyamide copolymer (PTMO–PA) up to a strain of 500%, the orientation of the PTMO phase is low and upon relieving the strain, the orientation of PTMO is lost [18]. At very high strains the crystallisable soft phase (PTMO) may, upon stretching, undergo a strain-induced crystallisation, thereby strain-hardening the copolymer [2, 15, 18].
The elasticity of elastomers concerns their ability to recover after appreciable deformation. The remaining deformation might be due to the internal friction of the matrix phase, the sheared dispersed crystallites and a strain-induced crystallisation process [2]. Part of this deformation returns in time and is thus viscoelastic in nature [2, 19]. A distinction is made between low strain and high strain deformation since, at low strains (below the yield strain of the copolymer), the HS phase has yet to be sheared and no strain-induced crystallisation of either the SS or HS has taken place.
The elastic behaviour of TPEs is often studied with tensile set (TS), compression set (CS) and stress relaxation (SR) measurements of which the CS method is the most utilised. Generally, the CS values increase (the material becomes less elastic) with an increasing modulus and test temperature. The CS values decrease with relaxation time thus indicating that they have a viscoelastic component [9, 19]. Also the TS values have been found to increase with modulus and strain [2, 14, 18–22]. Below the yield strain not only elastic but also viscoelastic and possibly plastic deformation had taken place [23]. Furthermore, the TS values have been found to be low, and at higher strains these values increase. If strain hardening takes place at high strains, the TS values increase even more [14, 19]. In time, recovery of the deformation generally occurs suggesting that part of the deformation is viscoelastic in nature [2, 18, 22].
In SR experiments, the stress decay is dependent on various factors, such as the type of copolymer, the HS concentration, the applied strain, as well as the time and temperature [11, 14, 15, 18, 22, 24–27]. Le et al. [24] have studied SR as a function of the type of (co)polymer. Crosslinked NBR had the lowest relaxation of stress followed by a poly(ether-block-amide) (Pebax), and the highest SR was observed for styrene-ethylene butylene-styrene (SEBS) (tri-block copolymer). The relaxation stress (SR) often depends linearly on the logarithm of time, as has been found for polyurethanes [26], poly(ether-block-amide) (Pebax) [11] and polypropylene (PP) [27]. However, this behaviour was not observed during the first 10 s of the experiment and the relaxation in these first 10 s had an appreciable effect on the total SR values [11, 14]. An option would be to quantify the SR process from data with a SR time higher than 10 s [14]. The SR values as determined from time zero, increased with the modulus and applied strain [11, 14, 15].
Segmented block copolymers normally display HS of a random length distribution, and these HS usually have low crystallinities (15–40%) and often possess complex morphologies [1–3]. The morphology of segmented block copolymers is well-defined if the HS are monodisperse in length. With monodisperse HS with a regular chemical structure (urethane, urea, and amide), the crystallinity is high (>80%), and remains high up to the melting temperature (urethane, urea) [28, 29]. As the HS concentration was low and the crystallinity very high, the concentration of the HS in the SS was low. As a result of this low HS concentration in the SS phase the Tg of that phase was very low [28, 29]. Furthermore, the aspect ratio of the crystallites is very high (>300) [8, 12–15, 30]. Copolymers with monodisperse HS have higher moduli and lower CS and TS values [14, 15, 18, 19, 28, 31]. Thus, by using monodisperse HS the elastic properties can be improved [14, 31], and by increasing the HS concentration, while maintaining the HS length constant, both the CS [14, 15, 19] and the TS [14, 18, 32] can be increased. Surprisingly, the elastic properties also improved if the length of the monodisperse segments are increased from di- to tetra- and hexa-amide [14, 19].
A well-studied segmented block copolymer with monodisperse HS is PTMOx–T6A6T (Fig. 2) [23, 28, 31].
Fig. 2.

The chemical structure of PTMOx–T6A6T
This copolymer consists of alternating soft and HS [28], where the soft segments are comprised of PTMO and the HS are made of hexamethylene diamine (6), terephthalic acid (T) and adipic acid (A) (T6A6T). The crystallinity of the tetra-amide segment in the copolymers was approximately 80–90%, the Tm of the polymers was about 185° C and the crystalline ribbons had high aspect ratios [28]. The PTMO segments are able to crystallise and for PTMO lengths of >1400 g/mol, its Tm is above room temperature. When the content of crystallisable segment in the copolymer was increased (16–44 wt%), the E-modulus at room temperature was raised from 29 to 311 MPa [23]. The yield strength increased linearly with increasing tetra-amide content and at the same time the yield strain decreased from 66 to 25% [23]. A strain-softening was observed well below the yield point. In the unoriented state long PTMO segments (>1400 g mol−1) can crystallise and thereby negatively influencing the low temperature properties. The PTMO segments can on stretching undergo strain-crystallisation, further increasing the crystallinity and resulting in enhanced ultimate properties.
The modulus at low strains (<1%) of the copolymers was from room temperature to near the melting temperature almost temperature independent [23]. However, the yield strength at much higher strains decreased within the same temperature span [23]. Apparently, at the higher strains the crystallites could be more easily deformed with increasing temperature, and surprisingly, also the yield strain was found to decrease with temperature.
The present article reports on the elastic properties of PTMOx–T6A6T polymers as functions of the T6A6T concentration, temperature and time. These segmented copolymers had a well-defined morphology and were therefore interesting to study. The elastic behaviour of the materials was evaluated by means of CS, SR and TS measurements, and emphasis was placed on PTMO2000–T6A6T.
Experimental section
Materials
The synthesis and various properties of the PTMOx–T6A6T copolymers have been described in a previous article [28]. Dumbbell-shaped test bars were prepared by injection moulding of the copolymers in an Arburg Allrounder 221-55-250 injection moulding machine. Solution viscosities, dynamic mechanical and tensile data were taken from a previous investigation [23].
CS measurements at room temperature
Samples for CS experiments (10 × 10 × 2 mm3) were cut from injection moulded bars. The materials were compressed 25% during 24 h, after which the compression was released. Following a relaxation time of half an hour, the thickness of the samples was remeasured (ASTM 395 B). The CS was taken as the average of four measurements, and was defined according to:
 |
1 |
where d0 = the thickness before compression (mm); d1 = the thickness during compression (mm); and d2 = the thickness after 0.5 h relaxation (mm).
CS at high temperatures
For CS evaluations at higher temperatures, the 25% compression was first applied at room temperature after which the holder was placed in a vacuum oven at high temperature. After 24 h and cooling, the holder was opened and the samples were allowed to relax at room temperature.
TS tests
Cyclic stress–strain experiments were conducted on injection-moulded dumbbells (ISO 37 type 2). A Zwick Z020 universal tensile machine equipped with a chamber with a controlled temperature environment and a 500 N load cell was utilised to measure the stress as a function of the strain of each loading and unloading cycle at a nominal strain rate of 0.4 s−1 (test speed of 60 mm/min).
Staircase loading
The strain of each loading–unloading cycle was increased (staircase loading) and the TS of the strain increment was determined as a function of the applied nominal strain. The incremental TS was calculated from the following relation (Eq. 2):
 |
2 |
where εr,cycle(i) = the remaining strain at the end of cycle i; and εr,cycle(i−1) = the remaining strain at the end of the preceding cycle i − 1.
Immediately after the stress had decreased to zero, a new cycle was started. The strain of the first cycle was 20% and for each following cycle the strain was increased with 40% calculated on the original length of the sample. A strain range of 0–400% was studied.
Single/multiple cycle
The TS was determined by applying a cyclic strain of 100%. The remaining strain immediately after unloading was used to calculate the TS (i = 1).
SR tests
Injection moulded ISO 37 s2 dumbbells were used as samples for SR experiments. The SR was measured on a Zwick Z020 universal tensile machine equipped with a 500 N load cell, and the strain was determined as the clamp displacement with a starting clamp distance of 35 mm. The samples were strained at a rate of 0.33 s−1. The decay of the stress was measured for 10,000 s. The decay in the first 100 s, i.e., the initial stress decay, was calculated with Eq. 3, and the normalised SR, i.e., SRn, was calculated with Eq. 4.
 |
3 |
 |
4 |
Results and discussion
The PTMOx–T6A6T copolymers were TPE materials with a well-defined morphology [28]. The PTMOx length varied from 650 to 2900 Da, and the mono-disperse bi-ester tetra-amide segments T6A6T readily crystallised into nano-ribbons with high aspect ratios. The elastic behaviour of these polymers was studied as a function of temperature and time. The present section first discusses the CS measurements, followed by the TS test and finally, the SR studied as a function of the applied strain and the rigid segment content. Various properties of the studied copolymers are provided in Table 1.
Table 1.
Various properties of the PTMOx–T6A6T copolymers
| HS (wt%) | ηinh (dl/g) | Tg (°C) | Tflexa (°C) | Tflowb (°C) | G′-mod (Mpa) | E-mod (Mpa) | CS25% (%) | TS50%c (%) | |
|---|---|---|---|---|---|---|---|---|---|
| PTMO650 | 43.8 | 1.8 | −45 | 35 | 200 | 102 | 311 | 17 | 32 |
| PTMO1000 | 34.2 | 2.5 | −60 | −15 | 185 | 51 | 133 | 14 | 28 |
| PTMO1400 | 27.1 | 1.5 | −65 | 0 | 180 | 30 | 87 | 11 | 18 |
| PTMO2000 | 21.1 | 2.9 | −70 | 10 | 185 | 18 | 46 | 9 | 11 |
| PTMO2900 | 15.7 | 3.5 | −70 | 20 | 175 | 9 | 29 | 7 | 8 |
Compression set
A standard method for measuring the elasticity of polymers is by means of CS tests. Polymer pieces, 2 mm thick, were compressed 25% between two metal plates during 24 h. After this compression time, the polymer samples were allowed to relax for 30 min and the thickness was remeasured. The CS could then be calculated based on the thickness values from before and after the test. A lower CS refers to a more elastic behaviour. The CS for the PTMOx–T6A6T copolymers was evaluated as a function of composition, temperature and relaxation time.
Composition
The CS values of the PTMOx–T6A6T copolymers decreased with decreasing T6A6T concentration (Table 1), and were found to range from 6 to 17%, which are very low values. As the T6A6T concentration increased the modulus of the copolymers also increased (Table 1). The change in CS with modulus for the PTMOx–T6A6T copolymers is given in Fig. 3.
Fig. 3.
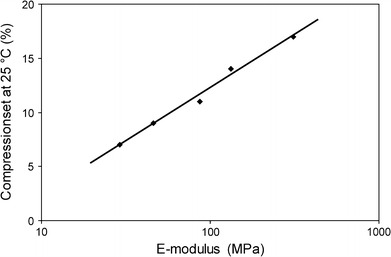
The CS as a function of Young’s modulus at 25 °C for PTMOx–T6A6T segmented copolymers, compressed during 24 h and let to relax for 30 min before being remeasured
The CS values increased with increasing modulus, which is a general trend [1–3], and similar low CS values have been measured on other segmented copolymers with monodisperse HS [15, 19, 30]. The CS values of the PTMOx–T6A6T copolymers were appreciably lower than those of commercial copolymers [1]. A similar effect with another monodisperse amide segments has been observed before [14]. Thus, it seems that the use of monodisperse HS has a positive effect on the modulus–CS relationship.
Temperature
In addition to being performed at room temperature, CS measurements are also often carried out at elevated temperatures according to the ASTM D-395-89.1 This ASTM norm involves the compression being applied at elevated temperatures while the relaxation is carried out at room temperature. Figure 4 presents the effect of temperature on the CS values of PTMO2000–T6A6T.
Fig. 4.
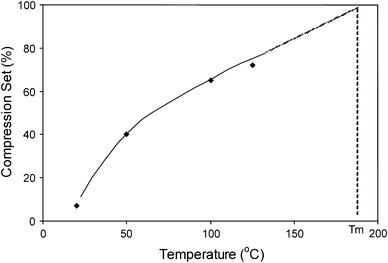
The CS25% for PTMO2000–T6A6T as a function of temperature during compression. The relaxation took place at a temperature of 25 °C
The CS values of the PTMO2000–T6A6T copolymer were at room temperature remarkably low. Nevertheless, they displayed a significant increase with increasing temperature. At the melting temperature of the copolymer (185 °C), the CS values were expected to be 100%. The remaining deformation seemed to become stronger with increasing temperature, but whether this increase in remaining deformation was completely plastic in nature was unclear.
Relaxation
The CS value is often taken as a measure of plastic deformation disregarding the viscoelastic effects [19]. The standard CS test at higher temperatures is rather complicated: the mounting of the sample takes place at room temperature, the time dependent compression (24 h) occurs at elevated temperature, the unloading of the deformation is done at room temperature and the relaxation (30 min) also occurs at room temperature. In other words, after the compression at room temperature, a constant deformation takes place at elevated temperature whereas the elastic and viscoelastic relaxations are at room temperature. Preferably, the entire test should have been carried out at a single temperature, but this would not be very practical. In order to get some insight into the test, the temperature during the relaxation was varied as was the relaxation time. Polymer samples of PTMO2000–T6A6T were compressed at 100 °C during 24 h and unloaded after which the relaxation was monitored at various temperatures over time. The relaxation process of the samples was performed in a vacuum oven at 25, 75, 100 and 125 °C (Fig. 5).
Fig. 5.
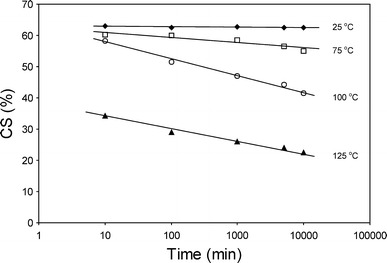
The CS25%, at 100 °C, of PTMO2000–T6A6T as a function of the relaxation temperature and time
By increasing the temperature and the relaxation time after unloading, the CS values were lowered. At short time intervals (~10 min), most CS values were ~60%, suggesting a 40% elastic recovery of the applied compression at 100 °C. At room temperature, the CS values were almost independent of relaxation time, as the test specimens relaxed at a minimum rate. The viscoelastic recovery at room temperature was small whereas it was much faster at higher temperatures. This can be explained by the higher mobility of the polymer at elevated temperatures. Unusual was the behaviour of the sample relaxed at 125 °C, as now the elastic relaxation appeared to be much stronger as opposed to at lower temperatures. The results from all four temperatures indicated that the CS values were composed partly of an elastic deformation and partly of a viscoelastic deformation. The elastic deformation was considerable when the relaxation temperature was higher than the compression temperature. The results also suggested that the CS values were dependant on the relaxation time and that the viscoelastic effects increased with temperature.
Tensile set
The elastic properties of TPEs can also be determined by TS measurements. During TS tests, several parameters, including the tensile strain, the strain step size, the number of cycles, the loading and unloading rate and the relaxation time, can be varied. The present study involved TS measurements with a loading/unloading strain rate of 0.4 s−1 and the absence of a relaxation time between the loading and unloading cycle, unless otherwise stated. The strain in the unloading cycle at zero stress was used for calculating the TS. Three types of TS tests were carried out: single-cycle TS, cyclic TS at increasing strain (staircase loading) and multiple cycle TS at one strain.
TS method
The TS was determined in a cyclic test and a restraining step was generally carried out directly after the unstraining. The TS could be studied at a single strain or in a strain sweep. In the single-strain tests, a new sample was taken for each strain and the TS was calculated as the set over the applied strain. In the strain sweep, the strain was increased for each cycle (Fig. 6a) and in this case, the TS could be determined in two ways: either from the total set after each cycle or separately for each cycle from the incremental set as a function of the incremental strain.
Fig. 6.
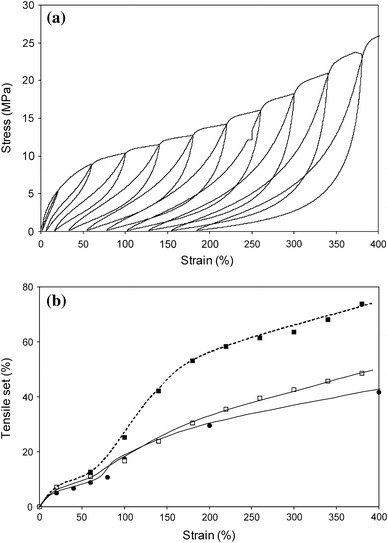
Staircase and single loading tensile tests on PTMO2000–T6A6T: a staircase loading cycles; b TS: ●, single loading; □, staircase loading after each cycle; ■, staircase loading from strain increment
The TS during single loadings was found to slowly increase with increasing strain, and for strains up to 80%, the TS values were below 10% (Fig. 6b). At strains of 80% and higher, above the yield strain (50%), a considerable raise in TS was observed. The TS values from staircase loadings after each cycle were only marginally higher than the values from the single loadings. The TS values determined for each strain increment were higher than those from the other two methods, particularly at higher strains. The TS from the strain increment provided more information on the elastic behaviour at each strain.
Composition of the copolymers
The TS was studied as a function of strain for various PTMOx–T6A6T copolymers (Fig. 7). The samples were tested in staircase loading cycles and the set values were determined from the strain increments.
Fig. 7.
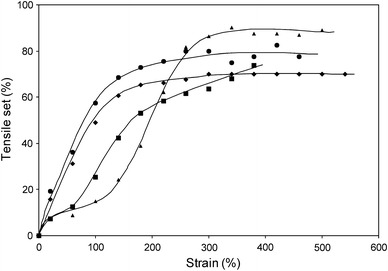
The TS as a function of strain as determined by a cyclic staircase TS test and the TS values calculated from the strain increment for various copolymers: ●, PTMO650–T6A6T; ◆, PTMO1000–T6A6T; ■, PTMO2000–T6A6T; ▲, PTMO2900–T6A6T
For PTMO650–T6A6T and PTMO1000–T6A6T, the TS increased with the strain up to a strain of 200% and then levelled off. The PTMO650–T6A6T displayed higher TS values, as compared to PTMO1000–T6A6T (and PTMO1500–T6A6T, not shown). For PTMO2000–T6A6T and PTMO2900–T6A6T, on the other hand, the behaviour was more complex. They displayed low TS values (~10%) at low strains, however, at higher strains, a significant increase was observed which was particularly strong for PTMO2900–T6A6T. Once again, the TS values levelled off at very high strains. PTMO2000 and PTMO2900 were able to strain-crystallise [18] thus leading to an increase in their TS values. The TS values at 50% strain were augmented with increasing modulus and were somewhat higher than their CS25% counterparts (Table 1).
Temperature
The effect of the temperature (20–110 °C) on the TS of PTMO2000–T6A6T was studied and results are displayed in Fig. 8.
Fig. 8.
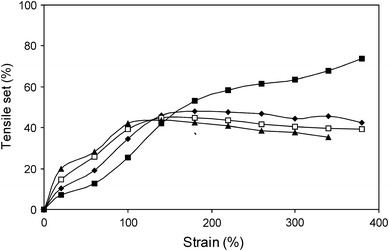
The TS as a function of strain as determined by a cyclic staircase TS test and the TS values calculated from the strain increment for PTMO2000–T6A6T at four temperatures; ■, 20 °C; ◆, 50 °C; □, 80 °C; ▲, 110 °C
The TS displayed a complex behaviour as a function of temperature and two regions could be distinguished: one region up to a strain of 150% and another region at higher strains. In the first region, it was clear that the TS increased with temperature. An effect of this was that the yield strain was lowered with increasing temperatures [5–8]. For elongations above 150%, the inverse trend was observed and the TS values were lowered as the temperature increased. The TS of PTMO2000–T6A6T at 20 °C displayed a clear jump at 150% strain, caused by a strain-induced crystallisation of PTMO2000 [15]. This strain-induced crystallisation increased the TS values of the material at high strains. At temperatures above the melting temperature of the strained PTMO (i.e., >43 °C) [15], the material was unable to undergo such a strain-induced crystallisation. As a result, the TS values at high strains became lower at higher temperatures. Moreover, it appeared that the materials become more elastic at temperatures above 50 °C. However, the differences in TS values between 50 and 110 °C were small.
Multiple cycle test at a single strain
The elastic behaviour of PTMO2000–T6A6T was also studied for repeated loading cycles. Polymers are viscoelastic materials and their response to loading and unloading cycles is time dependent. The ability of PTMO2000–T6A6T to recover after a deformation was investigated in a test with multiple cycles, in which the copolymer was repeatedly loaded and unloaded to 100% (Fig. 9a).
Fig. 9.
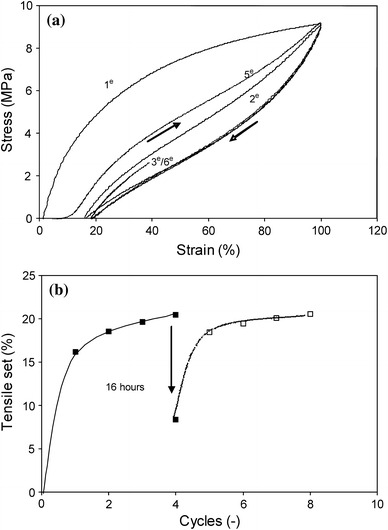
a A cyclic tensile test to 100% strain for PTMO2000–T6A6T displaying the first two cycles as well as cycle 5 after 16 h of relaxation. b The TS100% versus the number of cycles: □, cycles after 16 h relaxation time
The multiple cycle test was at first performed without any relaxation time between unloading and reloading, but after the fourth cycle the sample was allowed to relax for 16 h prior to reloading. In the first cycle, the TS value was high and the total TS in the subsequent cycles increased only slightly (Fig. 9b). If the TS had been calculated per cycle, the values after the first cycle would have been very low (1–2%) and the material would appear to have become highly elastic. At the same time, the tensile E-modulus with a value of 50 MPa during the first loading, decreased to 20 MPa in the following cycles. The high TS values and significant decrease in E-modulus from the first cycle indicated a plastic deformation of the crystallites and a lowering of the reinforcing effect of the crystallites. The reinforcing crystallites are thought to have been broken up during cycle 1 (Fig. 1) [12]. Also the maximum stress for a subsequent cycle was slightly lower than the stress in the previous cycle and this diminution of the maximum stress was believed to have been due to SR during unloading and loading.
After four loading–unloading cycles to 100% strain, the total TS in the sample was 21% and the increase after the first cycle was minimal (Fig. 9b). The question thus arises whether the material remained highly elastic indefinitely. After four cycles, the sample was allowed to relax for 16 h, during which time the sample shrunk and the TS value was lowered from 21 to 8%. During the 16 h of standing idle, a strong relaxation had thus taken place. This relaxed sample was subsequently retested and the TS values returned to 20%, which was almost as high as before the relaxation [2, 18]. The E-modulus displayed no increase after the 16-h relaxation period suggesting that no healing of the crystalline structure took place. The decrease in TS values during the relaxation can be attributed to the viscoelastic behaviour of the polymer. The TS in the first cycle was thus only partly due to the break-up of the crystallites.
TS relaxation
The effect of relaxation on the TS values was also studied on PTMO2000–T6A6T as a function of strain for a case of single loading. In this case, new samples were used for each strain value (Fig. 10).
Fig. 10.
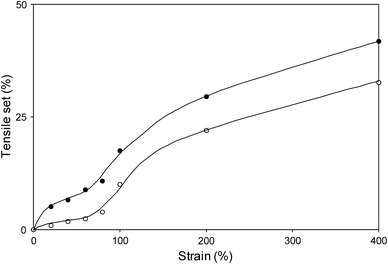
TS values for PTMO2000–T6A6T at various strains; ●, TS after unloading; ○, TS after 2 weeks of relaxation
As was seen above (Fig. 6), during single loading, the TS increased gradually with increasing strain up to 80% strain, giving rise to TS values below 10%. At strains just above 80%, the TS displayed a significant jump to higher values indicating a strong increase in plastic deformation at this point. The increase in TS happened somewhat above the yield point (50%) and a similar trend was also observed in the case of staircase loading (Fig. 6).
Following the loading and unloading cycle, the samples were allowed to relax for 2 weeks after which the TS was remeasured. The TS values were systematically lower (~7%) after 2 weeks of relaxation as opposed to the TS values for samples not having undergone any relaxation. After these 2 weeks, the TS in the region prior to the yield strain had decreased almost completely to zero. The viscoelastic relaxation was thus independent of strain and represented the TS at the yield point. From these results, it could be concluded that the plastic deformation that was taking place at low strains as observed from the modulus change [15] had apparent little effect on the TS values after 2 weeks relaxation.
Stress relaxation
The SR measurements were performed in order to study the time-dependent deformation behaviour of the segmented block copolymers. In a SR test, a polymer sample is strained to a certain value and the stress decay is measured with time. For ideal elastomers, no SR occurs. The stress in segmented block copolymers depends on the soft segment matrix reinforced with crystallites. Thus, the SR is dependent on the untangling of amorphous chains on the shearing of the crystallites and the changing reinforcement of the crystallites. The SR (SRn) is quantified by the normalised slope of the stress with log time, i.e., the slope divided by the stress at 100 s (Eq. 4).
Dependence of strain
The SR in the segmented block copolymers seemed to consist of two processes: one stage of a fast initial decay of the stress during the first seconds, followed by a slower process [2, 11, 15]. The relaxation for PTMO2000–T6A6T was studied as a function of the applied strain and the results can be seen in Fig. 11.
Fig. 11.
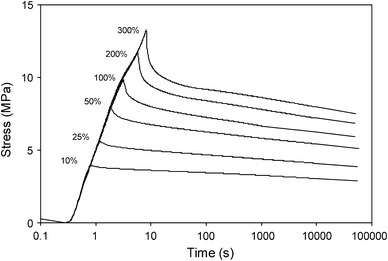
The SR as a function of time and at various strains for PTMO2000–T6A6T
Having reached the applied strain, the stress decay during the first 10 s was sharp, whereafter it became linear on a logarithmic time scale. This implies that the SR for the copolymers in question consisted of two processes: an initial stress decay during the first seconds and a viscoelastic process after 10 s. As the loading of the samples was not instantaneous and the SR is often a log time function (Eq. 4), the initial process was difficult to quantify. The initial stress decay was given as the decrease in stress calculated over the first 100 s as a percentage of the maximum stress (Table 2).
Table 2.
Relaxation properties of PTMO2000–T6A6T
| Strain (%) | Stress decay (σmax − σ100)/σmax (%) | SRn (σ100 − σ10,000)/(σ100 × Δlog t) (%/decade) |
|---|---|---|
| 10 | 12 | 6 |
| 25 | 16 | 6.5 |
| 50 | 21 | 7 |
| 100 | 25 | 7 |
| 200 | 28 | 7 |
| 300 | 31 | 7 |
The second relaxation process was determined as the decay between 100 and 10,000 s, normalised by the stress at 100 s (Eq. 4).
The initial stress decay increased with increasing strain and the values ranged from 12 to 31%. The remaining stress after 100 s was consistently higher than 60%—a high value as compared to other polymer systems [24]. The normalised slope (SRn) of the second relaxation process as a function of the applied strain was fairly constant and thus the second relaxation process was deemed to be independent of the applied strain in the strain range of 10 to 300%.
Rigid segment content
SR experiments at 25% strain were performed for the PTMOx–T6A6T copolymers with varying PTMOx length (Fig. 12).
Fig. 12.
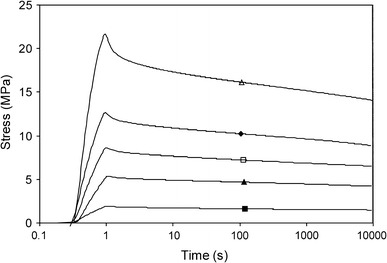
Relaxation values measured at 25% strain for PTMOx–T6A6T with varying length of the PTMO segment: △, PTMO650–T6A6T (44 wt%); ◆, PTMO1000–T6A6T (34 wt%); □, PTMO1400–T6A6T (27 wt%); ▲, PTMO2000–T6A6T (21 wt%); ■, PTMO2900–T6A6T (16 wt%)
By increasing the PTMOx length, the T6A6T content was found to decrease and the modulus was lowered (Table 3).
Table 3.
Relaxation properties of PTMOx–T6A6T at 25% strain
| T6A6T (wt%) | G′ (25°C) (MPa) | Stress decay (σmax − σ100)/σmax (%) | SRn (σ100 − σ10,000)/(σ100 × Δlog t) (% decrease per decade) | |
|---|---|---|---|---|
| Series 1 | ||||
| PTMO650–T6A6T | 44 | 102 | 25 | 6.5 |
| PTMO1000–T6A6T | 34 | 51 | 19 | 6.7 |
| PTMO1400–T6A6T | 27 | 30 | 16 | 5.0 |
| PTMO2000–T6A6T | 21 | 20 | 12 | 6.5 |
| PTMO2900–T6A6T | 16 | 9 | 11 | 4.3 |
The initial stress decay at 25% strain decreased with decreasing T6A6T content and rubber modulus. The normalised SRn values increased somewhat with the increasing T6A6T content in the copolymer and thus with its increasing modulus. Such an increase in SR with the increasing rubber modulus of the polymer has also been observed for segmented poly(ether-block-amide) (PEBAX) TPEs [2, 11] as well as for PTMO with uniform rigid aramid segments [15]. As the normalised SR values were independent of the applied strain and nearly independent of the T6A6T content (modulus), they could be crosschecked with other systems. The SRn value of the PTMOx–T6A6T copolymers compared favourably with results on other TPEs found in the literature [2, 24].
Conclusions
The tensile and elastic properties of segmented copolymers with PTMO flexible segments and uniform rigid segments were studied as functions of temperature and time. A complicating factor was that the long PTMO segments (PTMO2900) were partly crystalline at room temperature and when they were longer than 1000 Da they were able to strain-crystallise at room temperature.
Values of CS and TS increased with increasing modulus of the PTMOx–T6A6T copolymers and were found to be functions of the relaxation time. This suggests that part of the measured set values were viscoelastic in nature. The TS measurements showed a clear transition in the TS values at the yield strain; prior to the yield strain, the TS values were low and viscoelastic in nature, whereas the TS strongly increased and displayed a plastic character above the yield strain.
The CS and TS values increased with increasing temperature, and this effect was stronger during CS, probably due to the longer deformation times of this test. The relaxation with time at high temperatures was more significant and the viscoelastic process was thus faster. At room temperature and at strains higher than 150%, an extra increase in the TS was observed, which was due to a strain-induced crystallisation of PTMO. However, above 50 °C, above the melting temperature of the PTMO, this strain induced crystallization can no longer take place and a strain induced crystallization effect on the TS values was no longer observed. The use of monodisperse amide segments increased the modulus–CS and modulus–TS relationships and lowered the SR.
The SR appeared to consist of two processes: a fast initial decay of the stress during the first 10 s, followed by a second slower relaxation process. Higher strains increased the first process while the second process was independent of the applied strain (or stress). With increasing modulus, the initial decay processes increased, while the normalised SR remained constant. This normalised SR was thus independent of the applied strain and of the modulus of the sample with a value of approximately 5–7% per decade of time. The SR was thought to be mainly due to the time dependant relaxation of amorphous chains in the copolymer.
The crystallizing monodisperse HS in the copolymers had two effects. The soft phase contained only low amount of non crystallized HS and that phase was more elastic. The crystallites of the monodisperse segments that were more resistant to deformation and this probably as all the segments had the same length and crystallites had less thickness variations.
Acknowledgement
This work was financed by the Dutch Polymer Institute (DPI, The Netherlands), project number 137.
Open Access
This article is distributed under the terms of the Creative Commons Attribution Noncommercial License which permits any noncommercial use, distribution, and reproduction in any medium, provided the original author(s) and source are credited.
Footnotes
ASTM designation: D395-89 Standard test methods for rubber property-Compression set.
Contributor Information
G. J. E. Biemond, Email: g.j.e.biemond@alumnus.utwente.nl
Reinoud J. Gaymans, Email: r.j.gaymans@utwente.nl
References
- 1.Holden G, Legge NR, Quirk R, Schroeder HE. Thermoplastic elastomers. Munich: Hanser; 1996. [Google Scholar]
- 2.Fakirov S. Handbook of condensation thermoplastic elastomers. New York: Wiley; 2005. [Google Scholar]
- 3.Hepburn C. Polyurethane elastomers. London: Elsevier; 1992. [Google Scholar]
- 4.Van der Schuur JM, Gaymans RJ. Polymer. 2007;48:1998. doi: 10.1016/j.polymer.2007.01.063. [DOI] [Google Scholar]
- 5.Ward IM. Mechanical properties of solid polymers. New York: Wiley; 1979. [Google Scholar]
- 6.Browstow W, Cornelissen RD. Failure of plastics. Munich: Hanser; 1986. [Google Scholar]
- 7.Hertzberg RW. Deformation and fracture mechanics of engineering materials. New York: Wiley; 1989. [Google Scholar]
- 8.Mc Crum NG, Buckley CP, Bucknall CB. Principles of polymer engineering. New York: Oxford University Press; 2001. [Google Scholar]
- 9.McLean RS, Sauer BB. J Polym Sci Polym Phys. 1999;37:859. doi: 10.1002/(SICI)1099-0488(19990415)37:8<859::AID-POLB11>3.0.CO;2-U. [DOI] [Google Scholar]
- 10.Garrett JT, Runt J, Lin JS. Macromolecules. 2000;33:6353. doi: 10.1021/ma000600i. [DOI] [Google Scholar]
- 11.Seth JP, Xu J, Wilkes GL. Polymer. 2003;44:743. doi: 10.1016/S0032-3861(02)00798-X. [DOI] [Google Scholar]
- 12.Sauer BB, McLean S, Gaymans RJ, Niesten MCEJ. J Polym Sci Polym Phys. 2004;42:1783. doi: 10.1002/polb.20060. [DOI] [Google Scholar]
- 13.Versteegen RM, Kleppinger R, Sijbesma RP, Meijer EW. Macromolecules. 2006;39:772. doi: 10.1021/ma051874e. [DOI] [Google Scholar]
- 14.Van der Schuur JM, Gaymans RJ. J Polym Sci Polym Chem. 2006;44:4769. doi: 10.1002/pola.21587. [DOI] [Google Scholar]
- 15.Niesten MCEJ, Gaymans RJ. Polymer. 2001;42:6199. doi: 10.1016/S0032-3861(01)00088-X. [DOI] [Google Scholar]
- 16.Bonart R, Morbitzer L, Hentze J. J Macromol Sci Phys. 1969;3:337. doi: 10.1080/00222346908205099. [DOI] [Google Scholar]
- 17.Sauer BB, McLean RS, Brill DJ, Londono DJ. J Polym Sci Polym Phys. 2002;40:1727. doi: 10.1002/polb.10234. [DOI] [Google Scholar]
- 18.Niesten MCEJ, Krijgsman J, Harkema S, Gaymans RJ. J Appl Polym Sci. 2001;82:2194. doi: 10.1002/app.2067. [DOI] [Google Scholar]
- 19.Van der Schuur JM, de Boer J, Gaymans RJ. Polymer. 2005;46:9243. doi: 10.1016/j.polymer.2005.07.041. [DOI] [Google Scholar]
- 20.Beck RA, Truss RW. J Appl Polym Sci. 1999;71:959. doi: 10.1002/(SICI)1097-4628(19990207)71:6<959::AID-APP11>3.0.CO;2-#. [DOI] [Google Scholar]
- 21.Kim HD, Lee TJ, Huh JH, Lee DJ. J Appl Polym Sci. 1999;73:345. doi: 10.1002/(SICI)1097-4628(19990718)73:3<345::AID-APP5>3.0.CO;2-T. [DOI] [Google Scholar]
- 22.Khan AS, Lopez-Pamies O. Int J Plast. 2002;18:1359. doi: 10.1016/S0749-6419(02)00003-7. [DOI] [Google Scholar]
- 23.Biemond GJE, Feijen J, Gaymans RJ. J Mater Sci. 2008;43:3689. doi: 10.1007/s10853-008-2592-3. [DOI] [PMC free article] [PubMed] [Google Scholar]
- 24.Le HH, Lupke T, Pham T, Radusch H-J. Polymer. 2003;44:4589. doi: 10.1016/S0032-3861(03)00409-9. [DOI] [Google Scholar]
- 25.Patel M, Soames M, Skinner AR, Stephens TS. Polym Degrad Stabil. 2004;83:111. doi: 10.1016/S0141-3910(03)00231-3. [DOI] [Google Scholar]
- 26.Prisacariu C, Buckley CP, Caraculacu AA. Polymer. 2005;46:3884. doi: 10.1016/j.polymer.2005.03.046. [DOI] [Google Scholar]
- 27.Akinay AE, Brostow W, Castano VM, Maksimov R, Olszynski P. Polymer. 2002;43:3593. doi: 10.1016/S0032-3861(02)00199-4. [DOI] [Google Scholar]
- 28.Biemond JE, Feijen J, Gaymans RJ. J Appl Polym Sci. 2007;105:951. doi: 10.1002/app.26202. [DOI] [Google Scholar]
- 29.Niesten MCEJ, Harkema S, van der Heide E, Gaymans RJ. Polymer. 2001;42:1131. doi: 10.1016/S0032-3861(00)00452-3. [DOI] [Google Scholar]
- 30.Krijgsman J, Husken D, Gaymans RJ. Polymer. 2003;44:7573. doi: 10.1016/j.polymer.2003.09.043. [DOI] [Google Scholar]
- 31.Biemond GJE, Feijen J, Gaymans RJ. J Appl Polym Sci. 2008;90:1389. [Google Scholar]
- 32.Krijgsman J, Gaymans RJ. Polymer. 2004;45:437. doi: 10.1016/j.polymer.2003.11.008. [DOI] [Google Scholar]


