Abstract
Background
Ferroptosis is a kind of programmed cell death that is characterized by iron dependence. It differs from apoptosis, necrosis, autophagy, pyroptosis, and other types of cell death. Some studies have found that most of the genes involved in the regulation of ferroptosis or act as markers of ferroptosis are related to the poor prognosis of cancer patients.
Methods
This study evaluated the expression, mutation, and copy number variation (CNV) of 60 previously reported ferroptosis genes in breast cancer samples from The Cancer Genome Atlas (TCGA) and Gene Expression Omnibus (GEO) databases. Unsupervised clustering of breast cancer samples with ferroptosis genes was performed, followed by enrichment analysis with Gene Set Variation Analysis (GSVA), mutation display, and correlation analysis of clinical characteristics. Based on the analysis of differences among groups, the ferroptosis-related genes were identified, and the consistent clustering of breast cancer samples was performed. The characteristic genes were screened by stochastic forest algorithm and COX analysis, and a ferroptosis score (ferr.score) model was constructed to evaluate the prognosis of breast cancer patients.
Results
Copy number amplification and deletion of ferroptosis genes are common in breast cancer. Breast cancer patients grouped by ferroptosis gene clusters showed significant differences in survival, immune cell infiltration, and enriched Kyoto Encyclopedia of Genes and Genomes (KEGG) signaling pathways. The ferroptosis-related differential genes were identified by comparison among clustering groups of ferroptosis gene. Characteristic genes were screened from these ferroptosis-related differential genes to construct the ferr.score model. The scoring model could accurately distinguish and predict the survival prognosis and immunotherapy efficacy in breast cancer patients.
Conclusions
Ferroptosis plays an important role in the occurrence and development of tumors. According to the ferr.score model, the breast cancer samples can be divided into two groups with significantly different prognoses. These results provide novel insights and ideas for immunotherapy in breast cancer patients.
Keywords: Ferroptosis, breast cancer, consensus clustering, immunity, prognosis
Introduction
In recent years, studies have identified ferroptosis as programmed cell death that differs from apoptosis, scorch death, and necrosis. Ferroptosis is characterized by cell death caused by the accumulation of iron-dependent lipid reactive oxygen species (lip ROS) (1,2). Ferroptosis plays an important role in diseases of the nervous system and the cardiovascular system, as well as in malignancies (3,4). Therefore, ferroptosis has become a research hotspot in recent years. Breast cancer is a malignant tumor that mainly threatens women's health. Chemotherapy drug resistance is an important factor affecting the curative effect of breast cancer. Inducing cancer cell death is a common strategy for cancer treatment (5) and ferroptosis, a novel kind of cell death, may be crucial in the treatment of breast cancer (6,7). In order to explore the role and significance of induced ferroptosis in clinical treatment of breast cancer, the molecular characteristics, clinical prognosis and immunotherapy prediction were analyzed.
This current study explored the expression of 60 ferroptosis genes, these genes have been reported many times. Through consistent clustering, differences in molecular and clinical characteristics between subgroups were explored. However, our study further identified ferroptosis-related differential genes among subgroups and the correlation between these genes and prognosis was analyzed. Therefore, genes involved in the process of ferroptosis were further screened. The ferr.score was calculated and used to categorize patients into high and low score groups, so as to predict immunotherapy response. The construction of this model is different from all previous studies. We present the following article in accordance with the STREGA reporting checklist (available at https://atm.amegroups.com/article/view/10.21037/atm-22-3736/rc).
Methods
Data resources and data preprocessing
TCGA database (https://xenabrowser.net/datapages/) was used to obtain the mRNA expression profile data and CNV information related to breast cancer samples. The clinical data was obtained using the R program cgdsr, while the mutation data was obtained using the R package TCGAbiolinks. The expression profile data of three sets of breast cancer samples were downloaded from the GEO database (https://www.ncbi.nlm.nih.gov/geo/), namely, GSE20685, GSE96058, and GSE25066. Data from the GSE20685 and GSE96058 datasets were combined with the TCGA for analysis. The GSE25066 dataset was used for chemosensitivity analysis. The specific data included in the analysis are shown in Table 1. For the combined TCGA + GSE20685 + GSE96058 clinical information (available at https://cdn.amegroups.cn/static/public/atm-22-3736-1.xls). A total of 60 ferroptosis genes were identified from prior study (8) (available at https://cdn.amegroups.cn/static/public/atm-22-3736-2.xls). The expression data of TCGA used log-transformed transcript per million (TPM) value, and the expression data of GEO used log-transformed expression value. To maintain data consistency, the R package SVA was used to batch correct the TCGA + GSE20685 + GSE96058 transcription data. The study was conducted in accordance with the Declaration of Helsinki (as revised in 2013).
Table 1. Basic sample information of the datasets used.
| Dataset | Number of cancer samples | Number of control samples |
|---|---|---|
| TCGA | 1,072 | 99 |
| GSE20685 | 327 | – |
| GSE96058 | 3,273 | – |
| GSE25066 | 508 | – |
TCGA, The Cancer Genome Atlas.
Unsupervised clustering of 60 ferroptosis genes
The expression of 60 ferroptosis genes was extracted from the TCGA + GSE20685 + GSE96058 datasets to identify different ferroptosis gene modification patterns. Unsupervised array assays were acclimated to analyze altered ferroptosis modification patterns according to the announcement of 57 ferroptosis genes (3 of which were not detected, namely AKR1C2, ATP5MC3, ZEB1). The number and stability of clusters was determined by the uniform clustering algorithm. The consistency analysis was carried out with the R package ConsensusClusterPlus, and 100 repetitions were carried out to ensure the stability of classification.
Gene set variation analysis (GSVA) and single sample gene set enrichment analysis (ssGSEA)
To study the difference in biological function in the process of ferroptosis, GSVA enrichment analysis was performed using R package. GSVA is a nonparametric and unsupervised method, which is mainly acclimated to appraisal the changes in pathway and biological action in samples. For GSVA analyses, the c2.cp.kegg.v7.1.symbols.gmt gene set was downloaded from the MSigDB database (https://www.gsea-msigdb.org/gsea/index.jsp). To evaluate the proportion and differences in 28 kinds of immune cells in the different ferroptosis clusters (ferr.clusters), ssGSEA analysis was conducted using the R package GSVA. The Wilcox test was used to compare the differences among different ferr.cluster samples, and Cox regression analysis was used to compare the prognosis differences.
Identification of differentially expressed genes among different ferr.clusters
Based on the expression of 57 ferroptosis genes, the breast cancer samples in the TCGA + GSE20685 + GSE96058 datasets were divided into 3 categories. The R package limma was used to determine the differentially expressed genes among different groups. The significant standard for identifying the different genes between any two groups was set at P<0.05. Finally, the differentially expressed genes were screened for subsequent analysis.
Calculation of the ferr.score
The redundant genes were removed from the differential genes using the random forest method. The remaining genes were then analyzed for survival, and genes associated with survival outcomes were screened using a P value <0.05. The principal component analysis (PCA) was performed on the remaining genes to calculate the ferr.score using the following formula: ferr.score = PC1 + PC2. The surv cutpoint function in the R package survminer was used to find the best ferr.score classification threshold (cutoff =−0.01079904), after which the samples were divided into two groups with high and low ferr.score, and the correlation between the two groups and prognosis was further investigated.
The correlation between ferr.score and other biological processes
Mariathasan et al. (9) built a series of gene sets to store genes relevant to immunological checkpoints, antigen processing machinery, epithelial-mesenchymal transition (EMT)1, EMT2, EMT3, and other EMT markers, DNA damage repair, mismatch repair, and nucleotide excision repair, among other biological processes. In each sample, GSVA analysis was performed to measure these biological functions (enrichment score, ES). To provide additional light on the relationship between ferr.score and some associated biological pathways, a Pearson correlation analysis was performed between the ferr.score and the ES score of these biological processes.
Analysis of the copy number variation (CNV)
According to SNP6 CopyNumber segment data, the GISTIC approach was used to discover common copy number change locations in all samples. The change significant standard for the GISTIC method parameters was set to Q<0.05. A confidence level of 0.90 was used to determine the peak interval. The analysis was performed using the corresponding MutSigCV module in GenePattern (https://cloud.genepattern.org/gp/pages/index.jsf), an online analysis tool developed by the Broad Institute.
Tumor Immune Dysfunction and Exclusion(TIDE) prediction and submap analysis
TIDE (http://tide.dfci.harvard.edu/), a technique created by Harvard researchers, was used to assess the clinical consequences of immunosuppressive medication. A higher tumor TIDE predictive score is associated with poor efficacy of immunosuppressive therapy and poor prognosis. The prognosis of the immune checkpoint inhibitors was predicted using the TIDE score. The equivalent submap module in GenePattern was used to examine the similarity between subclasses to compare the findings of high-risk and low-risk groups with those of immune response groups predicted by TIDE.
Statistical analysis
The Wilcoxon test was used to compare differences between the two groups in the significance analysis of the various score. The prognosis analysis survival curve was generated using the Kaplan-Meier technique, and the significance of the difference was determined using the log-rank test. P<0.05 was considered statistically significant. The area under the curve (AUC) of the receiver operating characteristic (ROC) curve was calculated using the R package pROC. The R package maftools was used to visualize the mutation landscape of patients with high and low ferr.score subtypes on the mutation map. The R package RCircos was used to map the distribution of 60 ferroptosis genes across 23 pairs of chromosomes.
Results
Genetic variation of ferroptosis genes in TCGA breast cancer data
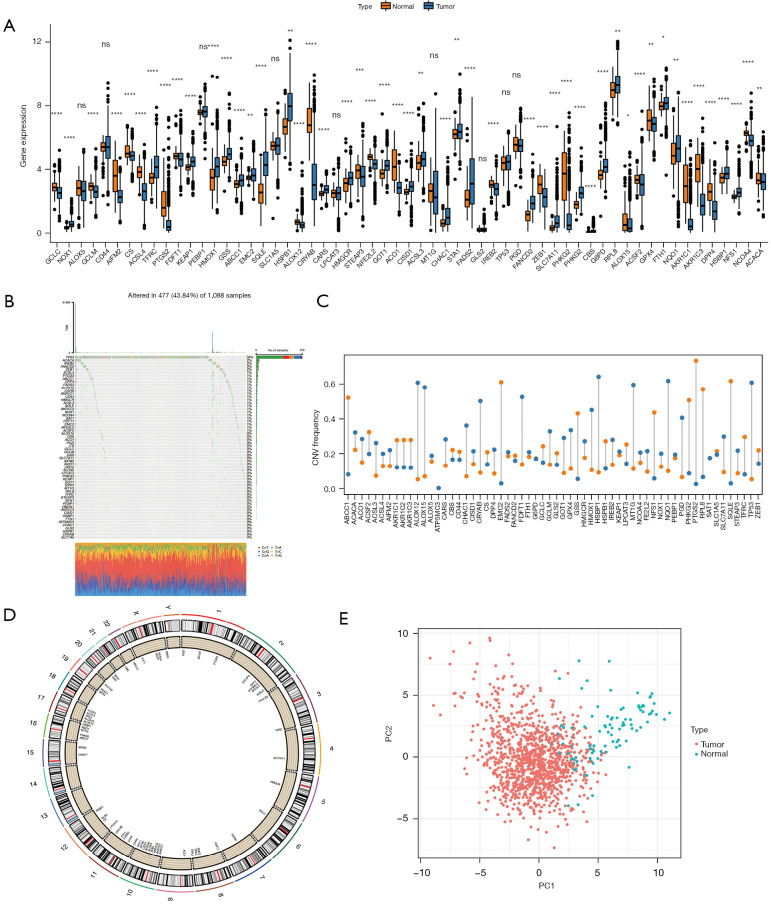
The mRNA expression of 60 ferroptosis genes in cancer samples and normal samples was examined and compared using TCGA data. The mRNA levels of ATP5MC3 could not be detected in cancer samples nor normal samples, so it was not analyzed. The mRNA expression of shock protein B-1 (HSPB1), ribosomal protein L8 (RPL8), and others, were considerably elevated in tumor samples compared to healthy samples (Figure 1A, available at https://cdn.amegroups.cn/static/public/atm-22-3736-3.xls). The incidence of CNVs and somatic mutations in the ferroptosis genes in breast cancer samples was analyzed and TP53 was found to have the highest mutation frequency (Figure 1B, available at https://cdn.amegroups.cn/static/public/atm-22-3736-4.xls). The CNV copy number amplification was common in the PTGS2 and EMC2 genes, and CNV deletion was common in the ALOX12 and ALOX15 genes (Figure 1C, available at https://cdn.amegroups.cn/static/public/atm-22-3736-5.xls). Furthermore, the chromosomal location of 60 ferroptosis genes was assessed (Figure 1D). PCA analysis demonstrated that the ferroptosis genes could better distinguish cancer from normal sample data (Figure 1E).
Figure 1.
Genetic variation of ferroptosis genes. (A) The expression of ferroptosis genes in TCGA tumor samples and normal samples. (B) The distribution and type of mutations in ferroptosis genes. (C) The frequency of occurrence of CNVs in ferroptosis genes, with blue indicating deletions and orange indicating amplifications. (D) The chromosomal location of 60 ferroptosis genes. (E) The PCA results of ferroptosis genes in TCGA samples. ns (not significant) stands for P>0.05, *, P<0.05; **, P<0.01; ***, P<0.001; ****, P<0.0001. TCGA, The Cancer Genome Atlas; CNV, copy number variation; PCA, principle component analysis.
Unsupervised clustering of ferroptosis genes in breast cancer samples (TCGA + GSE20685 + GSE96058)
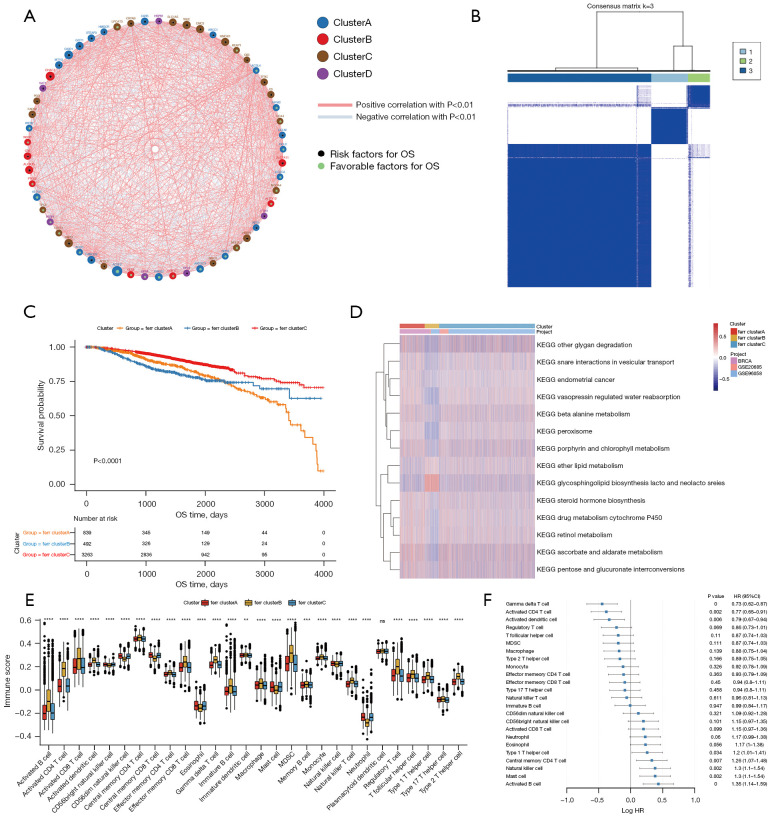
Data related to the expression levels of AKR1C2, ATP5MC3, and ZEB1 were absent in some of the datasets. Therefore, the expression profile data and survival information of 57 ferroptosis genes in the samples downloaded from the TCGA + GSE20685 + GSE96058 dataset was used for consistency clustering and univariate Cox analysis of ferroptosis genes. The genes with black spots in Figure 2A were positively correlated with prognosis. The ferroptosis gene regulatory network depicts the interaction of various genes as well as the relationship between regulatory variables and prognosis. Its effect on the prognosis of breast cancer patients is shown in https://cdn.amegroups.cn/static/public/atm-22-3736-6.xls. The expression of these genes showed a significant correlation with the prognosis of breast cancer patients (available at https://cdn.amegroups.cn/static/public/atm-22-3736-6.xls). These results suggested that the interaction between different functional classes of ferroptosis genes may play an important role in breast cancer.
Figure 2.
Unsupervised clustering of ferroptosis genes in breast cancer samples. (A) The interaction between ferroptosis genes. The size of the circle indicates the effect of each gene on survival prediction, and the greater the expression, the more relevant the prognosis. Green dots in a circle represent prognostic protective factors, and black dots in a circle represent prognostic risk factors. The lines linking the genes show their interactions, and negative correlation is denoted by blue, while positive correlation is denoted by red. (B) Consistent clustering of ferroptosis genes, where 1, 2, and 3 represent the 3 ferr.cluster subgroups. (C) Kaplan-Meier curves show significant survival differences among the 3 ferr.cluster subgroups. (D) GSVA enrichment analysis demonstrating biological pathway activity in various ferr.cluster subgroups. Thermograms are used to visualize these biological processes, with red representing activation and blue representing inhibition. (E) The distribution and immune infiltration of 28 immune cell types in the 3 ferr.cluster subgroups. (F) An analysis of the prognosis of differential cells. In the figures, ns (not significant) stands for P>0.05, **, P<0.01; ***, P<0.001; ****, P<0.0001. GSVA, Gene Set Variation Analysis.
The expression data of 57 genes was extracted from the TCGA + GSE20685 + GSE96058 expression profile of breast cancer samples and the R package ConsensusClusterPlus was used for consistent clustering. Three subgroups were identified, namely, ferr.clusterA, ferr.clusterB, and ferr.clusterC (Figure 2B, available at https://cdn.amegroups.cn/static/public/atm-22-3736-7.xls). These 3 subgroups showed significant differences in prognosis (Figure 2C).
To explore the biological functions of the different ferr.clusters, GSVA enrichment analysis was performed. There were significant differences in glycosphingolipid biosynthesis, peroxisome, and other biological processes among the three groups (Figure 2D, available at https://cdn.amegroups.cn/static/public/atm-22-3736-8.xls). Furthermore, as shown in Figure 2E, the sample expression profile data was used for ssGSEA analysis to determine the infiltration score of 28 different immune cell types (including B cells memory, activated dendritic cells, and M0 macrophages) in breast cancer samples. Single-factor Cox analysis of 24 immune cells with infiltration differences in the 3 ferr.clusters subgroups showed that there were significant differences in the prognosis between these immune cells.(Figure 2F, available at https://cdn.amegroups.cn/static/public/atm-22-3736-9.xls).
The distribution of clinical features and functional enrichment scores differed among the ferr.cluster subgroups
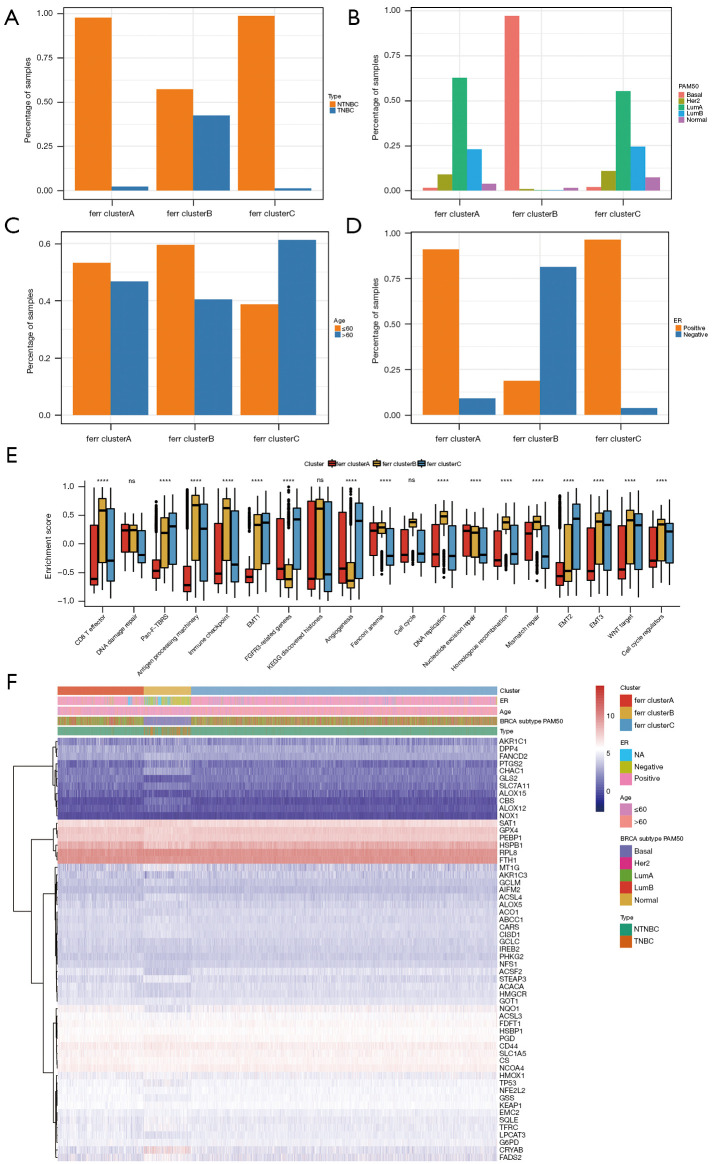
In the TCGA + GSE96058 datasets (GSE20685 was not included due to a lack of clinical information), significant differences in the proportion of triple-negative breast cancer (TNBC), PAM50 subtype, age, and ER+/− status were detected among the three ferr.cluster subgroups. In addition, TNBC, basal-like breast cancer, and ER− breast cancer were specifically concentrated in the ferr.clusterB (Figure 3A-3D, available at https://cdn.amegroups.cn/static/public/atm-22-3736-10.xls). Subsequently, the gene set constructed by Mariathasan et al. (9) was used to perform GSVA analysis (Figure 3E, available at https://cdn.amegroups.cn/static/public/atm-22-3736-11.xls), and the enrichment scores of different ferr.cluster groups were found to be significantly different. The enrichment scores of ferr.clusterB were consistently higher than those of ferr.clusterA and ferr.clusterC, suggesting that ferr.clusterB had a poor prognosis. The expression patterns of ferroptosis genes in ferr.clusterB were significantly different from ferr.clusterA and ferr.clusterC. (Figure 3F and available at https://cdn.amegroups.cn/static/public/atm-22-3736-12.xls).
Figure 3.
Comparative analysis between ferr.cluster subgroups using TCGA data. (A-D) The clinical characteristics of TNBC, PAM50, age and ER+/− were compared among 3 ferr.cluster subgroups. (E) The differences in enrichment scores among the different ferr.cluster subgroups. (F) The expression of ferroptosis-related genes in the ferr.cluster subgroups. ns (not significant) stands for P>0.05; ****, P<0.0001. TNBC, triple negative breast cancer; ER, estrogen receptor.
Differential genes related to ferroptosis gene
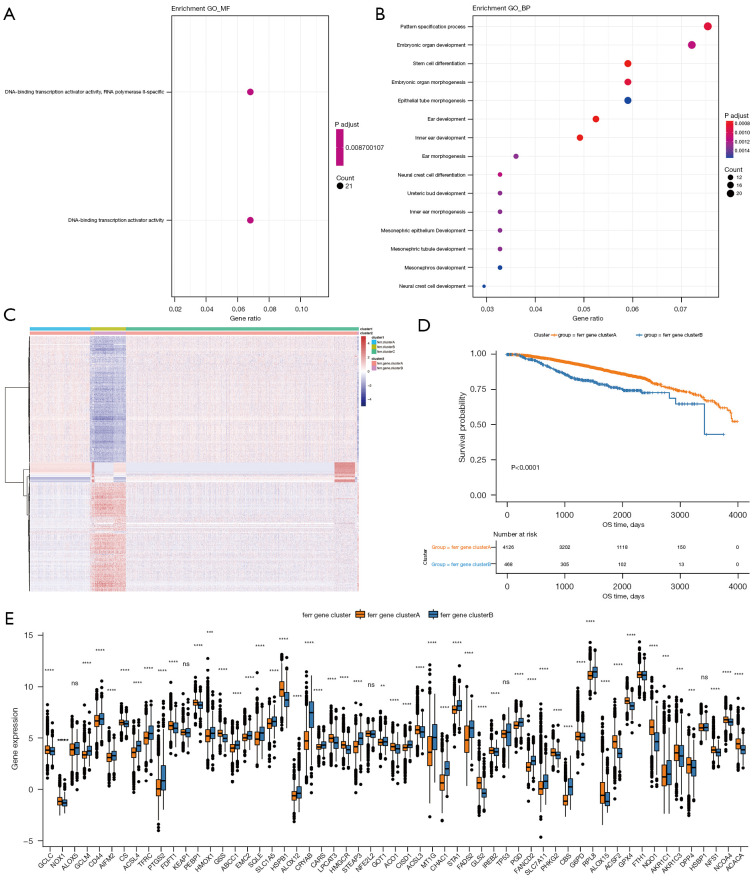
To further study the potential biological role of each ferr.cluster, the R package limma software was used to identify 393 ferroptosis-related differential genes (available at https://cdn.amegroups.cn/static/public/atm-22-3736-13.xls). These differential genes are mainly related to stem cell differentiation and DNA binding activator of transcription (Figure 4A,4B, available at https://cdn.amegroups.cn/static/public/atm-22-3736-14.xls).
Figure 4.
A comparison of the biological processes and prognosis between different ferr.gene.clusters. (A,B) The results of Gene Ontology enrichment analysis of the differential genes. (C) Unsupervised clustering of differential genes in the ferr.cluster subgroups into ferr.gene.clusterA and ferr.gene.clusterB. (D) The Kaplan-Meier curve shows a significant difference in overall survival between ferr.gene.clusterA and ferr.gene.clusterB. (E) The expression of ferroptosis genes in ferr.gene.clusterA and ferr.gene.clusterB. The top and bottom of the box represent a range of quartiles for the value. The line in the box represents the median, and the black dot represents the outlier. In the figures, ns (not significant) stands for P>0.05; **, P<0.01; ***, P<0.001; ****, P<0.0001.
Unsupervised cluster analysis was used to divide the patients into various genomic subgroups based on the expression of ferroptosis-related differential genes. The consistent clustering results revealed two different subgroups, which are named ferr.gene.clusterA and ferr.gene.clusterB (Figure 4C, available at https://cdn.amegroups.cn/static/public/atm-22-3736-15.xls). Coincidentally, the breast cancer samples in ferr.gene.clusterB corresponded to most of the previous ferr.clusterB samples. In addition, there was a significant difference in prognosis between the two groups (Figure 4D). The expression of most ferroptosis genes was also significantly different between the two groups (Figure 4E).
Analysis of the ferr.score
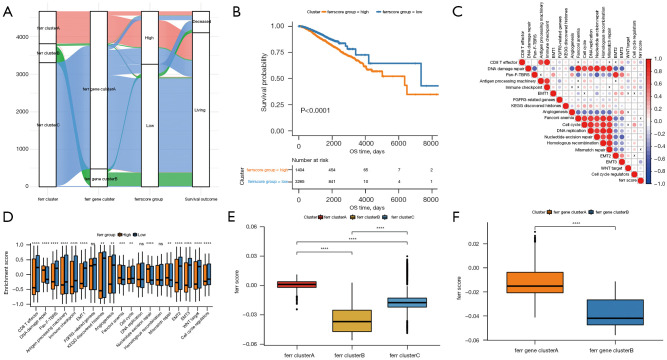
The random forest technique was used to reduce redundancy in the ferroptosis-related differential genes identified above, and the most relevant characteristic genes were selected (available at https://cdn.amegroups.cn/static/public/atm-22-3736-16.xls). Cox regression analysis was used to determine the relationship between these genes and the survival of the samples, and genes related to prognosis were screened. The ideal ferr.score classification threshold point (cutoff =−0.01079904) was established using the surv cutpoint function in the R package survminer, and the data were separated into a high ferr.score group and a low ferr.score group (Figure 5A, available at https://cdn.amegroups.cn/static/public/atm-22-3736-17.xls). As shown in Figure 5B, the group with high ferr.score was associated with poor prognosis. Mariathasan et al. (9) developed a correlation study between the ferr.score and known genetic traits, which revealed that the ferr.score was substantially adversely linked with biological processes like EMT3 (Figure 5C, available at https://cdn.amegroups.cn/static/public/atm-22-3736-18.xls). The expression of these characteristic genes enrichment score in the high and low ferr.score groups is shown in Figure 5D. The enrichment analysis of characteristic genes in biological processes showed that CD8+ effector T cell and immune checkpoint enrichment score were significantly lower than those of low ferr.score group. These results showed that the ferroptosis characteristic genes are closely related to the immune microenvironment. There were significant differences between the ferr.cluster and the ferr.gene.cluster in terms of the ferr.score (Figure 5E,5F). Ferr.clusterB had a much lower ferr.score compared to ferr.clusterA and ferr.clusterC, while ferr.gene.clusterB had a significantly lower ferr.score compared to ferr.gene.clusterB. These results demonstrated that the ferr.score model can be used as a standard to predict the prognosis of breast cancer patients.
Figure 5.
Building the ferr.score model. (A) An alluvial diagram, where each column represents a characteristic variable, with different colors representing different subtypes or groupings, and lines representing the distribution of the same sample in different ferr.cluster, ferr.gene.cluster, and ferr.score. (B) The Kaplan-Meier curve shows a significant correlation between the high and low ferr.score groups and overall survival. (C) Pearson correlation was used to analyze the correlation between ferr.score and known genetic characteristics in breast cancer. Negative correlation denoted by blue and positive correlation is denoted by red. The X indicated in the graph shows no significant correlation, and the larger the circle, the more significant it is. (D) The distribution of the enrichment scores of the known gene features in the samples in the high and low ferr.score groups. (E,F) The distribution of ferr.scores in the different ferr.gene.clusters. In the figures, ns (not significant) stands for P>0.05; **, P<0.01; ***, P<0.001; ****, P<0.0001.
The ferr.score was significantly different in among classification subgroups
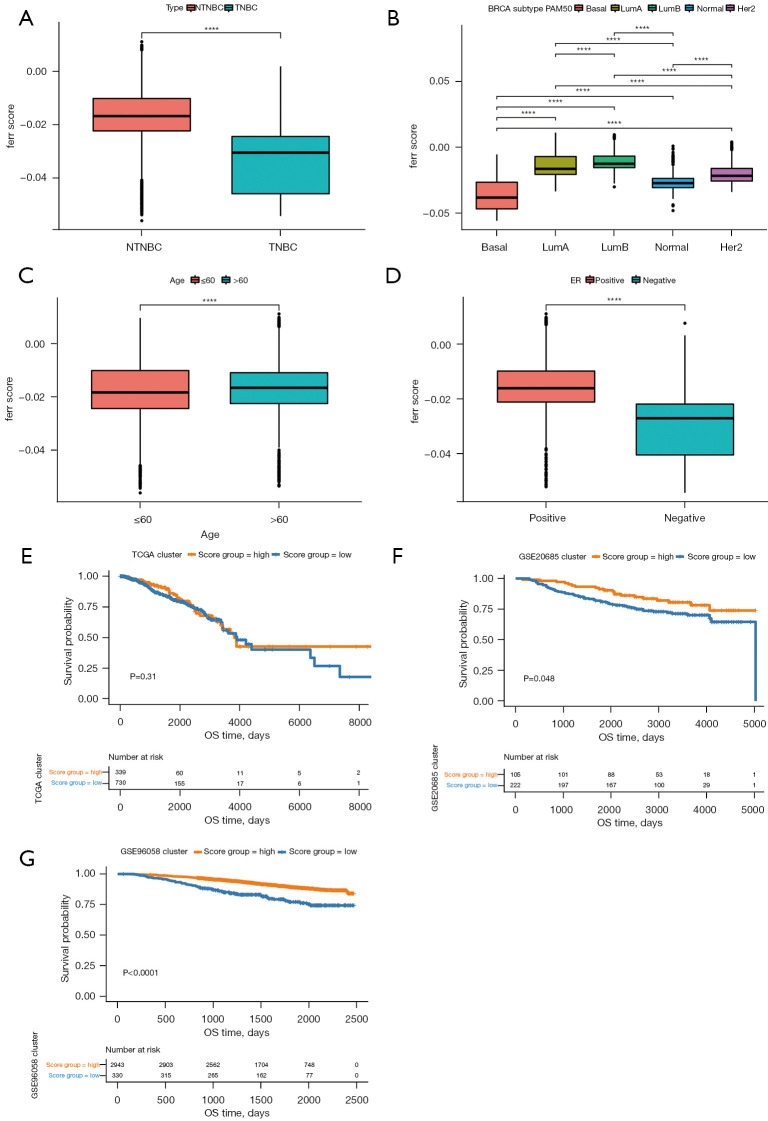
To further evaluate the reliability of the ferr.score model, the ferr.score was found to be significantly different among classification subgroups, including TNBC, PAM50 classification, age, and ER+/− in the TCGA and GSE96058 dataset (Figure 6A-6D). The ferr.score of TNBC was lower than the ferr.score of non-TNBC samples, indicating that TNBC has a poorer prognosis. It is worth noting that basal-like breast cancers had lower ferr.score than other types of breast cancers and there was an inseparable relationship between age and ferr.score. Consistently, ER negative breast cancer patients had significantly lower ferr.score compared to ER positive breast cancer patients. In addition, the prognostic differences between the high and low ferr.score subgroups were analyzed in different PAM50 subtypes (Figure S1). Interestingly, there were significant prognostic differences between the high and low ferr.score subgroups for almost all breast cancer subtypes. Due to the lack of sample size and inadequate follow-up, the differences between high and low ferr.score in the prognosis of basal-like breast cancer did not reach the statistical standard, but a certain trend was observed. Other kinds of breast cancer with a high ferr.score, with the exception of basal-like breast cancer, were associated with a poor prognosis. The overall survival times of patients with high and low ferr.scores were analyzed using the TCGA, GSE96058, and GSE20685 datasets. There were significant differences in the prognosis between the high and low ferr.score groups only in the GSE96058 and GSE20685 datasets (Figure 6E-6G). These results suggested that the ferr.score model can effectively predict the prognosis of patients with different types of breast cancer.
Figure 6.
Comparative analysis and model verification of the ferr.score using the TCGA and GSE96058 datasets. (A-D) The distribution of ferr.scores in different classification subgroups. (E-G) Survival curves among high and low ferr.score groups of TCGA, GSE20685 and GSE96058 samples. ****, P<0.0001. TCGA, The Cancer Genome Atlas; ER, estrogen receptor.
Analysis of the molecular characteristics of the high and low ferr.score groups using the TCGA dataset
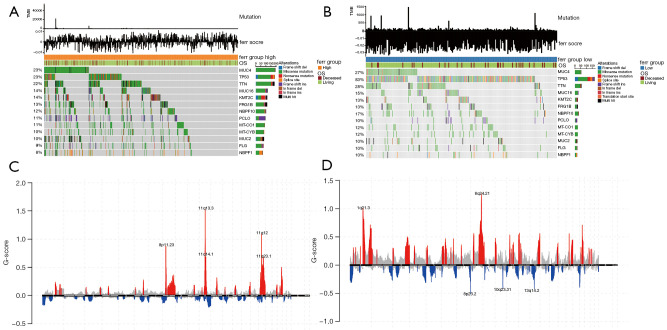
The differences between the high and low ferr.score groups were further explored using the TCGA dataset. The differences in somatic mutations between the high and low ferr.score groups were analyzed using the R package maftools. As shown in Figure 7A,7B, the results demonstrated the distribution of common breast cancer mutations in two groups of samples. Overall, patients with a high ferr.score had a higher frequency of mutations compared to patients with a low ferr.score. This suggested that patients in the high ferr.score group are more sensitive to targeted therapy compared to patients in the low ferr.score group. In addition, the distribution of CNV areas in breast cancer samples from the two groups was examined (Figure 7C,7D). The results revealed that the high ferr.score group had amplified copy number focused on chromosomes 8, 11, and 17, which were more concentrated than the low ferr.score group. However, the distribution of CNV regions of the low ferr.score group was more widespread and accompanied by a large number of copy deletions. In conclusion, the poor prognosis of the low ferr.score group may be associated with low mutation frequency and a high copy number of genes in the whole sample.
Figure 7.
Analysis of the molecular characteristics of the high and low ferr.score groups using the TCGA data. (A,B) The distribution of gene mutations in samples with high and low ferr.scores. (C,D) The distribution of copy number and amplification of deletion regions in samples with high and low ferr.scores. (C) The group with high ferr.score; (D) the group with low ferr.score. TMB, tumor mutation burden.
The effect of immunotherapy in the high and low ferr.score groups
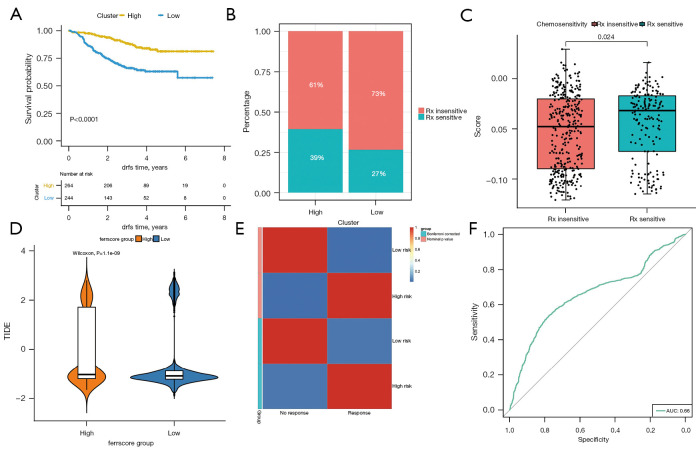
The expression profile information in the GSE25066 dataset was used to construct the risk score of each sample, so as to examine the effect of immunotherapy in the high and low ferr.score groups (available at https://cdn.amegroups.cn/static/public/atm-22-3736-19.xls). The surv_cutpoint in the R package survminer was used to determine the classification threshold, and 508 samples were divided into high and low groups according to the optimal threshold (cut off =−0.04353742). There were significant differences in the prognosis between the two groups (Figure 8A). The findings revealed that distant recurrence-free survival (DRFS) was significantly lower in the low ferr.score group compared to the high ferr.score group. Furthermore, there were significant differences in immunotherapy between the high and low groups (Figure 8B), and there were also significant differences in the risk score between the immunotherapy sensitivity and immunotherapy insensitivity groups (Figure 8C).
Figure 8.
Efficacy of immunotherapy in the high and low ferr.score groups. (A) There was a significant difference in DRFS between the high and low risk groups. (B) There was a significant difference in immunotherapy response between the high and low risk groups. (C) The distribution of risk scores among different immunotherapy response groups. (D) The difference in TIDE scores in samples with high and low ferr.score (using the TCGA + GSE20685 + GSE96058 dataset). (E) The results of submap analysis. (F) The prediction of immunotherapy response using the ferr.score (performed using the TCGA + GSE20685 + GSE96058 dataset). DRFS, distant recurrence-free survival; TCGA, The Cancer Genome Atlas.
The TIDE (http://tide.dfci.harvard.edu/) was used to evaluate the clinical effect of immunotherapy in the two groups of samples based on the mRNA expression profile data. As shown in Figure 8D and available at https://cdn.amegroups.cn/static/public/atm-22-3736-20.xls, there was a significant difference in TIDE scores between the high ferr.score group and the low ferr.score group. Patients with high ferr.score were associated with a positive TIDE prediction result, suggestive of responsiveness to immunotherapy (Figure 8E). The ferr.score was used to predict the response to immunotherapy, and the area under the ROC curve reached 0.66 (Figure 8F). These results suggested that patients with low ferr.score are not sensitive to immunotherapy.
Discussion
Breast cancer is the most frequent disease in women and the main cause of cancer-related mortality globally (10). Breast cancer has been reported to be associated with abnormal expression of oncogenes (11). Selective induction of cancer cell death is the most effective method for the treatment of malignant tumors. Ferroptosis is a kind of cell death, which is different from other programmed cell death. Ferroptosis shows unique morphological characteristics, such as mitochondrial atrophy and increased mitochondrial membrane density. The physiological function of ferroptosis is lacking and remains to be discovered, and in recent years, much effort has focused on investigating the potential mechanism of ferroptosis (12-14). The influencing factors of ferroptosis include iron, lipid reactive oxygen species, and glutathione peroxidase 4 (GPX4). Although the signaling pathways that induce ferroptosis vary, the upstream pathways directly or indirectly affect these three factors (15). GPX4 is the key protein affecting ferroptosis. Erastin inhibits GPX4 activity by consuming glutathione (GSH), while RSL3 directly inhibits GPX4 activity (16,17). Lipid oxides cannot be metabolized by GPX4 -catalyzed glutathione reductase, and then divalent iron ions oxidize the lipid to generate reactive oxygen species, thereby contributing to ferroptosis,
Data from TCGA was used to compare the mRNA expression levels of 60 ferroptosis-related genes in cancer samples and normal control samples. The expression of HSPB1 and RPL8 was significantly elevated in tumor samples compared to control healthy samples. Shock protein B-1 (HSPB1) is a negative regulator, which can lead to ferroptosis of cancer cells. Erastin can cause ferroptosis in malignant cells and induce the overexpression of HSPB1 that is reliant on heat shock factor 1 (HSF1) (18). Pretreatment with heat shock and overexpression of HSPB1 reduced erastin-induced ferroptosis, but suppression of HSF1 and HSPB1 expression increased ferroptosis (18). In recent years, studies have shown that p53 is a regulatory factor of ferroptosis. By interfering with single nucleotide polymorphism, long-chain non-coding RNA, and SOCS1 (cytokine signal inhibitor), P53 induce a range of biochemical properties which are essential for regulating ferroptosis and apoptosis (19,20). P53 promotes ferroptosis by inhibiting SLC7A11 and increasing the expression of SAT1 (spermine/spermine N1 acetyltransferase 1) and GLS2 (glutaminase 2) (21,22). Alox12 inactivation reduced p53-mediated ferroptosis that was induced by reactive oxygen species in stress and eliminated p53 dependent tumor growth inhibition in the xenotransplantation model, suggesting that ALOX12 is essential for p53-mediated ferroptosis (23).
Using consistent clustering to investigate variations in molecular and clinical features among distinct subgroups, it was found that the prognosis of different subgroups was significantly different. There were also significant differences among subgroups in the distribution of TNBC, PAM50, age, and ER+/− samples. Comparing the distribution of these clinical features in three ferr.clusters revealed that the expression of ferroptosis genes is closely related to the prognosis of breast cancer, and prognosis is closely related to TNBC, PAM50 classification, age, and ER+/−. In addition, this study further identified the differentially expressed ferroptosis-related genes among subgroups, and determined the correlation between genes and prognosis. The ferr.score was calculated for each sample and prognostic differences between the high and low ferr.score subgroup samples in different PAM50 subtypes were examined. The results showed that in the basal subgroup, the prognosis of patients with low ferr.score was worse, while in other subgroups, the prognosis of patients with low ferr.score was better. This may be related to the lack of special treatment for TNBC. These results suggested that the ferr.score model can effectively distinguish different subgroups of breast cancer and predict patient prognosis.
Immunotherapy is a cancer treatment approach that triggers an anticancer response by using the human immunological system (24). Tumor cells will exhibit an anti-tumor immune response in the process of tumor development. This mechanism largely involves the suppression of immune cell activity and reduction of cancer cell immunogenicity to achieve immune escape. The potential antitumor immune response can be triggered by blocking the immunosuppressive mechanism and the function of immunosuppressive cells (25). In recent years, the relationship between ferroptosis and tumor immunity has been gradually recognized. Studies have shown that inducing ferroptosis in tumor cells can effectively increase the efficacy of immunotherapy (26-28). In the current study, the ferr.score model was used to predict the outcome of breast cancer immunotherapy response. There were significant differences in prognosis and immunotherapy response between the high and low ferr.score groups. These results provided novel insights and ideas for breast cancer immunotherapy, and indeed, patients with high ferr.scores may benefit from immune checkpoint inhibitor therapy. However, the reliability of this model needs more verification. In conclusion, ferroptosis plays an important role in tumorigenesis and development in breast cancer.
Conclusions
This study constructed a grouping model of ferroptosis-related characteristic genes. Significant differences were found in prognosis, clinical characteristics, and molecular characteristics between patients with different ferr.gene.clusters and ferr.scores. The ssGSEA method showed that ferroptosis was closely related to tumor immunity and patients with a high ferr.score may benefit more from immune checkpoint inhibitor therapy. This report provides novel insights and ideas for immunotherapy in the treatment of patients with breast cancer.
Supplementary
The article’s supplementary files as
Acknowledgments
Funding: This work was supported by grants from the National Natural Science Foundation of China to SN (No. 81702608), the Nantong Science and Technology Project to SN (No. JC2019144), the Research Project of Maternal and Child Health of Jiangsu Province to ZH (No. F201953), and the Science and Technology Project of Nantong to ZH (No. JC2020067).
Ethical Statement: The authors are accountable for all aspects of the work in ensuring that questions related to the accuracy or integrity of any part of the work are appropriately investigated and resolved. The study was conducted in accordance with the Declaration of Helsinki (as revised in 2013).
Reporting Checklist: The authors have completed the STREGA reporting checklist. Available at https://atm.amegroups.com/article/view/10.21037/atm-22-3736/rc
Conflicts of Interest: All authors have completed the ICMJE uniform disclosure form (available at https://atm.amegroups.com/article/view/10.21037/atm-22-3736/coif). The authors have no conflicts of interest to declare.
(English Language Editor: J. Teoh)
References
- 1.Chen X, Li J, Kang R, et al. Ferroptosis: machinery and regulation. Autophagy 2021;17:2054-81. 10.1080/15548627.2020.1810918 [DOI] [PMC free article] [PubMed] [Google Scholar]
- 2.Liu J, Kang R, Tang D. Signaling pathways and defense mechanisms of ferroptosis. FEBS J 2021. [Epub ahead of print]. doi: . 10.1111/febs.16059 [DOI] [PubMed] [Google Scholar]
- 3.Wang X, Wang Z, Cao J, et al. Ferroptosis Mechanisms Involved in Hippocampal-Related Diseases. Int J Mol Sci 2021;22:9902. 10.3390/ijms22189902 [DOI] [PMC free article] [PubMed] [Google Scholar]
- 4.Li J, Cao F, Yin HL, et al. Ferroptosis: past, present and future. Cell Death Dis 2020;11:88. 10.1038/s41419-020-2298-2 [DOI] [PMC free article] [PubMed] [Google Scholar]
- 5.Nedeljković M, Damjanović A. Mechanisms of Chemotherapy Resistance in Triple-Negative Breast Cancer-How We Can Rise to the Challenge. Cells 2019;8:957. 10.3390/cells8090957 [DOI] [PMC free article] [PubMed] [Google Scholar]
- 6.Sun LL, Linghu DL, Hung MC. Ferroptosis: a promising target for cancer immunotherapy. Am J Cancer Res 2021;11:5856-63. [PMC free article] [PubMed] [Google Scholar]
- 7.Li Z, Chen L, Chen C, et al. Targeting ferroptosis in breast cancer. Biomark Res 2020;8:58. 10.1186/s40364-020-00230-3 [DOI] [PMC free article] [PubMed] [Google Scholar]
- 8.Lin R, Fogarty CE, Ma B, et al. Identification of ferroptosis genes in immune infiltration and prognosis in thyroid papillary carcinoma using network analysis. BMC Genomics 2021;22:576. 10.1186/s12864-021-07895-6 [DOI] [PMC free article] [PubMed] [Google Scholar]
- 9.Mariathasan S, Turley SJ, Nickles D, et al. TGFβ attenuates tumour response to PD-L1 blockade by contributing to exclusion of T cells. Nature 2018;554:544-8. 10.1038/nature25501 [DOI] [PMC free article] [PubMed] [Google Scholar]
- 10.Zu C, Zhang M, Xue H, et al. Emodin induces apoptosis of human breast cancer cells by modulating the expression of apoptosis-related genes. Oncol Lett 2015;10:2919-24. 10.3892/ol.2015.3646 [DOI] [PMC free article] [PubMed] [Google Scholar]
- 11.Zu C, Qin G, Yang C, et al. Low dose Emodin induces tumor senescence for boosting breast cancer chemotherapy via silencing NRARP. Biochem Biophys Res Commun 2018;505:973-8. 10.1016/j.bbrc.2018.09.045 [DOI] [PubMed] [Google Scholar]
- 12.Tang D, Chen X, Kang R, et al. Ferroptosis: molecular mechanisms and health implications. Cell Res 2021;31:107-25. 10.1038/s41422-020-00441-1 [DOI] [PMC free article] [PubMed] [Google Scholar]
- 13.Jiang M, Hu R, Yu R, et al. A narrative review of mechanisms of ferroptosis in cancer: new challenges and opportunities. Ann Transl Med 2021;9:1599. 10.21037/atm-21-4863 [DOI] [PMC free article] [PubMed] [Google Scholar]
- 14.Wang H, Cheng Y, Mao C, et al. Emerging mechanisms and targeted therapy of ferroptosis in cancer. Mol Ther 2021;29:2185-208. 10.1016/j.ymthe.2021.03.022 [DOI] [PMC free article] [PubMed] [Google Scholar]
- 15.Angeli JPF, Shah R, Pratt DA, et al. Ferroptosis Inhibition: Mechanisms and Opportunities. Trends Pharmacol Sci 2017;38:489-98. 10.1016/j.tips.2017.02.005 [DOI] [PubMed] [Google Scholar]
- 16.Ding Y, Chen X, Liu C, et al. Identification of a small molecule as inducer of ferroptosis and apoptosis through ubiquitination of GPX4 in triple negative breast cancer cells. J Hematol Oncol 2021;14:19. 10.1186/s13045-020-01016-8 [DOI] [PMC free article] [PubMed] [Google Scholar]
- 17.Lee N, Carlisle AE, Peppers A, et al. xCT-Driven Expression of GPX4 Determines Sensitivity of Breast Cancer Cells to Ferroptosis Inducers. Antioxidants (Basel) 2021;10:317. 10.3390/antiox10020317 [DOI] [PMC free article] [PubMed] [Google Scholar]
- 18.Sun X, Ou Z, Xie M, et al. HSPB1 as a novel regulator of ferroptotic cancer cell death. Oncogene 2015;34:5617-25. 10.1038/onc.2015.32 [DOI] [PMC free article] [PubMed] [Google Scholar]
- 19.Li T, Liu X, Jiang L, et al. Loss of p53-mediated cell-cycle arrest, senescence and apoptosis promotes genomic instability and premature aging. Oncotarget 2016;7:11838-49. 10.18632/oncotarget.7864 [DOI] [PMC free article] [PubMed] [Google Scholar]
- 20.Jennis M, Kung CP, Basu S, et al. An African-specific polymorphism in the TP53 gene impairs p53 tumor suppressor function in a mouse model. Genes Dev 2016;30:918-30. 10.1101/gad.275891.115 [DOI] [PMC free article] [PubMed] [Google Scholar]
- 21.Guan Z, Chen J, Li X, et al. Tanshinone IIA induces ferroptosis in gastric cancer cells through p53-mediated SLC7A11 down-regulation. Biosci Rep 2020;40:BSR20201807. 10.1042/BSR20201807 [DOI] [PMC free article] [PubMed] [Google Scholar]
- 22.Kang R, Kroemer G, Tang D. The tumor suppressor protein p53 and the ferroptosis network. Free Radic Biol Med 2019;133:162-8. 10.1016/j.freeradbiomed.2018.05.074 [DOI] [PMC free article] [PubMed] [Google Scholar]
- 23.Chu B, Kon N, Chen D, et al. ALOX12 is required for p53-mediated tumour suppression through a distinct ferroptosis pathway. Nat Cell Biol 2019;21:579-91. 10.1038/s41556-019-0305-6 [DOI] [PMC free article] [PubMed] [Google Scholar]
- 24.Hegde PS, Chen DS. Top 10 Challenges in Cancer Immunotherapy. Immunity 2020;52:17-35. 10.1016/j.immuni.2019.12.011 [DOI] [PubMed] [Google Scholar]
- 25.Seliger B, Massa C. Immune Therapy Resistance and Immune Escape of Tumors. Cancers (Basel) 2021;13:551. 10.3390/cancers13030551 [DOI] [PMC free article] [PubMed] [Google Scholar]
- 26.Wang W, Green M, Choi JE, et al. CD8+ T cells regulate tumour ferroptosis during cancer immunotherapy. Nature 2019;569:270-4. 10.1038/s41586-019-1170-y [DOI] [PMC free article] [PubMed] [Google Scholar]
- 27.Zhao L, Zhou X, Xie F, et al. Ferroptosis in cancer and cancer immunotherapy. Cancer Commun (Lond) 2022;42:88-116. 10.1002/cac2.12250 [DOI] [PMC free article] [PubMed] [Google Scholar]
- 28.Ni S, Yuan Y, Kuang Y, et al. Iron Metabolism and Immune Regulation. Front Immunol 2022;13:816282. 10.3389/fimmu.2022.816282 [DOI] [PMC free article] [PubMed] [Google Scholar]
Associated Data
This section collects any data citations, data availability statements, or supplementary materials included in this article.
Supplementary Materials
The article’s supplementary files as


