Abstract
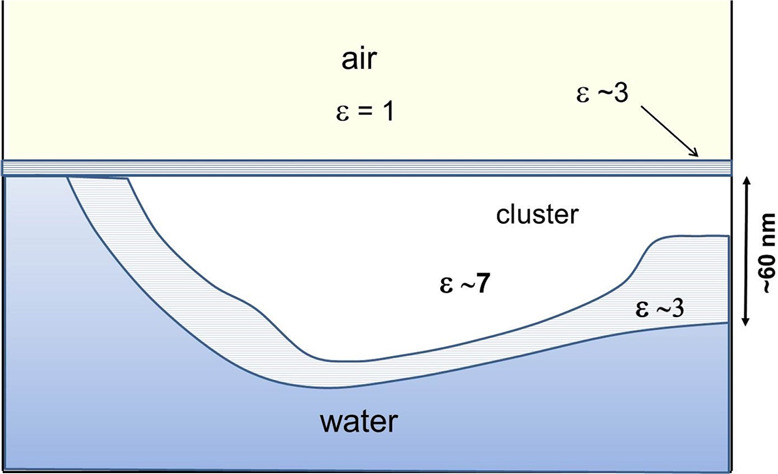
While there seems to be broad agreement that cluster formation does exist near solid surfaces, its presence at the liquid/vapor interface is controversial. We report experimental studies we have carried out on interfacial water attached on hydrophobic and hydrophilic surfaces. Nanosized steps in the measured force vs distance to the surface curves characterize water cluster profiles. An expansion of the interfacial structure with time is observed; the initial profile extent is typically ∼1 nm, and for longer times expanded structures of ∼70 nm are observed. Our previous results showed that the interfacial water structure has a relative permittivity of ε ≈ 3 at the air/water interface homogeneously increasing to ε ≈ 80 at 300 nm inside the bulk, but here we have shown that the interfacial dielectric permittivity may have an oscillating profile describing the spatial steps in the force vs distance curves. This low dielectric permittivity arrangements of clusters extend the region with ε ≈ 3 inside bulk water and exhibit a behavior similar to that of water networks that expand in time.
1. Introduction
Water is pictured as a featureless, homogeneous medium characterized by a dielectric constant of approximately 80 at 25 °C. The molecular-scale structure and dynamics of water are strongly perturbed at interfaces with other materials,1 and the resulting changes in physical and chemical properties are of significant interest in many environmental, technological, and biological systems.2−6 Hydrophobicity at surfaces has significant implications for protein folding7−9 and even for geosciences, because many clays in soils are hydrophobic.
Then water near a surface differs from that in the bulk phase, since there exists a thin transition zone which makes a perceptible contribution to the mechanical, thermodynamic, chemical, and dielectric behavior of the interface.10 This structural arrangement of water at the interface with the air is responsible for phenomena such as proton trapping and hopping along “water wire”,11 charge separation/recombination processes,12,13 change in the acidity/basicity of several molecules from their values in bulk water,14,15 the atypical Pockels effect,16 and the high surface tension of water droplets and size dependence.17
Earlier studies of surface effects on water have laid emphasis on the orientational preference of molecules at the interfacial boundary.18−20 Stillinger et al.21 studied the O–H intramolecular vibrational spectrum of water at the vapor interface, in agreement with the experimental results of Du et al.22
The quest to achieve an accurate description of interfacial liquid water has produced major advances, but we remain unable to accurately calculate its properties, e.g. density and dielectric constant.23 We do not yet have a satisfactory molecular description of the molecular nature of the surfaces of either ice or liquid water.24 Although it is clear that the hydrogen bond network and its fluctuations and rearrangement dynamics determine the properties of the liquid, no experimental studies exist.
While the molecular movements within liquid water require the constant breaking and reorganizing of individual hydrogen bonds, it is thought that the instantaneous degree of hydrogen bonding gives rise to extensive networks. The time average hydrogen bonded networks will be investigated by atomic force microscopy (AFM) probing their interfacial electric field profiles. AFM is the ideal distance analysis method for probing a surface because the interfacial electric field probed by this method is generated by large areas in comparison to the probe tip with a radius of ∼5 nm and the electric polarizability of interfacial water is determined by the strength of water-mediated intermolecular forces.
The question that remains is the spatial resolution in the direction normal to the surface. In our AFM experiments,25,26 a nanosize spherical Si3N4 tip is brought quasi-statically to the vicinity of a flat solid surface, all immersed in purified water or in solutions. The normal force acting on the tip is measured directly and simultaneously as a function of the tip–sample distance.26,27 Because of the mechanical stability of our apparatus and a proper choice of the cantilever stiffness we are able to measure, during force acquisition, the tip–surface distance with a nanometer resolution.
Another important point is that our previous work investigating the water interfacial region probed the interaction regions but not their time-dependent profile variation. Here we show that for a short time interval (few seconds) after the interface formation the structure extends only to 1 nm away from the interface, but after 250 min the interfacial structure has expanded to ∼100 nm. Time-dependence profiles show variable patterns, and the mechanism that is responsible for this expansion is discussed.
In this work we employ AFM force curve measurements to elucidate the interfacial water structure by comparing the interfacial dielectric permittivity measured profiles. Interfacial profiles were investigated in water films on three different configurations: an atomically smooth hydrophobic, i.e., not wetted surface, highly oriented pyrolytic graphite (HOPG), mica and the free liquid water surface, all of which can be considered hydrophobic. Extensive AFM profile measured dimensions have been compiled for interfacial water structures. This new information will help us untangle the intricacies associated with cooperative interfacial hydrogen bonding.
2. Experimental Section
AFM force measurements were acquired using a scanning probe microscope (SPM) (Model TMX2000, TopoMetrix, Veeco) with a scanner in contact mode. A silicon nitrite (Si3N4) tip (Veeco, Model MSCT-AUHW) with a spring constant of about 0.03 N/m and a radius curvature of ∼5 nm was scanned probing the HOPG interfacial boundary and the air/water interface. The experiments were conducted in a cell at 25 °C. The commercial Si3N4 tip surface has been found to be close to electrically neutral over a wide pH range (from at least pH 6 to 8.5). HOPG provides a useful surface for AFM studies due to its flat cleavage and inert nature, which makes it possible to obtain images in air, liquid, and other environments with atomic resolution.25 Mica and HOPG were cleaved with an adhesive tape in air, and then the sample stage was immediately placed in the chamber. The HOPG and mica samples were typically several tenths of a millimeter thick. The water/air interfacial region was probed on air bubbles a few millimeters in diameter deposited on a PTFE substrate immersed in water.
The interfacial water-probing experiments were carried out at room temperature in an environmental chamber housing the AFM. The special feature of our instrument is the liquid cell.1 The results reported here are based on several separate experiments using different HOPG and mica substrates and air bubbles as well as different contact points within experiments. Oscillations were detected in several measurements. A schematic diagram of the air bubble/water interface and the probing tip is shown in Figure 1. The probed interaction region dielectric permittivity interfacial profile is schematically shown.
Figure 1.
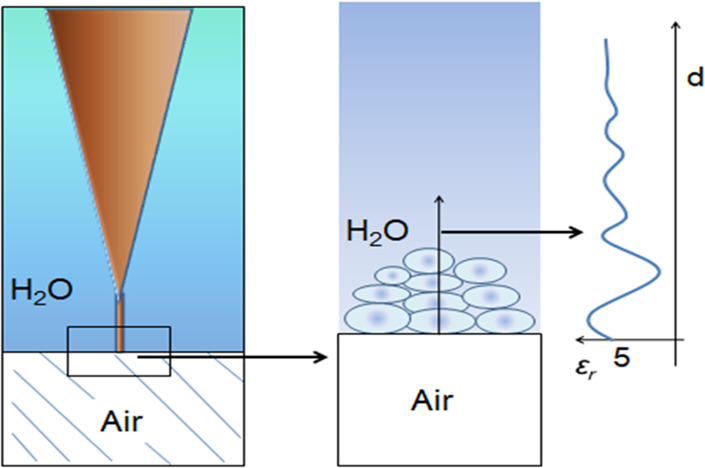
Schematic diagram of the interaction tip/interfacial region. Right inset: interfacial water dielectric permittivity profile.
The radius of the tip was characterized by the observation of porous silicon structures and by comparing the size of the silicon particles as measured by TEM.28 Boxes with 20 tips was purchased, and one of the tips was characterized in order to verify that the measured value is not statistically different from the manufacturer’s value.
3. Results and Discussion
3.1. Interfacial Region Probed by AFM
The properties of pure water in interfacial boundaries often exhibit notable anomalies in the force vs separation curves.26 Let us then describe the technique used to characterize the hydration layer attached to a hydrophobic air/water interface.1,26,27 The measured force vs distance profiles are used to calculate the interfacial dielectric permittivity and the interfacial electric field profiles. Figure 1 shows the schematic diagram of the interaction region formed by the interface and the immersing tip.
The interfacial water is inhomogeneous in the sense that the polarization (and hence the permittivity) is a function of position which is induced by the interfacial charged surface.29,30 Adjacent to hydrophobic substrates, the interfacial charges originate from the interfacial broken water bonds.31 AFM experiments have examined this structure in the interfacial layer and transition zones adjacent to HOPG and mica substrates immersed in water and to air/water interfaces.
3.2. Size Measurements of Time-Dependent Interfacial Water Cluster Attached to Hydrophobic Substrates
The interfacial region profiles were measured for various time intervals after the interface formation (t ≈ 0), initially for t ≈ 0, and then measurements continued for time intervals as long as ∼250 min after the interface formation, while in our previous measurements profiles were probed only for t ≈ 0. Here in order to verify if stepped profiles are specific to air/water interfaces, KCl and NaCl solutions were also used. Our objective in this work is to show that interfacial patterns varying in time may be characterized by their step size variation.
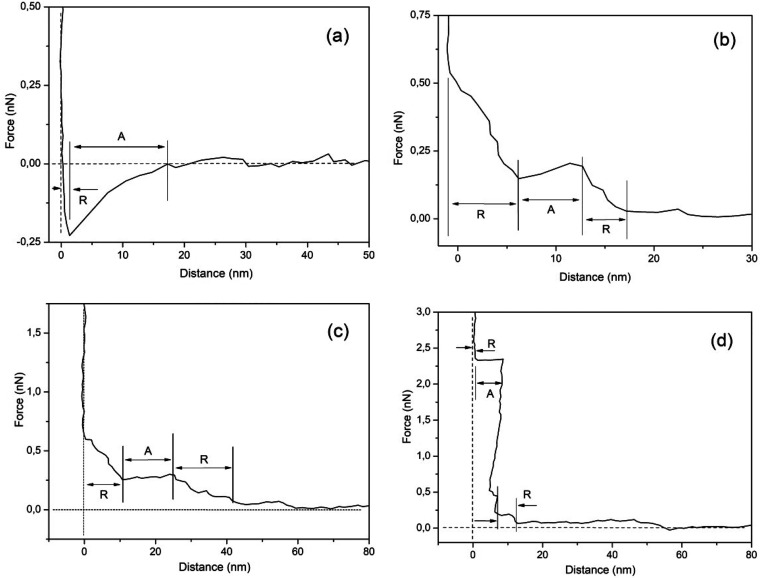
In this work we have initially probed HOPG interfacial boundaries in NaCl and KCl solutions. Figures 2a–d shows the force vs distance profiles for an HOPG surface immersed in 1 M NaCl for various time intervals after the immersion (t ≅ 0). Figure 2a shows the curve immediately after immersion. The presented profiles can be interpreted as follows: zero force is recorded beyond ∼20 nm, because the AFM tip experiences negligible resistance moving through the bulk as it approaches the HOPG surface. This shows that AFM is insensitive to any structure that might exist in bulk liquid. The profile in Figure 2b, measured 63 min after immersion, shows that the tip encounters the first detectable step at ∼15 nm away from the surface. At ∼15 nm an increasing force of up 0.2 nN acts on the tip and then the tip “jumps” (attraction) to 7.0 nm from the interface, where an almost linearly increasing force acts on the tip. The magnitude of the forces for each step increases as the tip moves closer to the surface. Figure 2c shows the measured force vs distance curve 254 min after immersion. The measured profile is similar to the profile shown in Figure 2b, and finally in Figure 2d measured 264 min after immersion, a repulsion is observed when the tip is ∼12 nm away from the interface, followed by an attraction at 8 nm away from the HOPG surface and finally a repulsion at 1 nm from the HOPG surface.
Figure 2.
Interfacial HOPG immersed in 1 M NaCl solution measured force profiles as a function of the distance to the interface for (a) t ≈ 0 min, (b) t = 63 min, (c) t = 254 min, and (d) t = 264 min. A indicates attractive and R repulsive regions. The region indicated by R in (a) gives the extension of the interfacial boundary at immersion.
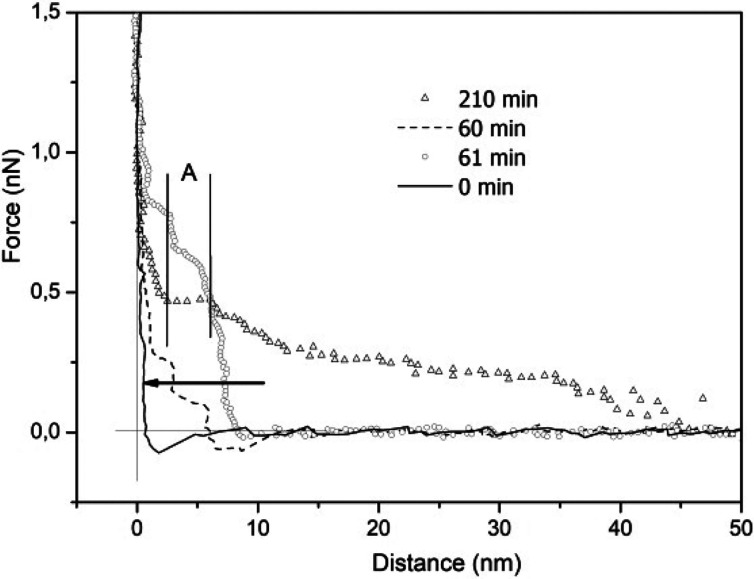
Figure 3 depicts the measured force vs distance curves for HOPG immersed in a 0.154 M KCl solution. Profiles are shown at the immersion time for t ≈ 0, 60, 61, and 210 min after immersion; observe that the repulsive force extends up to ∼50 nm, after a 210 min immersion period. The extension of the interfacial region at immersion is indicated by an arrow (∼1 nm) where ε ≈ 10.
Figure 3.
Interfacial HOPG immersed in 0.154 M KCl solution measured force profiles as a function of the distance to the interface for various times. The arrow indicates the extension of the interfacial water structure at immersion (t ≈ 0 and ε < 10).
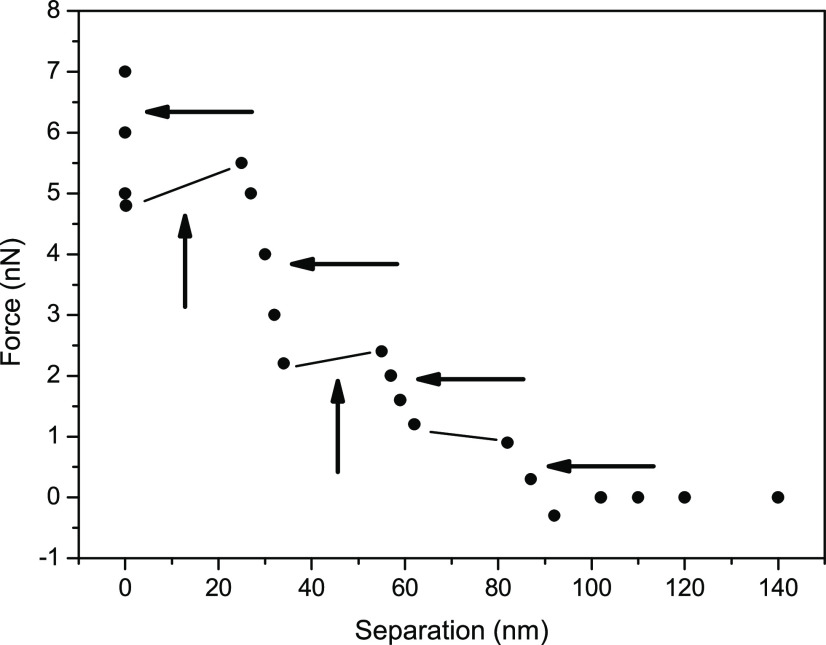
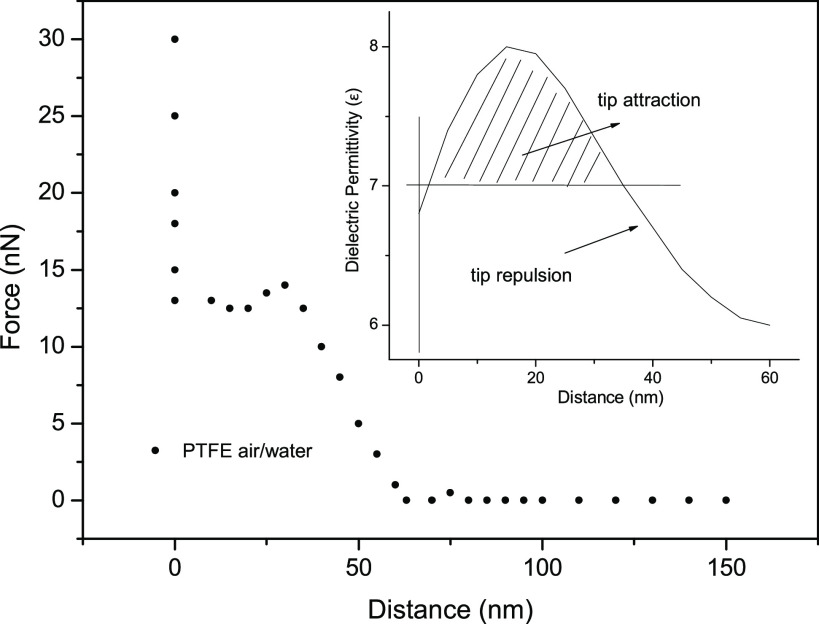
In order to clarify the parameters in the force vs distance curves, let us describe the pattern shown in Figure 4 formed steps which was measured at an air/water interface probing an air bubble a few millimeters in diameter. Observe that the curve shows four steps in the profile as the tip approaches the interface. Repulsion on the tip is indicated by a horizontal arrow. The range of attractive and repulsive forces changes as the tip approaches the interface. Closer to the interface the repulsive force range is ∼1–2 nm and the attractive force has a ∼20 nm extension.
Figure 4.
Schematic force vs distance profile for the configuration observed on an air/water interface attached to an air bubble deposited on a PTFE substrate. The tip repulsion regions are indicated by horizontal arrows and the attractions by vertical arrows.
Table 1 gives a list of cluster profile characteristics measured at the air/water interface for distinct times after the interfacial boundary formation. The observed profile is formed by the regions where the force increases and regions where the force is constant or decreases. The measured step characterization such as thickness and force amplitude necessary for the tip penetration in the cluster and its separation from the interface are displayed. The largest measured step listed is 68 nm wide (formed after ∼100 min). Then the periodicity of the distribution was determined: most of the steps are typically 25–30 or 8.5 nm wide, and a few are as small as 1 nm. A similar list measured at air/solution interfacial regions formed on air bubbles attached to a PTFE substrate is shown in Table 2. The distributions of clusters for 0.154 M KCl, 0.154 M NaBr, 0.154 M NaI, 0.154 M NaF, 0.154 M NaCl, and 1 M NaCl solutions are depicted. Observe that the wider cluster dimension is ∼48 nm, substantially smaller than those observed in the air/water interfacial region. Understanding the origin and the extent of these modifications is a classical problem in electrochemistry.18,32,33
Table 1. Air/Water Interfacial Profiles Formed at Air Bubbles Deposited on PTFE Substrates.
| cluster | step thickness (nm) | force amplitude (nN) | surface distance (nm) |
|---|---|---|---|
| 1 | 8.5 | 1.4 | 34 |
| 8.5 | 3.3 | 25.5 | |
| 17 | 5.0 | 17 | |
| 2 | 8.5 | 0.7 | 8.5 |
| 3 | 25 | 2.3 | 27 |
| 2 | 5 | 2 | |
| 4 | 25.5 | 7 | 93.5 |
| 68 | 14 | 68 | |
| 5 | 25 | 4.5 | 24 |
| 6 | 25 | 7 | 24 |
| 7 | 25 | 4 | 67.5 |
| 42.5 | 5 | 42.5 | |
| 8 | 34 | 3.7 | 76.5 |
| 42.5 | 4.5 | 42.9 |
Table 2. Air/Solution Interfacial Profiles Formed at Air Bubbles Deposited on PTFE Substrates.
| solution | step thickness (nm) | force amplitude (nN) | surface distance (nm) |
|---|---|---|---|
| NaCl 1.0 M | 8 | 0.125 | 11.2 |
| 2.4 | 1.15 | 3.2 | |
| 0.8 | 0.45 | 0.8 | |
| NaF 0.154 M | 8 | 0.8 | 20 |
| 12 | 3.5 | 12 | |
| KCl 0.154 M | 24 | 3 | 44 |
| 16 | 7.5 | 20 | |
| 4 | 9 | 4 | |
| NaBr 0.154 M | 20 | 0.75 | 20 |
| NaI 0.154 M | 20 | 1.4 | 32 |
| 12 | 2.2 | 12 | |
| NaCl 1.0 M | 24 | 2 | 24 |
| NaCl 0.154 M | 48 | 3 | 48 |
Tables 1 and 2 show step distribution from an ensemble of ∼500 force vs distance measured curves at various positions along the interface for various time intervals after the interfacial layer formation. Our objective is not to measure specific values of the step sizes but to characterize the step size pattern that changes in time.
It is important to observe that variable patterns were measured probing distinct regions of the interface at distinct time interval after bubble formation. Cluster #1 in Table 1 has step dimensions of ∼8 and 17 nm, and the profile formed by three steps extend to 34 nm from the interface. Cluster #4 depicts much larger steps than those in Cluster #1; the profile extends to ∼90 nm away from the surface. Table 1 and 2 profiles then show that the interface is formed by structures that have variable profiles along the surface and that extend up to ∼90 nm from the interface.
Results in the previous paragraph show that increases and decreases in the force acting on the tip occur at different distances from the surface; it is then difficult to understand how any force law could exist where the gradient of the force changes so abruptly from negative to positive at such small separations and with time. The following observations resume these experimental results in agreement with our previous results:26−28 (a) the discontinuous steps appear in the force curves (Figures 2 and 3), (b) the force curve depends greatly on the measuring position on the interface, (c) distinct shapes of the repulsion component were measured, and (d) there is a time dependence, i.e., the force curve depends on time after the immersion of the substrate in the solution. All these results suggest that these patterns of the force vs distance curve are attributable to the liquid structure at the interface that is changing in time.
3.3. Interfacial Water Cluster Attached to Hydrophilic Substrate
Mica is always negatively charged in water. When the mica basal plane is placed in water, the mechanism for the formation of the double layer is assumed to be the dissolution of K+ ions as well as ion exchange of K+ by H– or H3O+ ions. It should be noted that the K+ ions initially held on the mica surface in the high-resistivity water (18 MΩ/cm, ∼5 × 10⁻⁶ M 1:1 electrolyte at pH ∼6) should be at least partially H3O+ ion exchanged.
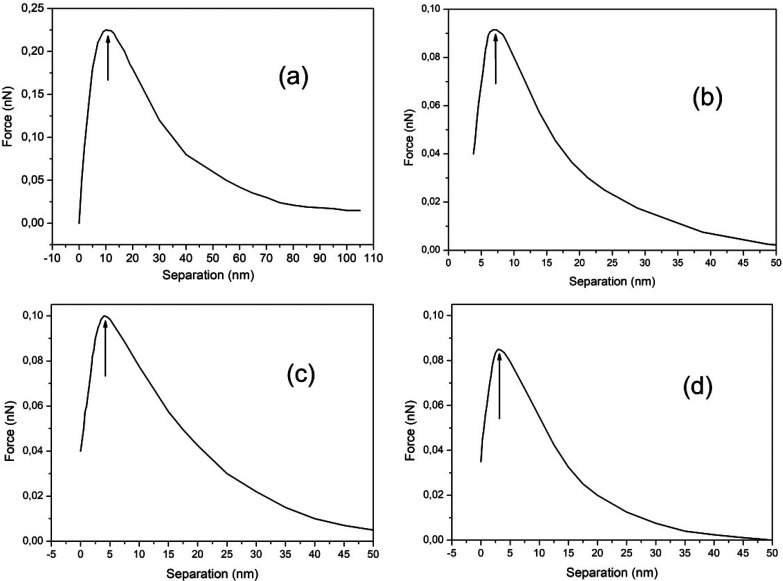
Figure 5 shows the force vs distance curve measured with a silicon nitride tip on mica immersed in (a) water, (b) 10–3 M NaCl, (c) 10–3 M KCl, and (d) 10–3 M LiCl.
Figure 5.
Force vs separation curve for a Si3N4 tip and a mica sample immersed in (a) water, (b) 10–3 M NaCl, (c) 10–3 M KCl, and (d) 10–3 M LiCl. Arrows indicate the extension, starting at the origin, of the interfacial region where the permittivity is lower than εtip = 7.
3.4. Interfacial Structural Features and Their Characterization by AFM
Dielectric properties of interfacial water have attracted intense interest for many decades,34−36 but no clear understanding has been reached.37−39 So let us initially reexamine the structure of water deposited on various substrates. In our previous work26 we have probed the deposited water molecular structure of various ice arrangements on HOPG substrates at ambient temperature. Images show two periodic arrangements with distinct spatial periodicities, a cubic structure with a lattice parameter of 0.34 nm and a hexagonal structure with a lattice parameter of 0.45 nm corresponding to ice Ic bonding and ice Ih bonding, respectively. These two distinct ice-like structures grow separated (∼4 nm) apart on the HOPG surface. More recently we have investigated the structure at the air/water interface.27,40,41 The surface molecular-scale structure was probed by Raman spectroscopy observing the translational and orientational intermolecular dynamics. The structural feature that appeared in the interfacial region was a crystalline ice form (ice II) with a relative permittivity of εr ≈ 3.41 Here we have investigated the microscopic (≥1 nm) interfacial water structure, which shows variable molecular water networks.
Starting at ∼1 nm (smaller measured step) up to 50 nm, the selection was made by choosing the best signal-to-noise ratio curves and the range of measured values. No averages were calculated because the sizes vary with formation time. Our objective was not to determine the size of the step but show the large range of measured step values. Since the profile changes in time there is no average value or most probable measured value for the ensemble.
The effects of exposing surface and tips to environmental conditions for prolonged periods of time were not investigated in this work. Tip aging effects were not considered because surface probing periods extended up to ∼250 min. One piece of evidence for the minor effect of tip aging is the repetitive sizes measured for various immersion periods using NaCl and KCl solutions. Tip aging abrasion may be an important effect when scanning surfaces.42 In our study we have probed adhesive forces and not the frictional response.
Studies in the literature describe the change in adsorption of water layers from an ambient environment where the adsorption film pattern and thickness are observed; here we have described a pattern variation for immersed substrates in water. For mica and graphite substrates it is found that long-term exposure to high relative humidity (RH), i.e., 90% > RH > 70%, affects the magnitude and distance dependences of the forces which indicates that accumulation of water on the surfaces with time is responsible for the variations in force measurements.43 The microscopic structure of adsorbed water changes on a hydrophobic surface under ambient conditions44 during imaging at atmospheric pressure45 were also reported. Surface roughness of aged silica fiber studies shows that aging in both liquid water and water vapor results in surface roughening.46
3.5. Molecular Water Clusters in the Interfacial Region Attached to Hydrophobic Surface as Characterized by Their Dielectric Permittivity Profiles
The discussion now will delve into the profiles of measured steps in the interfacial water region. In order to characterize these regions let us use the expression of the dielectric exchange force and determine the spatial distribution of the dielectric permittivity at the interfacial region.
The surface of a silicon nitride (Si3N4) AFM tip in aqueous solution is composed of amphoteric silanol and basic silylamine (secondary (silazane, −Si2NH2) and possibly primary (silylamine, −SiNH3) amines, though the latter is rapidly hydrolyzed) surface groups at pH ∼6; with no added electrolyte the silicon nitride surface is zwitterionic (zero net charge).
The dielectric permittivity interfacial profile and the electric field intensity are calculated using the expression below. The electric field vector (E̅) is assumed to have an exponential spatial dependence E(z) = E0e–κz and is initially calculated at far distances from the interface, where no steps are observed, but only an exponential decrease in the measured force intensity profile. The elemental volume (dv) of the trapezoidal tip immersed in the double-layer region is given by dv = π[R + (tan α)z]2 dz, where z is the integration variable of the trapezoidal volume and H is the distance between the surface and the end of the tip, and the change in the electric energy (W) involved in the exchange of the dielectric permittivity of the double layer with that of the tip is calculated by integrating the energy expression. For a polar fluid, like water, to experience a net polarization force over a given region, there must be local accumulation of polarization charges. At the interface water is inhomogeneous in the sense that the polarization (and hence the permittivity) is a function of position. The force is obtained by the gradient of the energy expression, i.e., Fz = –(∂/∂z) ΔW, where
| 1 |
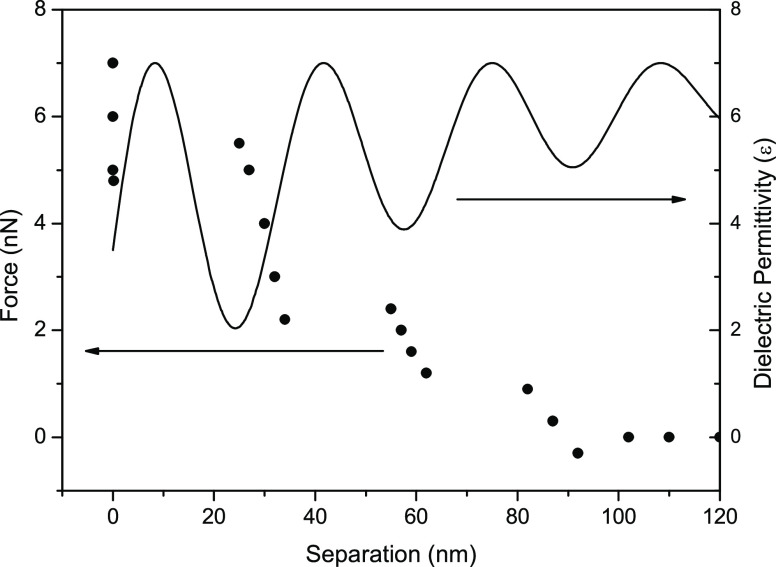
It is then necessary to find an analytical expression to use in eq 1 to fit the measured data (force vs distance curve). The calculated profiles are shown in Figures 6–8 as full lines. The dielectric permittivity as a function of the separation from the substrate is described as a product of a trigonometric function with different adjustable parameters. The oscillating profile used in Figure 8 is described by the following expression26y = 7 – 7(e–0.007x)2 sin2(0.03xπ – π/5), where y is the dielectric permittivity and x is the distance to the air/water surface. The formed structures are characterized by an oscillating dielectric permittivity (ε) profile indicating variations in the water organization within layers.
Figure 6.
Force vs distance profile for one cluster formation. The repulsive force component starts at x ≈ 70 nm and ends at x ≈ 30 nm (x is the distance to the interface) where an attraction is observed. The top inset shows the calculated oscillating dielectric permittivity profile. Observe that for the interval x ≅ 5 nm up to x ≈ 35 nm the dielectric permittivity is εint ≥ 7, which corresponds in eq 1 to an attraction, and for x ≥ 35, ε is lower than 7, resulting in repulsive force acting on the tip.
Figure 8.
Force vs distance profile of an interfacial region with three clusters. The full line shows the adjusted oscillating profile of the dielectric permittivity calculated using eq 1. For the interval x = 0 up to x ≅ 25 nm there is an attractive force acting on the tip. Regions corresponding to attraction have ε > 7, and regions corresponding to repulsion have ε < 7.
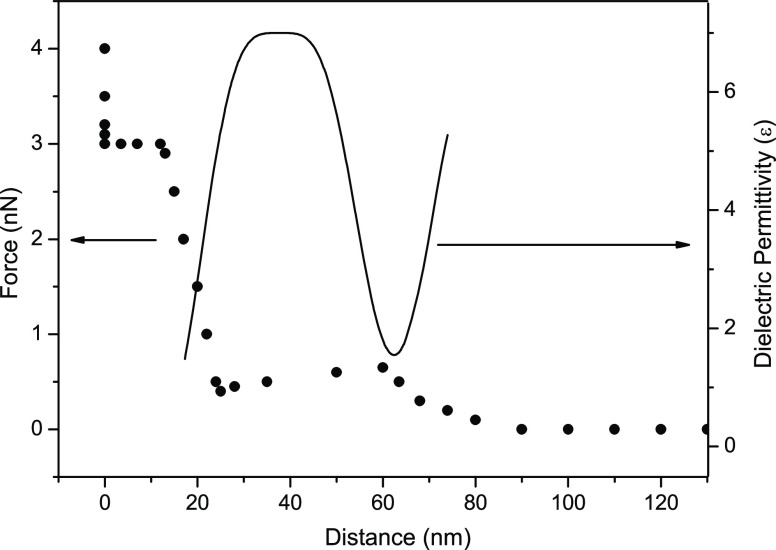
For regions with εint ≥ 7 there is attractive force acting on the tip. This is clearly shown in Figure 6 for the interval starting at 35 nm down to 0.5 nm away from the surface where a repulsive force is observed. For a distance larger than 35 nm the tip is repelled from the interfacial region. Figure 7 shows a profile formed by two steps attached to the air/water interface; there is a repulsion starting at ∼25 nm away from the surface followed by an attraction starting at 12 nm. In the 25–60 nm range there is attraction acting on the tip and finally repulsion starting at −80 nm away from the surface and ending at ∼60 nm. Figure 8 shows a three-step cluster. Regions with the relatively high dielectric constant εint ≈ 7 are surrounded by a region with the lower dielectric permittivity εr ≈ 3. This oscillating profile in the dielectric constant describes the steps in force vs distance curves indicating regions with distinct molecular arrangements.
Figure 7.
Force vs distance profile of an interfacial region with two clusters: each one showing repulsive and attractive regions. The full line is the adjusted dielectric permittivity profile. For the interval x = 0 up to x ≅ 12 nm there is an attraction on the tip, followed by a repulsion acting on the tip up to 24 nm, which corresponds to ε < 6. The oscillating profile of the dielectric permittivity is shown by the full line.
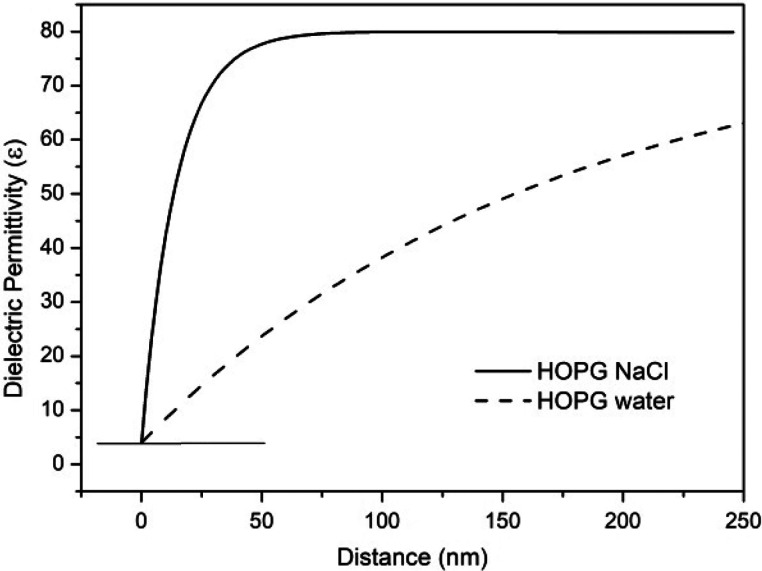
Figure 9 shows the fitting of eq 1 to the experimental data for HOPG immersed in water and HOPG immersed in a NaCl solution observed as homogeneously increasing profiles. These homogeneously increasing profiles indicate a strong stiffness of the water molecules at the interface evidenced by the value of ε ≈ 4 and a decrease in a molecular orientational rigidity for regions far from the interface.
Figure 9.
Dielectric permittivity profiles of the HOPG interfacial region immersed in water (dotted line) and in a 1 M NaCl solution (full line).
Interfacial water structures are then shown to exist in three domains, clusters formed by nanodomains, microdomains formed by nanoclustered arrangements, and a homogeneously increasing dielectric permittivity profile region, as shown in Figure 9.
3.6. Water Molecular Clustered Structure Attached to Mica Substrates
The pattern in the force vs distance curve corresponding to the water interfacial region attached to mica surfaces was previously reported.1,32 For a mica substrate the interfacial electric field is generated by mica K+ ions attached to the crystalline substrate immersed in specific solutions. The force is given by eq 2, where we used the displacement vector to calculate the force acting on the tip.21 The electric displacement vector (D) is assumed to have an exponential spatial dependence D(z) = D0e–κz, and the vector amplitude (D0) is determined by the ionic charge distribution at the mica surface (z = 0) by using Gauss’ law. The change in the electric energy involved in the exchange of the relative permittivity of the double layer by that of the tip is calculated by integrating the energy expression over the tip immersed volume in the double-layer region. The force is obtained by the gradient of the energy expression, i.e., Fz = −grad ΔW, where
| 2 |
Then the interfacial dielectric permittivities are computed using the measured force vs distance measured curves. The dielectric permittivity profiles at the interfacial region for hydrophilic mica substrates immersed in water and in 10–3 M solutions of MgCl2, KCl, NaCl, and LiCl were calculated. The ions in solution alter significantly the interfacial dielectric profile at the interfacial boundaries shown by variations starting at ε ≈ 2.4 for MgCl2 solutions up to ε ≈ 8.7 for LiCl solutions. The intermediate values are water ε ≈ 3.8, KCl ε ≈ 7.1, and NaCl ε ≈ 3.7. For these regions the dielectric permittivity decreases from the bulk value ε ≈ 80 to ε ≈ 3.8–7.1 at the interface.
Using eq 2 and Figure 5a–d profiles it is possible to observe that the dielectric permittivity has a value smaller than ε ≈ 7 at the attractive regions of the curves typically from x = 0 up to ∼5 nm away from the surface. The cluster size attached to mica substrates (indicated in Figure 5 by vertical arrows) are then mica–water ∼10 nm, mica–NaCl ∼7.5 nm, mica–KCl ∼4 nm, and mica–LiCl ∼3 nm wide. Cluster sizes attached to mica are typically ∼5 nm wide, while the observed clusters attached to hydrophobic substrates are larger than 50 nm.
An interfacial dielectric permittivity reduction and an increase in the interfacial electric field were measured, and these interfacial effects are transmitted by successive polarization of neighboring molecules to an impressive depth. The power HOPG and air/water interfaces have in the water structure is shown by the very low value of the permittivity at the interfacial region and by the interfacial electric field presence that extends up to 500 nm (see Figure 9), in agreement with the values reported by Henniker.47
The dielectric permittivity at the water interface has been modeled, and the permittivity reduction has various possible explanations. Olivieri et al.48 modeling the interfacial water region claimed that the permittivity reduction is not due to any important alignment of the interfacial water molecules but instead to the long-range anisotropic dipole correlation combined with the excluded volume effect of the low dielectric confining material. Sato et al.49 showed by a molecular dynamics simulation that the dielectric constant of water decrease is due to both the decrease in water density and the reduced water dipole correlation in the direction perpendicular to the surface. Motevaselian and Aluru50 showed that this reduction in perpendicular permittivity is due to the favorable x–y plane dipole–dipole electrostatic interaction of the interfacial fluid layer.
It is probable that a geometric constraint at the interface results in an increase in the interfacial electric field modifying the dipole–dipole electrostatic interaction in the interfacial layer, which results in a decrease in the dielectric permittivity.
3.7. Variable Interfacial Water Clustered Structure
No specific study was made to determine the force vs distance shape variation with the time after the interfacial boundary formation, but a few distinct patterns were observed. The initial pattern extends typically a few nanometers away from the interface. After 30 min variable patterns formed by attractions and repulsions on the tip are observed but only for much longer time intervals (150 min) are patterns with 70 nm regions formed.
The above results establish that at the interface water molecules prefer an orientationally ordered structure with a low dielectric permittivity similar to that of ice-II.51 It was Michael Faraday in the 1850s who first proposed that the surface of ice near the melting point is covered by a thin liquid-like layer. Computer simulations at the interface separating a simple Lennard–Jones crystal and its melt have indeed indicated the existence of a quasi-liquid layer of a few molecular diameters in extent.52−55 There is then a breakdown of the structure into liquid near the surface. A distinct behavior was observed in air/water interfaces, where we see a more organized structure with εr ≈ 3 similar to ice II associated with the water molecule orientation toward the broken bond interfacial region.
This time variable profiles are difficult to measure using spectroscopic techniques such as neutron reflectometry.56 The bonds are mobile, as shown by time-dependent variable profiles shown in Figure 2a–d and in Figure 3. For a short time interval (few seconds) after the interface formation the structure extends only to a few nanometers from the interface, in agreement with the measured profiles by Fumagalli et al.,57 but after 250 min the interfacial structure (steps) has expanded to ∼100 nm, as shown in Figure 8.
A schematic cluster arrangement is shown in Figure 10. This diagram depicts the measured dimensions shown in Figures 6–8 for the proposed clustered molecular profiles forming the interfacial region. A light region involves all the interfacial clusters which are determined by the extension of the external repulsive component in the force vs distance curves. Inside this region the cluster size is determined by the attraction region in the force vs distance profiles. The vertical lines at three distinct coordinates show these profiles. The measured dielectric permittivities are also shown.
Figure 10.
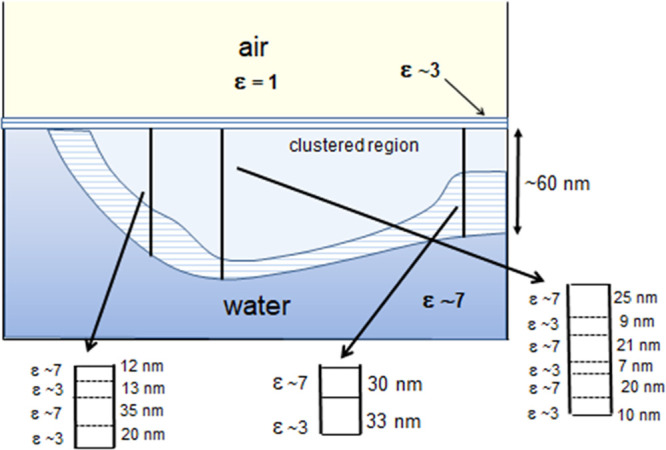
Schematic diagram of cluster arrangement formation based on an inference from the force vs distance curves measured probing various regions of the air/water interface (Figures 6–8). These curves give the force acting on the tip in the normal direction to the interface, measured probing various regions of the interfacial surface.
The cluster arrangement is then an inference from the measured force vs distance curves probing various regions of the air/water interface. Some regions do not show a force variable profile (too small to be detected) and for other regions the force profile extends up to ∼100 nm. So this picture then evolved as a normal outcome of the experimental results. The evidence is given by cumulative experimental measured curves. The molecular geometric confinement is then described as a modulation of the extensive hydrogen bond network that alters the interfacial water properties. The clustered formation arrangement is characterized by a spatially variable dielectric permittivity profile, as shown in Figures 6–8. Dielectric permittivity profiles in different solutions will be discussed in the next section.
3.8. Interfacial Molecular Cluster Structure in Ionic Solutions
The dielectric properties of pure water are not relevant to biological systems which operate in dissolved solutions. In biological systems the dissolved salts and other molecules will modify the dielectric properties observed for bulk pure water. In the condensed phase of water, the simplest aqueous ionic clusters contain a single ion surrounded by a finite number of water molecules. Investigations carried out by Castleman and his co-workers in bulk water have indicated a well-defined geometry for water structures caging polar molecules: certain ions or ionic groups, methanol,58 NH4+,59 OH–,60 and alkali-metal ions.61,62 Solutes then change the properties of local water and have two modes of changing water properties. They may reinforce each other or interfere with each other, resulting in conversion of surface water to height reactive weakly bonded liquid or to inert strongly bonded liquid. Let us analyze the cluster size distribution present at the air/water interfacial regions. The smaller cluster dimension is ∼1 nm and the larger dimension is 68 nm. The most frequent measured thickness is ∼25 nm for clusters observed 90 nm away from the air/water interface and the maximum repulsion amplitude (14 nN) observed for a cluster 68 nm away from the interfacial boundary. The cluster size distribution at air/solution interfaces shows smaller sizes of clusters than the measured for air/water interface, and amplitudes of the force steps are smaller. Finally the distribution of the cluster dimensions for the HOPG/NaCl solution interface shows even smaller-sized clusters and smaller repulsive force amplitudes. So in the interfacial region the surface clustering effect is decreased due to a solute effect, resulting in a cluster size decrease. Figure 9 also shows that the addition of ions increases the interfacial ε, which is an indication that ions destroy the interfacial alignment.
The original theory of Debye and Huckel63 predicted that for the dilute solutions the relative permittivity of an electrolyte solution would rise above that of the pure water solvent. This was predicted from the polarization properties that would be associated with the solvated ions and their surrounding atmosphere of counter-charged ions. This is not observed in the condensed phase of water, since for electrolyte solutions it has commonly been found64 that the permittivity of the solution is less than that of pure water. This reduction in the permittivity results from the replacing of polar water molecules with nonpolar atoms together with the orienting effect of the local high electric fields around the solvated ions. This shield of oriented water molecules will be unable to respond to the influence of applied electric fields, and so the effective polarizability of the solution will be reduced. However, an analysis of the profiles in Figure 8 for water and for a 1 M NaCl water solution shows the opposite effect. Interfacial water shows the lowest value of the dielectric permittivity when compared to the value for 1 M NaCl solutions. In our previous work1 the same effect is observed in the mica interfacial region for 10–3 M solutions of MgCl, KCl, NaCl, and LiCl.
By measuring the dielectric permittivity profiles in the interfacial region we have determined the structure profiles of interfacial water attached to hydrophilic and hydrophobic interfaces. Hydrophilic substrates show an organized water structure extending only to ∼5 nm, while hydrophobic substrates structure may extend ∼100 nm. These profiles are time variable.
4. Conclusions
Interfacial water force vs distance profiles show that the interfacial boundary induces a suprastructure of water layering that is not present in the bulk. Initially we have shown that there is an expansion of the interfacial water structures that increases with time after the interfacial boundary formation. Water arrangements with domain sizes that vary from ∼70 nm (formation time ∼250 min) down to ∼1 nm (formation time ∼1 min) and structures with a variable number of clusters were observed. Consequently the region near the air/water interface is characterized by a structure where the degree of the local molecular orientation rigidity is increased and decreased. The variations in the organization within the structure between the ordered structures may be quite sharp. The observed structure is formed by regions with ε ≈ 3 and ε ≈ 7 clusters which are surrounded by a layer with ε ≈ 3.
Water depletion layers at hydrophobic surfaces were confirmed experimentally by various neutron and X-ray reflectometry experiments, but the reported results on their thickness and their dependence on the properties of the surfaces and the liquid phase vary considerably. In this work we suggest that the possible origin of this divergence in measured results is the time-dependent (Figures 2 and 3) spatially variable dielectric constant observed profiles. This profile variation can only be characterized using AFM. Fukuma et al.65 and Uhlig et al.66 probed regions adjacent to mica and graphene, respectively, showing structures that extend ∼1–2 nm away from the surfaces. The extension of the interfacial region shown in Figure 1a (∼1 nm) is in agreement with these results.65,66
Acknowledgments
This study was financed in part by the Coordenacao de Aperfeicoamento de Pessoal de Nivel Superior (CAPES) - Finance Code 001 - scholarship PNPD (W.E.G.).
The authors declare no competing financial interest.
References
- Teschke O.; Ceotto G.; de Souza E. F. Interfacial water dielectric-permittivity-profile measurements using atomic force microscopy. Phys. Rev. E 2001, 64, 11605. 10.1103/PhysRevE.64.011605. [DOI] [PubMed] [Google Scholar]
- Thiel P. A.; Madey T. E. The interaction of water with solid surfaces: Fundamental aspects. Surf. Sci. Rep. 1987, 7, 211–214. 10.1016/0167-5729(87)90001-X. [DOI] [Google Scholar]
- Brown G. E. How minerals react with water. Science 2001, 294, 67–69. 10.1126/science.1063544. [DOI] [PubMed] [Google Scholar]
- Henderson M. A. The interaction of water with solid surfaces: fundamental aspects revisited. Surf. Sci. Rep. 2002, 46, 1–26. 10.1016/S0167-5729(01)00020-6. [DOI] [Google Scholar]
- Robinson G. W.; Zhu S. B.; Singh S.; Evans M. W.. Water in Biology, Chemistry and Physics; World Scientific: 1996; Vol. 9. [Google Scholar]
- Pratt L. R.; Pohorille A. Hydrophobic Effects and Modeling of Biophysical Aqueous Solution Interfaces. Chem. Rev. 2002, 102, 2671–2674. 10.1021/cr000692+. [DOI] [PubMed] [Google Scholar]
- Zhou R.; Huang X.; Margulis C. J.; Berne B. J. Hydrophobic collapse in multidomain protein folding. Science 2004, 305, 1605–1609. 10.1126/science.1101176. [DOI] [PubMed] [Google Scholar]
- Huang D. M.; Chandler D. Temperature and length scale dependence of hydrophobic effects and their possible implications for protein folding. Proc. Natl. Acad. Sci. U.S.A. 2000, 97, 8324–8327. 10.1073/pnas.120176397. [DOI] [PMC free article] [PubMed] [Google Scholar]
- Liu P.; Huang X. H.; Zhou R. H.; Berne B. J. Observation of a dewetting transition in the collapse of the melittin tetramer. Nature 2005, 159, 437–440. 10.1038/nature03926. [DOI] [PubMed] [Google Scholar]
- Ono S.; Kondo S. In Molecular Theory of Surface Tension in Liquids in Encyclopedia of Physics; Flugge S., Ed.; Springer: 1960; p 134. [Google Scholar]
- Hassanali A.; Giberti F.; Cuny J.; Kuhne T. D.; Parrinello M. Proton transfer through the water gossamer. Proc. Natl. Acad. Sci. U.S.A. 2013, 110, 13723–13726. 10.1073/pnas.1306642110. [DOI] [PMC free article] [PubMed] [Google Scholar]
- Venkateshwaran V.; Vembanur S.; Garde S. Water-mediated ion-ion interactions are enhanced at the water vapor-liquid interface. Proc. Natl. Acad. Sci. U.S.A. 2014, 111, 8729–8733. 10.1073/pnas.1403294111. [DOI] [PMC free article] [PubMed] [Google Scholar]
- Kattirtzi J. A.; Limmer D. T.; Willard A. P. Microscopic dynamics of charge separation at the aqueous electrochemical interface. Proc. Natl. Acad. Sci. U.S.A. 2017, 114, 13374–13378. 10.1073/pnas.1700093114. [DOI] [PMC free article] [PubMed] [Google Scholar]
- Zhao X.; Subrahmanyan S.; Eisenthal K. B. Determination of pH at the air/water interface by second harmonic generation. Chem. Phys. Lett. 1990, 171, 558–561. 10.1016/0009-2614(90)85263-C. [DOI] [Google Scholar]
- Bianco R.; Wang S.; Hynes J. T. Infrared Signatures of HNO3 and NO3 at a Model Aqueous Surface. A Theoretical Study. J. Phys. Chem. A 2008, 112, 9467–9470. 10.1021/jp802563g. [DOI] [PubMed] [Google Scholar]
- Suzuki Y.; Osawa K.; Yukita S.; Kobayashi T.; Tokunaga E. Anomalously large electro-optic Pockels effect at the air-water interface with an electric field applied parallel to the interface. Appl. Phys. Lett. 2016, 108, 191103–4. 10.1063/1.4949273. [DOI] [Google Scholar]
- Tolman R. C. The Effect of Droplet Size on Surface Tension. J. Chem. Phys. 1949, 17, 333–337. 10.1063/1.1747247. [DOI] [Google Scholar]
- Fletcher N. H. Surface structure of water and ice. Philos. Mag. 1962, 7, 255–258. 10.1080/14786436208211860. [DOI] [Google Scholar]
- Croxton C. A. Molecular orientation and interfacial properties of liquid water. Physica A 1981, 106, 239–242. 10.1016/0378-4371(81)90223-5. [DOI] [Google Scholar]
- Fletcher N. H. Surface structure of water and ice - A reply and a correction. Philos. Mag. 1963, 8, 1425–1428. 10.1080/14786436308207305. [DOI] [Google Scholar]
- Stillinger F. H. Jr.; Ben-Naim A. Liquid-vapor interface potential for water. J. Chem. Phys. 1967, 47, 4431–4434. 10.1063/1.1701649. [DOI] [Google Scholar]
- Du Q.; Superfine R.; Freysz E.; Shen Y. R. Vibrational spectroscopy of water at the vapor/water interface. Phys. Rev. Lett. 1993, 70, 2313–2317. 10.1103/PhysRevLett.70.2313. [DOI] [PubMed] [Google Scholar]
- Chen B.; Xing J.; Siepmann J. I. Development of Polarizable Water Force Fields for Phase Equilibrium Calculations. J. Phys. Chem. B 2000, 104, 2391–2393. 10.1021/jp993687m. [DOI] [Google Scholar]
- Makkonen L. Surface Melting of Ice. J. Phys. Chem. B 1997, 101, 6196–6199. 10.1021/jp963248c. [DOI] [Google Scholar]
- Teschke O. Imaging ice-like structures formed on HOPG at room temperature. Langmuir 2010, 26, 16986–16990. 10.1021/la103227j. [DOI] [PubMed] [Google Scholar]
- Teschke O.; de Souza E. F. Water Molecule Cluster Measured at Water/Air Interfaces using Atomic Force Microscopy. Phys. Chem. Chem. Phys. 2005, 7, 3856–3860. 10.1039/b511257e. [DOI] [PubMed] [Google Scholar]
- Teschke O.; de Souza E. F. Hydrophobic Surfaces Probed by Atomic Force Microscopy. Langmuir 2003, 19, 5357–5360. 10.1021/la0340450. [DOI] [Google Scholar]
- Teschke O.; Ceotto G.; de Souza E. F. Dielectric exchange force: a convenient technique for measuring the interfacial water relative permittivity profile. Phys. Chem. Chem. Phys. 2001, 3, 3761–3766. 10.1039/b009744f. [DOI] [Google Scholar]
- Grahame D. C. The electrical double layer and the theory of electrocapillarity. Chem. Rev. 1947, 41, 441–445. 10.1021/cr60130a002. [DOI] [PubMed] [Google Scholar]
- Hunter R. J.Foundations of colloid science; Oxford University Press: 2001; p 806. [Google Scholar]
- Shen Y. R. Frank Isakson Prize Address Sum frequency generation for vibrational spectroscopy: applications to water interfaces and films of water and ice. Solid State Commun. 1998, 108, 399–402. 10.1016/S0038-1098(98)00399-8. [DOI] [Google Scholar]
- Fenimore P. W.; Frauenfelder H.; McMahon B. H.; Parak F. G. Slaving: Solvent fluctuations dominate protein dynamics and functions. Proc. Natl. Acad. Sci. U.S.A. 2002, 99, 16047–16051. 10.1073/pnas.212637899. [DOI] [PMC free article] [PubMed] [Google Scholar]
- Levinger N. E. Water in Confinement. Science 2002, 298, 1722–1725. 10.1126/science.1079322. [DOI] [PubMed] [Google Scholar]
- Conway B. E.; Bockris J. OM.; Ammar I. A. The dielectric constant of the solution in the diffuse and Helmholtz double layers at a charged interface in aqueous solution. Trans. Faraday Soc. 1951, 47, 756–760. 10.1039/tf9514700756. [DOI] [Google Scholar]
- Hubbard J. B.; Onsager L. J. Dielectric dispersion and dielectric friction in electrolyte solution. I. J. Chem. Phys. 1977, 67, 4850–4852. 10.1063/1.434664. [DOI] [Google Scholar]
- Chandra A. Static dielectric constant of aqueous electrolyte solutions: Is there any dynamic contribution?. J. Chem. Phys. 2000, 113, 903–907. 10.1063/1.481870. [DOI] [Google Scholar]
- Zhang C.; Gygi F.; Galli G. Strongly Anisotropic Dielectric Relaxation of Water at the Nanoscale. J. Phys. Chem. Lett. 2013, 4, 2477–2480. 10.1021/jz401108n. [DOI] [Google Scholar]
- Schlaich A.; Knapp E. W.; Netz R. R. Water Dielectric Effects in Planar Confinement. Phys. Rev. Lett. 2016, 117, 048001–5. 10.1103/PhysRevLett.117.048001. [DOI] [PubMed] [Google Scholar]
- Bonthuis D. J.; Netz R. R. Unraveling the combined effects of dielectric and viscosity profiles on surface capacitance, electro-osmotic mobility, and electric surface conductivity. Langmuir 2012, 28, 16049–16053. 10.1021/la3020089. [DOI] [PubMed] [Google Scholar]
- Teschke O.; Castro J. R.; Valente Filho J. F.; Soares D. M. Hydrated excess proton Raman spectral densities probed in floating water bridges. ACS Omega 2018, 3, 13977–13983. 10.1021/acsomega.8b02285. [DOI] [PMC free article] [PubMed] [Google Scholar]
- Teschke O.; Castro J. R.; Valente Filho J. F.; Soares D. M. Protonic charge defect structures in floating water bridges observed as Zundel and Eigen solvation arrangements. Chem. Phys. Lett. 2017, 685, 239–243. 10.1016/j.cplett.2017.07.063. [DOI] [Google Scholar]
- Liu X.-Z.; Li Q.; Egberts P.; Carpick R. W. Nanoscale Adhesive Properties of Graphene: The Effect of Sliding History. Adv. Mater. Inter. 2014, 1, 1300053–5. 10.1002/admi.201300053. [DOI] [Google Scholar]
- Amadei C. A.; Tang T. C.; Chiesa M.; Santos S. The aging of a surface and the evolution of conservative and dissipative nanoscale interactions. J. Chem. Phys. 2013, 139, 084708–4. 10.1063/1.4819267. [DOI] [PubMed] [Google Scholar]
- Cao P.; Xu K.; Varghese J. O.; Heath J. R. The Microscopic Structure of Adsorbed Water on Hydrophobic Surfaces under Ambient Conditions. Nano Lett. 2011, 11, 5581–5586. 10.1021/nl2036639. [DOI] [PubMed] [Google Scholar]
- Gil A.; Colchero J.; Luna M.; Gomez-Herrero J.; Baro A. Adsorption of water on solid surfaces studied by scanning force microscopy. Langmuir 2000, 16, 5086–5092. 10.1021/la9913304. [DOI] [Google Scholar]
- Kurkjian C. R.; Gebizlioglu O. S.; Mann J. D. Applications of atomic force microscopy to the study of lightguide fibers. Proc. SPIE 3848, Optical Fiber Reliability and Testing 1999, 3848, 144–150. 10.1117/12.372766. [DOI] [Google Scholar]
- Henniker J. C. The depth of the surface zone of a liquid. Rev. Mod. Phys. 1949, 21, 322–341. 10.1103/RevModPhys.21.322. [DOI] [Google Scholar]
- Olivieri J.-F.; Hynes J. T.; Laage D. Confined Waters Dielectric Constant Reduction Is Due to the Surrounding Low Dielectric Media and Not to Interfacial Molecular Ordering. J. Phys. Chem. Lett. 2021, 12, 4319–4326. 10.1021/acs.jpclett.1c00447. [DOI] [PubMed] [Google Scholar]
- Sato T.; Sasaki T.; Ohnuki J.; Umezawa K.; Takano M. Hydrophobic Surface Enhances Electrostatic Interaction in Water. Phys. Rev. Lett. 2018, 121, 206002–5. 10.1103/PhysRevLett.121.206002. [DOI] [PubMed] [Google Scholar]
- Motevaselian M. H.; Aluru N. R. Universal Reduction in Dielectric Response of Confined Fluids. ACS Nano 2020, 14, 12761–12770. 10.1021/acsnano.0c03173. [DOI] [PubMed] [Google Scholar]
- Teschke O.; Castro J. R.; Gomes W. E.; Soares D. M. Hydrogen bonding arrangement of ice II observed in interfacial water attached on hydrophobic and hydrophilic surfaces. Chem. Phys. Lett. 2021, 775, 138655. 10.1016/j.cplett.2021.138655. [DOI] [Google Scholar]
- Dash J. D. Surface melting. Contemp. Phys. 1989, 30, 89–93. 10.1080/00107518908225509. [DOI] [Google Scholar]
- Broughton J. Q.; Gilmer G. H. Molecular dynamics investigation of the crystal–fluid interface. IV. Free energies of crystal–vapor systems. J. Chem. Phys. 1986, 84, 5741–5745. 10.1063/1.449882. [DOI] [Google Scholar]
- Broughton J. Q.; Gilmer G. H. Molecular dynamics of the crystal-fluid interface, V. Structure and dynamics of crystal-melt systems. J. Chem. Phys. 1986, 84, 5749–5753. 10.1063/1.449883. [DOI] [Google Scholar]
- Broughton J. Q.; Gilmer G. H. Molecular dynamics investigation of the crystal-fluid interface. VI. Excess surface free energies of crystal-liquid systems. J. Chem. Phys. 1986, 84, 5759–5763. 10.1063/1.449884. [DOI] [Google Scholar]
- Lu J. R.; Thomas R. K. Neutron reflection from wet interfaces. J. Chem. Soc. Faraday Trans. 1998, 94, 995–999. 10.1039/a707853f. [DOI] [Google Scholar]
- Fumagalli L.; Esfandiar A.; Fabregas R.; Hu S.; Ares P.; Janardanan A.; Yang Q.; Radha B.; Taniguchi T.; Watanabe K.; Gomila G.; Novoselov K.; Geim A. K. Anomalously low dielectric constant of confined water. Science 2018, 360, 1339–1342. 10.1126/science.aat4191. [DOI] [PubMed] [Google Scholar]
- Shi Z.; Wei S.; Ford J. V.; Castleman A. W. Jr. Clathrate structures in water-methanol mixed clusters. Chem. Phys. Lett. 1992, 200, 142–146. 10.1016/0009-2614(92)87059-X. [DOI] [Google Scholar]
- Yang X.; Castleman A. W. Jr. Large protonated water clusters H+(H2O)n (1.ltorEquation n > 60): the production and reactivity of clathrate-like structures under thermal conditions. J. Am. Chem. Soc. 1989, 111, 6845–6849. 10.1021/ja00199a056. [DOI] [Google Scholar]
- Yang X.; Castleman A. W. Jr. Production and magic numbers of large hydrated anion clusters X-(H2O)N = 0–59 (X = hydroxyl, oxygen atom or molecule, and ozone) under thermal conditions. J. Phys. Chem. 1990, 94, 8500–8504. 10.1021/j100386a003. [DOI] [Google Scholar]
- Selinger A.; Castleman A. W. Jr. Evidence for the engagement of alkali metal ions through the formation of gas-phase clathrates: cesium(1+) in water clusters. J. Phys. Chem. 1991, 95, 8442–8445. 10.1021/j100175a008. [DOI] [Google Scholar]
- Steel E. A.; Merz K. M. Jr.; Selinger A.; Castleman A. W. Jr. Mass spectral and computational free energy studies of alkali metal ion-containing water clusters. J. Phys. Chem. 1995, 99, 7829–7833. 10.1021/j100019a073. [DOI] [Google Scholar]
- Debye P.; Huckel E. De la theorie des electrolytes. I. abaissement du point de congelation et phenomenes associes. Phys. Z. 1923, 24, 185–189. [Google Scholar]
- Pohl H. A.; Schwar J. P. Particle Separations by Nonuniform Electric Fields in Liquid Dielectrics, Batch Methods. J. Electrochem. Soc. 1960, 107, 383–386. 10.1149/1.2427704. [DOI] [Google Scholar]
- Fukuma T.; Ueda Y.; Yoshioka S.; Asakawa H. Atomic-Scale Distribution of Water Molecules at the Mica-Water Interface Visualized by Three-Dimensional Scanning Force Microscopy. Phys. Rev. Lett. 2010, 104, 016101–4. 10.1103/PhysRevLett.104.016101. [DOI] [PubMed] [Google Scholar]
- Uhlig M. R.; Jimenez D. M.; Garcia R. Atomic-scale mapping of hydrophobic layers on graphene and few-layer MoS2 and WSe2 in water. Nat. Commun. 2019, 10, 2606–2611. 10.1038/s41467-019-10740-w. [DOI] [PMC free article] [PubMed] [Google Scholar]


