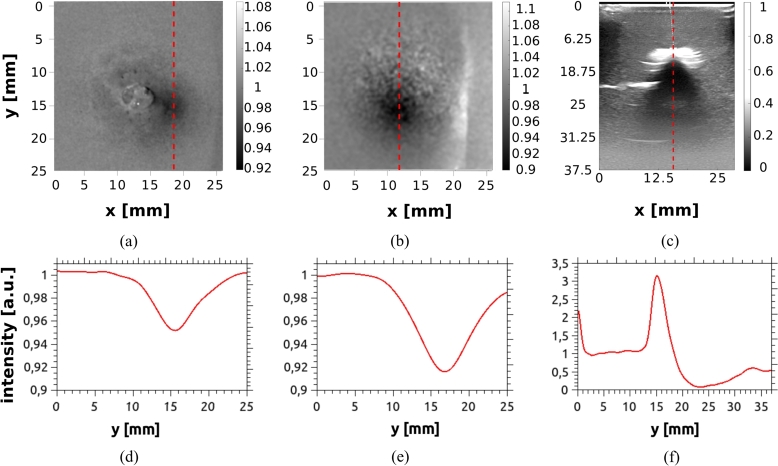
Figure 12.
Images of the phantom A5: (a) DOI in reflectance geometry, (b) DOI in transmittance geometry, and (c) US image. Subplots (d), (e) and (f) show the intensity profiles obtained for each image along the red dashed lines drawn in the respective upper Figures. To obtain smoother profiles, a low-pass filter was applied to all of the images.

