

Abstract
OBJECTIVE
Youth football athletes are exposed to repetitive subconcussive head impacts during normal participation in the sport, and there is increasing concern about the long-term effects of these impacts. The objective of the current study was to determine if strain-based cumulative exposure measures are superior to kinematic-based exposure measures for predicting imaging changes in the brain.
METHODS
This prospective, longitudinal cohort study was conducted from 2012 to 2017 and assessed youth, male football athletes. Kinematic data were collected at all practices and games from enrolled athletes participating in local youth football organizations in Winston-Salem, North Carolina, and were used to calculate multiple risk-weighted cumulative exposure (RWE) kinematic metrics and 36 strain-based exposure metrics. Pre- and postseason imaging was performed at Wake Forest School of Medicine, and diffusion tensor imaging (DTI) measures, including fractional anisotropy (FA), and its components (CL, CP, and CS), and mean diffusivity (MD), were investigated. Included participants were youth football players ranging in age from 9 to 13 years. Exclusion criteria included any history of previous neurological illness, psychiatric illness, brain tumor, concussion within the past 6 months, and/or contraindication to MRI.
RESULTS
A total of 95 male athletes (mean age 11.9 years [SD 1.0 years]) participated between 2012 and 2017, with some participating for multiple seasons, resulting in 116 unique athlete-seasons. Regression analysis revealed statistically significant linear relationships between the FA, linear coefficient (CL), and spherical coefficient (CS) and all strain exposure measures, and well as the planar coefficient (CP) and 8 strain measures. For the kinematic exposure measures, there were statistically significant relationships between FA and RWE linear (RWEL) and RWE combined probability (RWECP) as well as CS and RWEL. According to area under the receiver operating characteristic (ROC) curve (AUC) analysis, the best-performing metrics were all strain measures, and included metrics based on tensile, compressive, and shear strain.
CONCLUSIONS
Using ROC curves and AUC analysis, all exposure metrics were ranked in order of performance, and the results demonstrated that all the strain-based metrics performed better than any of the kinematic metrics, indicating that strain-based metrics are better discriminators of imaging changes than kinematic-based measures. Studies relating the biomechanics of head impacts with brain imaging and cognitive function may allow equipment designers, care providers, and organizations to prevent, identify, and treat injuries in order to make football a safer activity.
Keywords: head impact exposure, subconcussive impacts, diffusion tensor imaging, finite element, brain strain, youth football, trauma
Approximately 2.8 to 3.5 million athletes participate in organized football at the youth level in the United States.1 In addition to the high rate of concussion, football athletes are also exposed to repetitive subconcussive head impacts that occur during normal participation in the sport. As more studies link brain changes and neurological deficits to repetitive subconcussive head impacts, understanding the long-term effects of this exposure is increasingly critical.2–4 The biomechanical basis of subconcussive head impacts and the effects of cumulative head impact exposure are not well understood, despite extensive studies characterizing head impact exposure at all levels of football.5–8 To better understand how repetitive, subconcussive impacts affect the brain, the relationship between brain strain and imaging changes in the brain should be comprehensively explored, particularly in the absence of clinically diagnosed concussion.
Head impact exposure has been quantified in many ways over the years. Head kinematics, such as peak linear and rotational acceleration, are often used to evaluate injury risk because they are simple and more reliable to measure than tissue-level brain response. Numerous injury metrics involving various kinematic measures are widely used, and many are the current standard in sports and automotive safety; however, it remains unclear if any single kinematic measure or kinematic-based metric is a good discriminator of injury.9–11 Many of these kinematic-based metrics consider only the peak values of kinematic response parameters and do not account for region-specific responses or impact orientation. In contrast, finite element (FE) models allow estimation of tissue-level brain strain and have shown promise in correlating with brain injury and tissue changes, which suggests that this may be the way forward to identify a superior metric for brain injury discrimination.12–14 Furthermore, FE models are promising, given the importance of injury location and the ability of these models to quantify brain response in specific regions of interest (ROIs). Additionally, there have been recent improvements to many brain FE models that allow easier and more direct comparison with imaging findings.15–17
The effects of subconcussive impacts can be studied using diffusion tensor imaging (DTI), an MRI technique that detects the motion of water molecules with the use of motion sensitizing gradients. In addition to providing the ability to perform fiber tracking, multiple diffusion metrics can be derived from DTI, such as fractional anisotropy (FA) and mean diffusivity (MD). Furthermore, the linear (CL), planar (CP), and spherical (CS) coefficients of FA can be characterized to further explain the shape of the diffusion ellipsoid. These diffusivity metrics allow quantification and analysis of the microstructural causes of abnormal FA.
Diffusion in healthy white matter (WM) is highly anisotropic, so a reduction in diffusion anisotropy generally indicates structural changes caused by axonal injury, demyelination, and other pathological processes.18 FA and MD are the most commonly reported DTI metrics believed to describe overall WM health, maturation, and organization, and FA has been used to assess overall WM integrity in studies of mild traumatic brain injury (mTBI).19,20 DTI has been successful in revealing slight underlying changes in WM integrity in the absence of clinically diagnosed concussion, which can be useful to understand the effects of subconcussive impacts.21 DTI-derived metrics, such as FA and MD, are able to detect relatively small longitudinal changes and are also important in tracking brain development.22,23 There is growing evidence that FA values increase in both acute and chronic phases of mTBI, with abnormalities typically identified in the corpus callosum.13,24–26 Davenport et al.27 demonstrated associations between changes in DTI metrics and head impact exposure over a single season of high school football. Bazarian et al.28 found similar results in a single season of collegiate football; changes in DTI-derived metrics correlated with helmet impact measures. Additionally, Saghafi et al.29 measured detectable changes in WM integrity, estimated by FA, between low- and high-impact exposure groups of adolescent football players. A retrospective analysis of high school football players using counts of head acceleration events and longitudinal diffusion-weighted imaging found that the athletes’ brains exhibited greater volumes experiencing substantial changes in both FA and MD than brains of peers who do not participate in collision-based sports.30 Additionally, the extent of changes in FA and MD in the athletes was found to be significantly correlated with the cumulative exposure to head impacts exceeding 20g.30
The primary objective of this study was to determine if strain-based exposure measures are superior to kinematic-based exposure measures for predicting MRI changes in the brain over the course of a single season of football. To perform this analysis, head kinematics were collected to quantify cumulative head impact exposure during single seasons of youth football using both strain-based and kinematic-based measures; additionally, associated brain changes were measured with MRI and quantified using DTI metrics. By examining the relationship of the biomechanics and imaging measures for each athlete, we could determine if the cumulative effects of head impacts over the course of a single season would produce detectable DTI changes in the absence of clinically diagnosed concussion, and if there were a biomechanics metric (or group of metrics) that could reliably elucidate these changes with respect to exposure.
Methods
Players from local youth football organizations were included in the current study, which was approved by the Wake Forest School of Medicine IRB committee. Exclusion criteria included any history of previous neurological illness, psychiatric illness, brain tumor, concussion within the past 6 months, and/or contraindication to MRI. All participants were instrumented with the Head Impact Telemetry System (HITS) (Simbex), which measures real-time kinematic response to head impacts during all practices and games. Participants also underwent baseline pre- and postseason MRI and Immediate Post-Concussion Assessment and Cognitive Testing (ImPACT). Additional protocol and data collection information has been previously reported at length.7,27,31 This study used data collected over 6 years (2012–2017) from athletes with complete biomechanics data sets, defined as collected biomechanics for > 75% of the season practice and game sessions, and complete (pre- and postseason) and high-quality MRI data sets. Some MRI data sets were excluded for motion and other similar reasons.
Exposure Metrics
The first quantification of head impact exposure for each athlete was based on risk-weighted cumulative exposure (RWE). For a given athlete, RWE is calculated using a nonlinear weighted sum of all head impacts, representing injury risk, sustained over the course of a single season.7 The risk of injury for each impact was calculated using 3 different functions previously described in the literature: 1) linear acceleration, 2) rotational acceleration, and 3) the combined probability from linear and rotational acceleration (RWE equations for each risk function can be found in Miller et al.32).9,33,34 To generate RWE values, the risk for each head impact sustained over the season was summed for each respective risk function; the linear, rotational, and combined probability cumulative metrics are referred to as RWEL, RWER, and RWECP, respectively. Studies have shown that RWE is favorable to previously described exposure metrics because it is based on the player-specific distribution of impacts and the impact-specific risk of concussion for each impact over the season for each player.
Head impact exposure was also quantified with the aid of a detailed brain FE model, the atlas-based brain model (ABM) (Fig. 1). In the current study, kinematics collected with HITS were used to estimate 6-degrees-of-freedom (6DOF) kinematic load curves, which were then used as inputs to the FE model to estimate strain in every brain element in the ABM. The strain distributions obtained from the ABM simulations are used to calculate a set of 36 scalar strain metrics, previously developed and reported by Miller et al.,32 that characterize the response of the brain. The 36 metrics consist of 3 distinct metric groups based on 1) tensile strain, 2) compressive strain, and 3) shear strain. Each group includes metrics based on strain, strain rate, a combination of strain and strain rate, and several volumetric metrics derived from the cumulative strain damage measure curve,35 which characterizes the relationship between strain and the percentage of brain volume exceeding a given strain value. The first volumetric metric is referred to as the volumetric strain measure (VSM) for the tensile and compressive strain groups and as the volumetric shear strain measure (VSSM) for shear strain. An analogous metric was derived from the relationship between strain rate and brain volume called the volumetric strain rate measure (VSRM) for tensile and compressive strain and volumetric shear strain rate measure (VSSRM) for shear strain. Metric names, descriptions, and abbreviations are reported in Table 1 for the strain-based metrics considered in the current study. Cumulative strain metrics were then computed for each athlete by summing the values associated with the 36 metrics calculated for each impact measured over the course of a season. These cumulative metrics are identified by the addition of the summation symbol, Σ, to each metric name. Additional details on the FE brain model,32 estimation of 6DOF time history from HITS data,36 FE simulation technique,37 and strain estimation methods32 have been previously reported.
FIG. 1.

Isometric view of the ABM showing internal structures (left) and a detailed view of the surface of the brain showing sulci and gyri (right).
TABLE 1.
Tensile, compressive, and shear categories of strain-based biomechanics exposure metrics
| Metric Description | Tensile (ε1) | Compressive (ε3) | Shear (γ) |
|---|---|---|---|
| Strain (95th%)* | ε 1,95 | ε3,5 | γ 95 |
| Strain (100th%) | ε 1,100 | ε3,0 | γ 100 |
| Strain rate (95th%) | |||
| Strain rate (100th%) | |||
| Strain × strain rate (95th%) | |||
| Strain × strain rate (100th%) | |||
| VSM | VSM1 | VSM3 | VSSM |
| VSRM | VSRM1 | VSRM3 | VSSRM |
| VSM × strain (95th%) | VSM1 × ε1,95 | VSM3 × ε3,5 | VSSM × γ95 |
| VSM × strain (100th%) | VSM1 × ε1,100 | VSM3 × ε3,0 | VSSM × γ100 |
| VSM × strain rate (95th%) | |||
| VSM × strain rate (100th%) |
Compressive strain metrics use 5th and 0th percentiles instead of 95th and 100th percentiles.
The computational and visualization capability of the ABM is demonstrated in Fig. 2 for two example head impacts, a lateral impact of 40.6g and a frontal impact of 33.5g. Using the principal strains for each brain element, the top 5% of elements experiencing tensile and compressive strain can be identified and compared. The two upper images in Fig. 2 show the 5% of brain elements (approximately 82,000 elements) experiencing the greatest tensile strain and the lower two images show the 5% of elements experiencing the greatest compressive strain. The elements that are only in the top 5% for tensile or compressive strain are displayed in red or blue, respectively, while elements in the top 5% for both tensile and compressive strain are displayed in purple. For the lateral impact, approximately 52,000 elements were in the top 5% for both tensile and compressive strain and approximately 47,500 elements for the frontal impact. The variance in spatial distribution of high-strain elements for these different impacts offers clues as to possible reasons why FE metrics outperform kinematics to elucidate imaging changes.
FIG. 2.

Brain elements experiencing the top 5% of tensile strain (ε1) values (red) and compressive strain (ε3) values (blue) during a lateral impact (left; 40.6g, 2423.6 rad/s2) and during a frontal impact (right; 33.5g, 1842.5 rad/s2). Elements that fall in the top 5% for both tensile and compressive strain are displayed in purple.
MRI Acquisition and Processing
MRI data were obtained on a 3-T Siemens Skyra MRI scanner using a high-resolution 32-channel head/neck coil (Siemens Healthcare) in accordance with the National Institute of Neurological Disorders and Stroke Common Data Elements advanced protocol recommendations. Diffusion imaging was acquired under two protocols over the course of the study; diffusion protocol 1 was used from 2012 to 2013 and diffusion protocol 2 was used from 2014 to 2017. Protocol parameters, as well as diffusion tensor preprocessing and computation of DTI scalar metrics, have been previously reported by Davenport et al.27,31
DTI Metrics
Delta (postseason – preseason) maps were computed for each DTI scalar metric (FA, MD, CL, CP, and CS) for the whole brain for each athlete as well as for a group of 16 noncontact controls. The group mean and standard deviation of the control delta maps was used to calculate voxel-wise z-scores for each scalar metric thresholded at ± 2 SDs from the control group mean to identify abnormally high or low DTI metric scalars for each participant. The total number of identified abnormal voxels was summed for each participant to arrive at a scalar value for each DTI metric representing a measure of change over the season, while accounting for any baseline differences in DTI values and effects of maturation (both increases and decreases in DTI scalar metrics were considered).27,31 A threshold requiring a minimum of 1-mL contiguous volume was applied to reduce false positives in abnormal voxel identification.
Comparison of Biomechanics and Imaging Data
Linear regression analyses were performed to examine the relationships between biomechanics (kinematic-based and strain-based metrics) and brain imaging. For the primary linear regression analysis, the number of abnormal FA voxels was used as the dependent variable, and a log transformation was applied to improve normality. Similar analyses were performed using MD and the subcomponents of FA (CL, CP, and CS). Participant age at the preseason time point, weight, time between scans, and diffusion imaging protocol were used as covariates. Cook’s distance (or Cook’s D) was computed for each data point, and if Cook’s D was > 0.0345 (4/n, where n = 116), that observation was considered an outlier and removed for the corresponding regression analysis. A post hoc Bonferroni correction was applied to the α = 0.05 significance level to adjust for multiple comparisons.
To examine whether strain-based metrics were better discriminators of head impact exposure than kinematic-based measures, receiver operating characteristic (ROC) analysis was performed for all biomechanics exposure metrics using changes in DTI measures as a classifier variable. The area under the ROC curve (AUC) quantifies the degree or level of discrimination and ranges in value from 0 to 1, with values closer to 1 indicating a metric is better able to elucidate pre- to postseason changes in the imaging measure considered.
Results
Complete biomechanics and imaging data sets were collected for 95 athletes between 2012 and 2017. There were 116 unique athlete-seasons (17 of the athletes participated for 2 seasons and 2 athletes participated for 3 seasons). The participants were all male, with a mean age of 11.9 years (SD 1.0 years), mean weight of 50.2 kg (SD 10.3 kg), and mean time between pre- and postseason scans of 4.5 months (SD 0.9 months). The median/95th percentile RWEL, RWER, and RWECP values were 0.062/0.285, 0.048/1.250, and 0.177/1.774, respectively. Summary statistics for the 36 strain metrics and their distributions were reported by Miller et al.32
The number of abnormal voxels were calculated to determine the value of each DTI scalar (FA, MD, CL, CP, and CS). The number of abnormal voxels ranged from approximately 10,000 to 250,000, representing approximately 0.6% and 15% of the brain volume, respectively. The mean values of the log-transformed DTI scalars were 4.625 (SD 0.272), 4.664 (SD 0.339), 4.645 (SD 0.234), 4.661 (SD 0.200), and 4.619 (SD 0.278) for FA, MD, CL, CP, and CS, respectively.
Results of the linear regression analyses performed between the biomechanics and DTI metrics are reported in Table 2. To adjust for multiple comparisons, a post hoc correction was applied to the significance level, resulting in a Bonferroni significance level of α = 0.00025641. For the covariate adjusted results, relationships between FA, CL, and CS and all 36 strain metrics were statistically significant; there were 8 statistically significant pairings between CP and the strain metrics and no statistically significant relationships for any MD metric pairing. Statistically significant relationships for the RWE metrics included RWEL and RWECP with FA, and RWEL with CS (Table 2). In general, the relationships between the DTI and the strain-based metrics were stronger than those between DTI and RWE metrics. For FA, the r2 values range from 0.186 to 0.256 for the RWE metrics and from 0.283 to 0.298 for the strain-based metrics. The exposure metric with the strongest relationship to FA was , which explained 29.8% of the variance in FA (p < 0.0001). Of the 5 DTI scalars, MD consistently displayed the weakest relationship to all biomechanics exposure metrics, with an average r2 value of 0.180, compared with averages of 0.285, 0.295, 0.206, and 0.270 for FA, CL, CP, and CS, respectively. As with FA, the results for CL, CP, and CS display stronger relationships with the strain metrics than with the RWE metrics. The strain metric with the strongest relationship to both CL and CP is ΣVSM1 × , explaining 30.4% (p < 0.0001) and 22.8% (p = 0.0001) of the variance for the linear and planar components, respectively. For CS, the strongest relationship was with , explaining 29.6% (p < 0.0001) of the variance.
TABLE 2.
Associations between biomechanics metrics and changes in DTI measures
| r2 (w/ covariate adjustment) | Average | |||||
|---|---|---|---|---|---|---|
| FA | MD | CL | CP | CS | ||
| RWEL | 0.2557 | 0.1700 | 0.1932 | 0.1900 | 0.2303 | 0.208 |
| RWER | 0.1855 | 0.1864 | 0.1622 | 0.1732 | 0.1761 | 0.177 |
| RWECP | 0.2132 | 0.1639 | 0.1502 | 0.1614 | 0.1887 | 0.175 |
| Σε1,95 | 0.2952 | 0.1781 | 0.2876 | 0.2033 | 0.2945 | 0.252 |
| Σε1,100 | 0.2962 | 0.1778 | 0.2881 | 0.2031 | 0.2951 | 0.252 |
| 0.2953 | 0.1784 | 0.2868 | 0.2032 | 0.2719 | 0.247 | |
| 0.2979 | 0.1787 | 0.2904 | 0.2055 | 0.2962 | 0.254 | |
| 0.2832 | 0.1825 | 0.2987 | 0.2236 | 0.2635 | 0.250 | |
| 0.2857 | 0.1824 | 0.3022 | 0.2062 | 0.2654 | 0.248 | |
| ΣVSM1 | 0.2956 | 0.1782 | 0.2880 | 0.2035 | 0.2948 | 0.252 |
| ΣVSRM1 | 0.2957 | 0.1784 | 0.2876 | 0.2037 | 0.2720 | 0.248 |
| ΣVSM1 × ε1,95 | 0.2841 | 0.1827 | 0.3011 | 0.2060 | 0.2648 | 0.248 |
| ΣVSM1 × ε1,100 | 0.2856 | 0.1825 | 0.3030 | 0.2069 | 0.2659 | 0.249 |
| 0.2834 | 0.1827 | 0.2991 | 0.2237 | 0.2636 | 0.251 | |
| 0.2871 | 0.1832 | 0.3042 | 0.2276 | 0.2663 | 0.254 | |
| Σε3,5 | 0.2953 | 0.1781 | 0.2878 | 0.2033 | 0.2946 | 0.252 |
| Σε3,0 | 0.2964 | 0.1778 | 0.2880 | 0.2029 | 0.2952 | 0.252 |
| 0.2954 | 0.1784 | 0.2869 | 0.2032 | 0.2720 | 0.252 | |
| 0.2976 | 0.1791 | 0.2901 | 0.2058 | 0.2959 | 0.247 | |
| 0.2837 | 0.1826 | 0.2997 | 0.2050 | 0.2640 | 0.247 | |
| 0.2848 | 0.1824 | 0.3006 | 0.2242 | 0.2641 | 0.251 | |
| ΣVSM3 | 0.2957 | 0.1782 | 0.2881 | 0.2035 | 0.2949 | 0.254 |
| ΣVSRM3 | 0.2957 | 0.1784 | 0.2876 | 0.2037 | 0.2720 | 0.248 |
| ΣVSM3 × ε3,5 | 0.2843 | 0.1826 | 0.3015 | 0.2060 | 0.2650 | 0.248 |
| ΣVSM3 × ε3,0 | 0.2855 | 0.1822 | 0.3026 | 0.2063 | 0.2656 | 0.248 |
| 0.2837 | 0.1827 | 0.2996 | 0.2240 | 0.2639 | 0.251 | |
| 0.2863 | 0.1835 | 0.3027 | 0.2269 | 0.2654 | 0.253 | |
| Σγ95 | 0.2953 | 0.1781 | 0.2878 | 0.2033 | 0.2946 | 0.252 |
| Σγ100 | 0.2966 | 0.1776 | 0.2884 | 0.2029 | 0.2954 | 0.252 |
| 0.2954 | 0.1783 | 0.2869 | 0.2032 | 0.2720 | 0.247 | |
| 0.2968 | 0.1787 | 0.2883 | 0.2045 | 0.2953 | 0.253 | |
| 0.2834 | 0.1824 | 0.2994 | 0.2049 | 0.2637 | 0.247 | |
| 0.2856 | 0.1820 | 0.3023 | 0.2060 | 0.2650 | 0.248 | |
| ΣVSSM | 0.2957 | 0.1782 | 0.2880 | 0.2035 | 0.2949 | 0.252 |
| ΣVSSRM | 0.2957 | 0.1784 | 0.2875 | 0.2037 | 0.2720 | 0.248 |
| ΣVSSM × γ95 | 0.2843 | 0.1826 | 0.3015 | 0.2061 | 0.2649 | 0.248 |
| ΣVSSM × γ100 | 0.2860 | 0.1821 | 0.3036 | 0.2068 | 0.2660 | 0.249 |
| 0.2836 | 0.1825 | 0.2996 | 0.2243 | 0.2636 | 0.251 | |
| 0.2860 | 0.1830 | 0.3021 | 0.2265 | 0.2650 | 0.253 | |
Boldface type indicates statistical significance (p < 0.05). Bonferroni correction for multiple comparisons.
For the ROC analysis, FA was used as the classifier variable to distinguish between greater and lesser amounts of DTI change over the season. An ROC curve was generated for each biomechanics exposure metric to quantify the ability of the given metric to group athletes in respective “high” and “low” exposure groups. Figure 3 shows ROC curves for example RWE, tensile, compressive, and shear strain metrics. AUC values for all metrics are reported in Table 3 and range from 0.579 for RWEL to 0.669 for ΣVSM3.
FIG. 3.

Example ROC curves for 1 metric from each metric group (kinematic, tensile strain, compressive strain, and shear strain).
TABLE 3.
AUC and AUC rank of all biomechanics exposure metrics
| Metric | AUC | AUC Rank |
|---|---|---|
| RWEL | 0.5791 | 39 |
| RWER | 0.6076 | 38 |
| RWECP | 0.6449 | 37 |
| Σε1,95 | 0.6631 | 20 |
| Σε1,100 | 0.6643 | 12 |
| 0.6647 | 10 | |
| 0.6683 | 2 | |
| 0.6595 | 25 | |
| 0.6572 | 33 | |
| ΣVSM1 | 0.6647 | 9 |
| ΣVSRM1 | 0.6651 | 7 |
| ΣVSM1 × ε1,95 | 0.6595 | 26 |
| ΣVSM1 × ε1,100 | 0.6583 | 31 |
| 0.6603 | 22 | |
| 0.6659 | 4 | |
| Σε3,5 | 0.6635 | 18 |
| Σε3,0 | 0.6639 | 17 |
| 0.6647 | 11 | |
| 0.6643 | 13 | |
| 0.6587 | 28 | |
| 0.6568 | 34 | |
| ΣVSM3 | 0.6690 | 1 |
| ΣVSRM3 | 0.6651 | 8 |
| ΣVSM3 × ε3,5 | 0.6587 | 29 |
| ΣVSM3 × ε3,0 | 0.6579 | 32 |
| 0.6603 | 23 | |
| 0.6643 | 14 | |
| Σγ95 | 0.6643 | 15 |
| Σγ100 | 0.6635 | 19 |
| 0.6655 | 5 | |
| 0.6667 | 3 | |
| 0.6591 | 27 | |
| 0.6564 | 35 | |
| ΣVSSM | 0.6643 | 16 |
| ΣVSSRM | 0.6655 | 6 |
| ΣVSSM × γ95 | 0.6587 | 30 |
| ΣVSSM × γ100 | 0.6564 | 36 |
| 0.6599 | 24 | |
| 0.6623 | 21 |
Boldface type indicates the top 5 metrics according to the AUC.
Discussion
This cohort study is the first report of a quantitative relationship between strain-based head impact exposure metrics and DTI scalars in nonconcussed athletes and provides evidence that strain-based cumulative metrics are better discriminators of head impact exposure than kinematic-based metrics. The 5 metrics with the greatest ability to distinguish between high and low exposure were all strain-based metrics.
Table 2 shows that the strain-based metrics were found to have stronger and more consistent statistically significant relationships to the DTI scalars than the RWE metrics. A common yardstick for interpreting correlation coefficients is based on Cohen’s work in which a correlation of 0.10 is considered “weak,” a correlation of 0.30 is considered “moderate,” and a correlation of 0.50 is considered “strong.” The maximum r2 value from Table 2 of 0.30 corresponds to a correlation of 0.55, which would be considered a strong correlation using Cohen’s rating.38,39 For the RWE metrics, there were only 3 significant relationships to any DTI scalar, which were between FA and RWEL and RWECP, as well as CS and RWEL. For 4 of the DTI scalars (FA, CL, CP, and CS), RWEL explained slightly more variance than either RWER or RWECP, ranging from 19.0% to 25.6%. For MD, RWER explained more of the variance (18.6%) than the other RWE metrics. This finding differs from the results of Davenport et al.,27 who found that RWECP explained the most variance for all 5 DTI scalars in a cohort of high school football athletes.
In general, the strain-based metrics explained more variance and displayed a greater number of significant relationships than the RWE metrics. As shown in Table 2, the average r2 values by biomechanics metric are relatively consistent for all 36 strain metrics, with average values of 0.250 for all 3 metric groups (tensile, compressive, and shear), while the 3 RWE metrics have much lower r2 values (0.208, 0.177, and 0.175). The exposure metric displaying the weakest relationship with the DTI scalars was RWECP, while the exposure metrics displaying the strongest relationships were , ΣVSM1 × , and .
Our primary hypothesis was that FE strain-based metrics would better explain DTI changes, specifically changes in FA, than kinematic-based metrics. Relationships between the number of abnormal FA voxels and exposure metrics resulted in statistically significant relationships for all 36 strain-based exposure metrics but only for 2 of the 3 kinematic metrics examined (RWEL and RWECP). RWEL, RWER, and RWECP explained 25.6%, 18.6%, and 21.3% of the variance in abnormal FA voxels. Examining the relationships between changes in FA and the first set of strain-based metrics (those based on tensile strain), the strongest associations are with , Σε1,100, ΣVSM1 and ΣVSRM1, explaining 29.8%, 29.6%, 29.6%, and 29.6% of the variance, respectively. For the compression strain metrics, the strongest relationships are with , Σε3,0, ΣVSM3, and ΣVSRM3, which all explain at least 29.6% of the variance. For the shear metrics, the strongest metrics are Σγ100, , ΣVSSM, and ΣVSSRM, explaining between 29.6% and 29.7% of the variance. Figure 4 shows the relationships between the FA scalar metric and all 3 RWE metrics, as well as the 4 metrics with the strongest relationships derived from tensile strain, compressive strain, and shear strain.
FIG. 4.
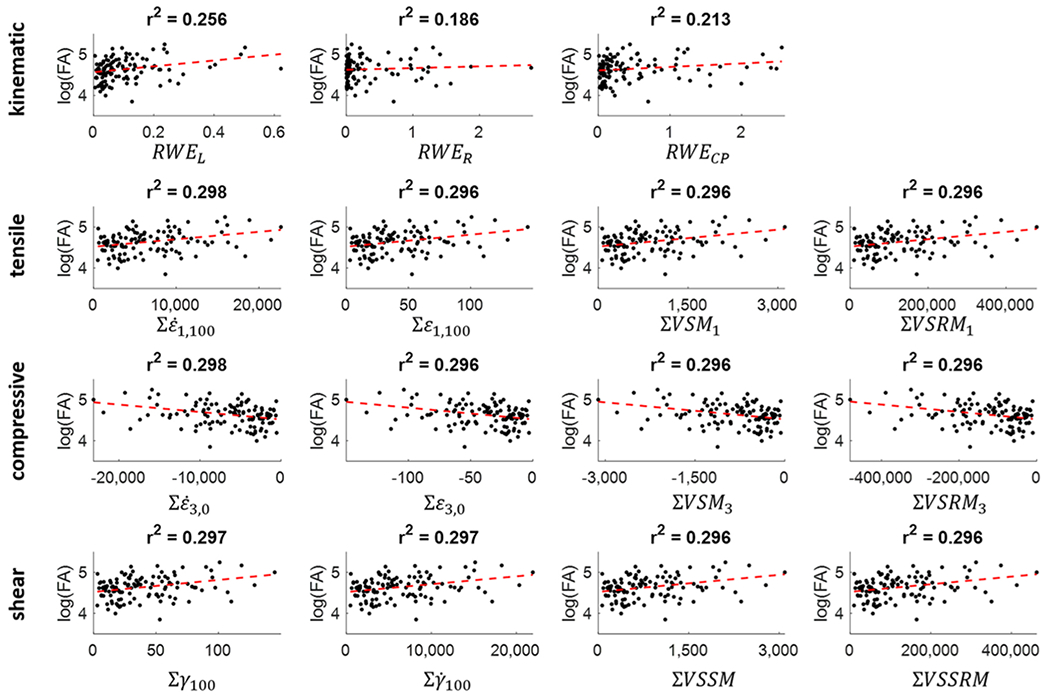
Scatterplots showing the relationships between the number of abnormal FA voxels and the 3 kinematic metrics, as well as the 4 metrics with the strongest association to FA from the tensile, compressive, and shear strain metric groups.
Overall, the most significant relationship was between ΣVSM1 × and CL (Fig. 5, left), explaining 30.4% of the variance in abnormal voxels (p < 0.0001). Similarly, Davenport et al.27 also reported that CL was the DTI scalar with the strongest relationship to exposure. However, the authors reported that RWECP had the most significant relationship to CL and explained 50.4% of the variance. For comparison, the relationship between RWECP and CL in the current study explained 15.0% of the variance in CL (Fig. 5, right).
FIG. 5.

Scatterplots showing the relationship between ΣVSM1 × and CL (left) and between RWECP and CL (right).
The 39 biomechanics exposure metrics (3 RWE, 12 tensile strain, 12 compressive strain, and 12 shear strain) were ranked according to the AUC values determined from the corresponding ROC curves, with values closer to 1 indicating better performance (Table 3). AUC values for all the exposure metrics examined ranged from 0.579 for RWEL to 0.669 for ΣVSM3. Table 3 displays the rank order for all exposure metrics examined in the current study based on determined AUC values and reveals that the 3 kinematic metrics rank as the 3 worst-performing metrics for discriminating imaging changes. The mean AUC value for the kinematic metrics is 0.611 (SD 0.003) compared with 0.663 (SD 0.003), 0.662 (SD 0.004), and 0.662 (SD 0.004) for the tensile, compressive, and shear strain metric groups, respectively. The top 5 metrics according to the AUC analysis were ΣVSM3, , , ΣVSM1 × , and . Of the 3 kinematic-based metrics, RWECP performs the best, followed by RWER, then RWEL. These findings, which show that RWECP is the best-performing kinematic metric and that RWER is a better discriminator than RWEL, are more in line with current thinking regarding rotational kinematics as the primary contributor to mTBI and a superior predictor of injury risk than linear acceleration alone.5,11 The current study also shows that strain-based metrics are superior to kinematic-based metrics at discriminating DTI changes in the brain over a season of football.
These results support the basic hypothesis that strain-based metrics better explain variance in imaging results than kinematic-based metrics. Additionally, strain metrics have the capacity to provide information on regional brain response and allow a more nuanced exploration of regional strain variation. While a regional analysis was not performed in the current study, future work will employ the approach to study the correlation between regions of higher strain and distribution of abnormal voxels. The variance in spatial distribution of the strain response, visualized in Fig. 2, provides possible explanations as to why FE metrics outperform kinematics with relation to imaging changes since kinematic-based metrics cannot capture any spatial variance. As we study these metrics more, FE analysis will provide a way to elucidate the true correlation between regional strain metrics and DTI changes, and, thus, we will be able to better predict to whom and to what degree subconcussive injury is occurring. This will allow greater exploration of whether specific brain regions or networks are associated with certain structural and cognitive changes. Additionally, while the current study presents novel findings in the strain metric analysis, the mechanisms associated with the different types of strain metrics (tensile, compressive, and shear) need to be further studied.
Limitations
One limitation to the current study is sample size. While the sample size is relatively small, this study represents one of the largest studies to date of youth football players that includes biomechanics and pre- to postseason imaging data and DTI analysis. Additionally, there is error associated with experimental, biomechanics data collection methods as well as the FE simulation techniques used to calculate strain-based metrics, including the estimation of 6DOF kinematics from HITS outputs. We have determined, however, that the 6DOF curves generated by the previously developed algorithm estimate kinematics to a degree sufficient for use in FE simulation.36 Finally, this study only considers whole-brain metrics; future work will include regional analyses which may strengthen the relationship between biomechanics and imaging metrics.
Conclusions
In the current study, we have shown that strain-based metrics outperform kinematic-based metrics to explain subconcussive MRI changes in the brain over the course of a single season of football. We demonstrated a significant relationship between changes in DTI measures and cumulative head impact exposure using strain-based biomechanical metrics in the absence of clinical concussion. Using ROC curves and AUC analysis, all 39 exposure metrics considered in the current study were ranked in order of performance and the results demonstrated that all the strain-based metrics performed better than any of the kinematic metrics. The top 5 metrics according to the presented AUC analysis were ΣVSM3, , , ΣVSM1 × , and . One of these top-performing metrics was based on compressive strain and 2 were volumetric strain measures, both of which are new classes of metrics recently reported by Miller et al.32 These data add to the growing body of literature providing evidence that a single season of play in a contact sport can produce brain changes in the absence of concussion or clinical findings, and suggest that FE-based metrics may serve as an improved biomechanics-based independent variable for describing these changes.
Acknowledgments
Research reported in this publication was supported by the Childress Institute for Pediatric Trauma and the National Institute of Neurological Disorders and Stroke of the National Institutes of Health under award nos. R01NS094410 and R01NS082453.
ABBREVIATIONS
- ABM
atlas-based brain model
- AUC
area under the ROC curve
- CL
linear coefficient
- CP
planar coefficient
- CS
spherical coefficient
- DTI
diffusion tensor imaging
- FA
fractional anisotropy
- FE
finite element
- HITS
Head Impact Telemetry System
- MD
mean diffusivity
- mTBI
mild traumatic brain injury
- ROC
receiver operating characteristic
- ROI
region of interest
- RWE
risk-weighted cumulative exposure
- RWECP
RWE combined probability
- RWEL
RWE linear
- RWER
RWE rotational acceleration
- VSM
volumetric strain measure
- VSRM
volumetric strain rate measure
- VSSM
volumetric shear strain measure
- VSSRM
volumetric shear strain rate measure
- WM
white matter
- 6DOF
6 degrees of freedom
Footnotes
Disclosures
The authors report no conflict of interest concerning the materials or methods used in this study or the findings specified in this paper.
References
- 1.Peterson AR, Kruse AJ, Meester SM, Olson TS, Riedle BN, Slayman TG, et al. Youth football injuries: a prospective cohort. Orthop J Sports Med. 2017;5(2):2325967116686784. [DOI] [PMC free article] [PubMed] [Google Scholar]
- 2.Montenigro PH, Alosco ML, Martin BM, Daneshvar DH, Mez J, Chaisson CE, et al. Cumulative head impact exposure predicts later-life depression, apathy, executive dysfunction, and cognitive impairment in former high school and college football players. J Neurotrauma. 2017;34(2):328–340. [DOI] [PMC free article] [PubMed] [Google Scholar]
- 3.Stamm JM, Bourlas AP, Baugh CM, Fritts NG, Daneshvar DH, Martin BM, et al. Age of first exposure to football and later-life cognitive impairment in former NFL players. Neurology. 2015;84(11): 1114–1120. [DOI] [PMC free article] [PubMed] [Google Scholar]
- 4.Stamm JM, Koerte IK, Muehlmann M, Pasternak O, Bourlas AP, Baugh CM, et al. Age at first exposure to football is associated with altered corpus callosum white matter microstructure in former professional football players. J Neurotrauma. 2015;32(22):1768–1776. [DOI] [PMC free article] [PubMed] [Google Scholar]
- 5.Broglio SP, Sosnoff JJ, Shin S, He X, Alcaraz C, Zimmerman J Head impacts during high school football: a biomechanical assessment. J Athl Train. 2009;44(4):342–349. [DOI] [PMC free article] [PubMed] [Google Scholar]
- 6.Duma SM, Manoogian SJ, Bussone WR, Brolinson PG, Goforth MW, Donnenwerth JJ, et al. Analysis of real-time head accelerations in collegiate football players. Clin J Sport Med. 2005;15(1):3–8. [DOI] [PubMed] [Google Scholar]
- 7.Urban JE, Davenport EM, Golman AJ, Maldjian JA, Whitlow CT, Powers AK, Stitzel JD. Head impact exposure in youth football: high school ages 14 to 18 years and cumulative impact analysis. Ann Biomed Eng. 2013;41(12):2474–2487. [DOI] [PMC free article] [PubMed] [Google Scholar]
- 8.Kelley ME, Kane JM, Espeland MA, Miller LE, Powers AK, Stitzel JD, Urban JE. Head impact exposure measured in a single youth football team during practice drills. J Neurosurg Pediatr. 2017;20(5):489–497. [DOI] [PMC free article] [PubMed] [Google Scholar]
- 9.Rowson S, Duma SM, Beckwith JG, Chu JJ, Greenwald RM, Crisco JJ, et al. Rotational head kinematics in football impacts: an injury risk function for concussion. Ann Biomed Eng. 2012;40(1):1–13. [DOI] [PMC free article] [PubMed] [Google Scholar]
- 10.Takhounts EG, Craig MJ, Moorhouse K, McFadden J, Hasija V. Development of brain injury criteria (BrIC). Stapp Car Crash J. 2013;57:243–266. [DOI] [PubMed] [Google Scholar]
- 11.AI King, Yang KH, Zhang L, Hardy WN, Viano DC. Is head injury caused by linear or angular acceleration? Presented at: IRCOBI Conference, September 25-26, 2003; Lisbon, Portugal. Accessed December 23, 2021. http://www.ircobi.org/wordpress/downloads/irc0111/2003/BertilAldmanLecture/0.1.pdf [Google Scholar]
- 12.Kleiven S. Predictors for traumatic brain injuries evaluated through accident reconstructions. Stapp Car Crash J. 2007;51:81–114. [DOI] [PubMed] [Google Scholar]
- 13.McAllister TW, Ford JC, Ji S, Beckwith JG, Flashman LA, Paulsen K, Greenwald RM. Maximum principal strain and strain rate associated with concussion diagnosis correlates with changes in corpus callosum white matter indices. Ann Biomed Eng. 2012;40(1):127–140. [DOI] [PMC free article] [PubMed] [Google Scholar]
- 14.Zhao W, Bartsch A, Benzel E, Miele V, Stemper BD, Ji S. Regional brain injury vulnerability in football from two finite element models of the human head. Presented at: IRCOBI Conference, September 11-13, 2019; Florence, Italy. Accessed December 23, 2021. http://www.ircobi.org/wordpress/downloads/irc19/pdf-files/89.pdf [Google Scholar]
- 15.Giudice JS, Alshareef A, Wu T, Gancayco CA, Reynier KA, Tustison NJ, et al. An image registration-based morphing technique for generating subject-specific brain finite element models. Ann Biomed Eng. 2020;48(10):2412–2424. [DOI] [PubMed] [Google Scholar]
- 16.Wu T, Alshareef A, Giudice JS, Panzer MB. Explicit modeling of white matter axonal fiber tracts in a finite element brain model. Ann Biomed Eng. 2019;47(9):1908–1922. [DOI] [PubMed] [Google Scholar]
- 17.Zhao W, Ji S. White matter anisotropy for impact simulation and response sampling in traumatic brain injury. J Neurotrauma. 2019;36(2):250–263. [DOI] [PMC free article] [PubMed] [Google Scholar]
- 18.Hoogenboom WS, Rubin TG, Ye K, Cui MH, Branch KC, Liu J, et al. Diffusion tensor imaging of the evolving response to mild traumatic brain injury in rats. J Exp Neurosci. 2019;13:1179069519858627. [DOI] [PMC free article] [PubMed] [Google Scholar]
- 19.Herrera JJ, Bockhorst K, Kondraganti S, Stertz L, Quevedo J, Narayana PA. Acute white matter tract damage after frontal mild traumatic brain injury. J Neurotrauma. 2017;34(2):291–299. [DOI] [PMC free article] [PubMed] [Google Scholar]
- 20.Mannix R, Meehan WP, Mandeville J, Grant PE, Gray T, Berglass J, et al. Clinical correlates in an experimental model of repetitive mild brain injury. Ann Neurol. 2013;74(1):65–75. [DOI] [PMC free article] [PubMed] [Google Scholar]
- 21.Mukherjee P, Chung SW, Berman JI, Hess CP, Henry RG. Diffusion tensor MR imaging and fiber tractography: technical considerations. AJNR Am J Neuroradiol. 2008;29(5):843–852. [DOI] [PMC free article] [PubMed] [Google Scholar]
- 22.Farrell JAD, Landman BA, Jones CK, Smith SA, Prince JL, van Zijl PC, Mori S. Effects of signal-to-noise ratio on the accuracy and reproducibility of diffusion tensor imaging-derived fractional anisotropy, mean diffusivity, and principal eigenvector measurements at 1.5 T. J Magn Reson Imaging. 2007;26(3):756–767. [DOI] [PMC free article] [PubMed] [Google Scholar]
- 23.Mills KL, Tamnes CK. Methods and considerations for longitudinal structural brain imaging analysis across development. Dev Cogn Neurosci. 2014;9:172–190. [DOI] [PMC free article] [PubMed] [Google Scholar]
- 24.Bazarian JJ, Zhu T, Blyth B, Borrino A, Zhong J. Subject-specific changes in brain white matter on diffusion tensor imaging after sports-related concussion. Magn Reson Imaging. 2012;30(2):171–180. [DOI] [PMC free article] [PubMed] [Google Scholar]
- 25.Henry LC, Tremblay J, Tremblay S, Lee A, Brun C, Lepore N, et al. Acute and chronic changes in diffusivity measures after sports concussion. J Neurotrauma. 2011;28(10):2049–2059. [DOI] [PubMed] [Google Scholar]
- 26.Wilde EA, McCauley SR, Hunter JV, Bigler ED, Chu Z, Wang ZJ, et al. Diffusion tensor imaging of acute mild traumatic brain injury in adolescents. Neurology. 2008;70(12):948–955. [DOI] [PubMed] [Google Scholar]
- 27.Davenport EM, Whitlow CT, Urban JE, Espeland MA, Jung Y, Rosenbaum DA, et al. Abnormal white matter integrity related to head impact exposure in a season of high school varsity football. J Neurotrauma. 2014;31(19):1617–1624. [DOI] [PMC free article] [PubMed] [Google Scholar]
- 28.Bazarian JJ, Zhu T, Zhong J, Janigro D, Rozen E, Roberts A, et al. Persistent, long-term cerebral white matter changes after sports-related repetitive head impacts. PLoS One. 2014;9(4):e94734. [DOI] [PMC free article] [PubMed] [Google Scholar]
- 29.Saghafi B, Murugesan G, Davenport E, Wagner B, Urban J, Kelley M, et al. Quantifying the association between white matter integrity changes and subconcussive head impact exposure from a single season of youth and high school football using 3D convolutional neural networks. Proc SPIE Int Soc Opt Eng. 2018;10575:105750E. [DOI] [PMC free article] [PubMed] [Google Scholar]
- 30.Jang I, Chun IY, Brosch JR, Bari S, Zou Y, Cummiskey BR, et al. Every hit matters: white matter diffusivity changes in high school football athletes are correlated with repetitive head acceleration event exposure. Neuroimage Clin. 2019;24:101930. [DOI] [PMC free article] [PubMed] [Google Scholar]
- 31.Davenport EM, Apkarian K, Whitlow CT, Urban JE, Jensen JH, Szuch E, et al. Abnormalities in diffusional kurtosis metrics related to head impact exposure in a season of high school varsity football. J Neurotrauma. 2016;33(23):2133–2146. [DOI] [PMC free article] [PubMed] [Google Scholar]
- 32.Miller LE, Urban JE, Davenport EM, Powers AK, Whitlow CT, Maldjian JA, Stitzel JD. Brain strain: computational model-based metrics for head impact exposure and injury correlation. Ann Biomed Eng. 2021;49(3):1083–1096. [DOI] [PMC free article] [PubMed] [Google Scholar]
- 33.Rowson S, Duma SM. Development of the STAR evaluation system for football helmets: integrating player head impact exposure and risk of concussion. Ann Biomed Eng. 2011;39(8):2130–2140. [DOI] [PubMed] [Google Scholar]
- 34.Rowson S, Duma SM. Brain injury prediction: assessing the combined probability of concussion using linear and rotational head acceleration. Ann Biomed Eng. 2013;41(5):873–882. [DOI] [PMC free article] [PubMed] [Google Scholar]
- 35.Bandak FA, Eppinger RH. A three-dimensional finite element analysis of the human brain under combined rotational and translational accelerations. Stapp Car Crash J. 1994;38:145–164. [Google Scholar]
- 36.Miller LE, Urban JE, Stitzel JD. Estimation of 6 degrees-of-freedom accelerations from head impact telemetry system outputs for computational modeling. In: Tavares JMRS, Fernandes PR, eds. New Developments on Computational Methods and Imaging in Biomechanics and Biomedical Engineering. Lecture Notes in Computational Vision and Biomechanics. Springer Nature; 2019:121–130. [Google Scholar]
- 37.Miller LE, Urban JE, Kelley ME, Powers AK, Whitlow CT, Maldjian JA, et al. Evaluation of brain response during head impact in youth athletes using an anatomically accurate finite element model. J Neurotrauma. 2019;36(10):1561–1570. [DOI] [PMC free article] [PubMed] [Google Scholar]
- 38.Cohen J. A power primer. Psychol Bull. 1992;112(1):155–159. [DOI] [PubMed] [Google Scholar]
- 39.Cohen J. Statistical Power Analysis for the Behavioral Sciences. Academic Press; 2013. [Google Scholar]