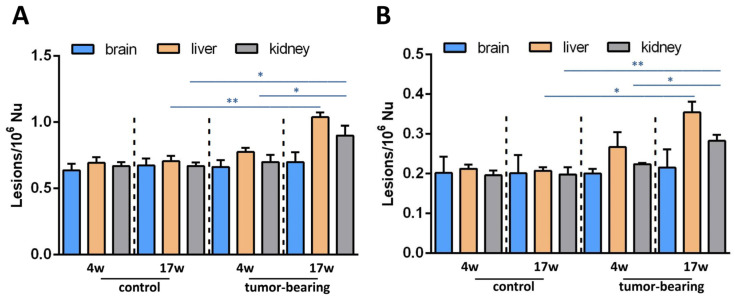
Figure 7.
(A) cPu levels and (B) 8-oxo-dA levels in the brain tissue of control SCID and tumor-bearing SCID mice compared with previous tissue-specific patterns from the liver and the kidney [37] by isotope dilution liquid chromatography-tandem mass spectrometry * (p < 0.05), ** (p < 0.01).

