

Abstract
This paper presents a systematic review of human studies investigating the effect of altering dietary omega-3 polyunsaturated fatty acid (n-3 PUFA) alpha-linolenic acid (ALA) and omega-6 polyunsaturated fatty acid (n-6 PUFA) linoleic acid (LA) intakes on n-3 long-chain polyunsaturated fatty acid (LCPUFA) status in adult humans. The results suggest that it is possible to increase n-3 LCPUFA status by reducing LA and/or increasing ALA intake in humans, although decreasing LA intake to below 2.5%E may be required to specifically increase levels of the n-3 LCPUFA docosahexaenoic acid (DHA). The majority of studies in this area to date have been relatively poor in quality, which limits the ability to draw robust conclusions, and we present a series of recommendations to improve the quality of future studies in fatty acid nutrition in humans.
Keywords: ALA, LA, Diet, Human, DHA, EPA
1. Introduction
The n-3 long chain polyunsaturated fatty acids (LCPUFA) eicosapentaenoic acid (EPA, 20:5 n-3) and docosahexaenoic acid (DHA, 22:6 n-3) have a number of reported health benefits in humans, in particular in relation to cardiovascular [1] and inflammatory [2,3] conditions. This has led to recommendations from health agencies world-wide to increase dietary intake of these fatty acids [4]. EPA and DHA are mainly derived pre-formed through consumption of either fish or fish-oil supplements. However, they can also be synthesized de novo through conversion of the plant-derived short-chain n-3 PUFA precursor, alpha-linolenic acid (ALA, 18:3 n-3). It has been suggested that increasing dietary intake of ALA could provide an alternative to fish or fish-oil intake for increasing n-3 LCPUFA status in humans, although the efficiency of this process in adult humans is generally low [5].
The levels of n-6 PUFA also have the potential to impact on n-3 LCPUFA status. This is due to the competition between n-6 and n-3 PUFA for both enzymatic conversion of the short-chain precursors, linoleic acid (LA, 18:2 n-6) and ALA, to their respective long-chain derivatives, and for incorporation into cell membranes [6]. LA competes with ALA for the desaturase and elongase enzymes required for its conversion to EPA and DHA, and as a result, high levels of LA in the background diet have the potential to reduce the efficiency of endogenous synthesis of n-3 LCPUFA from ALA [6]. In addition, since the incorporation of n-3 LCPUFA into the cellular membrane is required for them to mediate certain biological effects, increased competition from n-6 PUFA can affect the relationship between n-3 PUFA intake and tissue n-3 PUFA status [7,8]. It has therefore been suggested that excessive intakes of dietary n-6 PUFA may limit the ability of ALA and n-3 LCPUFA consumed in the diet to increase n-3 LCPUFA status, and that reducing n-6 PUFA intake could potentially improve n-3 LCPUFA status without a need to increase n-3 LCPUFA intake [8]. This has particular significance given the substantial increases in n-6 PUFA intakes in Western countries world-wide over the past century [9,10].
Animal studies have highlighted that levels of n-3 LCPUFA in tissues can be regulated by simply altering the balance of LA and ALA in the diet and that a dose-response relationship exists between dietary ALA intake and the n-3 LCPUFA content of blood and tissues [11–13]. There is also evidence that reducing the LA content of infant formulas increases the efficiency of cellular DHA incorporation in human infants [14]. However, there have been comparatively few studies evaluating the effects of increasing dietary ALA and/or decreasing n-6 PUFA intake on n-3 LCPUFA status in adult humans, and these results have yet to be systematically evaluated.
This paper presents a review of human studies investigating the effect of altering dietary ALA and LA intakes on n-3 LCPUFA status. In assessing these studies, we have identified a number of common methodological issues, and therefore include a series of recommendations to improve the quality of future studies in fatty acid nutrition in humans.
2. Methods
2.1. Search strategy
MEDLINE (〈www.ncbi.nlm.nih.gov/pubmed〉) and EMBASE (〈www.embase.com〉) databases were searched for relevant articles using the search terms “alpha linolenic acid” or “a-linolenic acid” or “ALA” or “linoleic acid” or “omega 6 fatty acid” or “n-6 fatty acid” and “diet”. The search was restricted to human studies. No language or date restrictions were imposed. The reference lists of eligible articles identified by the search were also checked to reveal other potentially relevant articles. The last literature search was conducted in August 2014 and the search engines were set up to email new publications identified by the search on a weekly basis.
2.2. Selection of articles
Studies were eligible for inclusion if they were dietary interventions involving adult, non-pregnant participants that specifically aimed to alter dietary intake of LA and/or ALA. The studies had to report LA and ALA intakes as a % of energy (%E) and include measures of EPA and DHA content in plasma or erythrocyte phospholipids before and after the dietary intervention. Two review authors (KW and EM) assessed the titles, abstracts, and where necessary, the full text of the article for study eligibility, a third author (BM) was consulted to resolve any discrepancies.
2.3. Studies identified by search strategy
The initial search identified 674 references after exclusion of duplicates. Additional publications were identified from references listed in original papers. This secondary search added 16 potentially relevant papers bringing the total to 690. The title and abstract of each reference was initially reviewed. Based on this information; 640 references were assessed as not fulfilling the inclusion criteria and were hence excluded at this stage. The fulltext of the remaining 50 articles were reviewed in relation to the inclusion criteria. The process of article selection and reasons for exclusion are shown in Fig. 1.
Fig. 1.
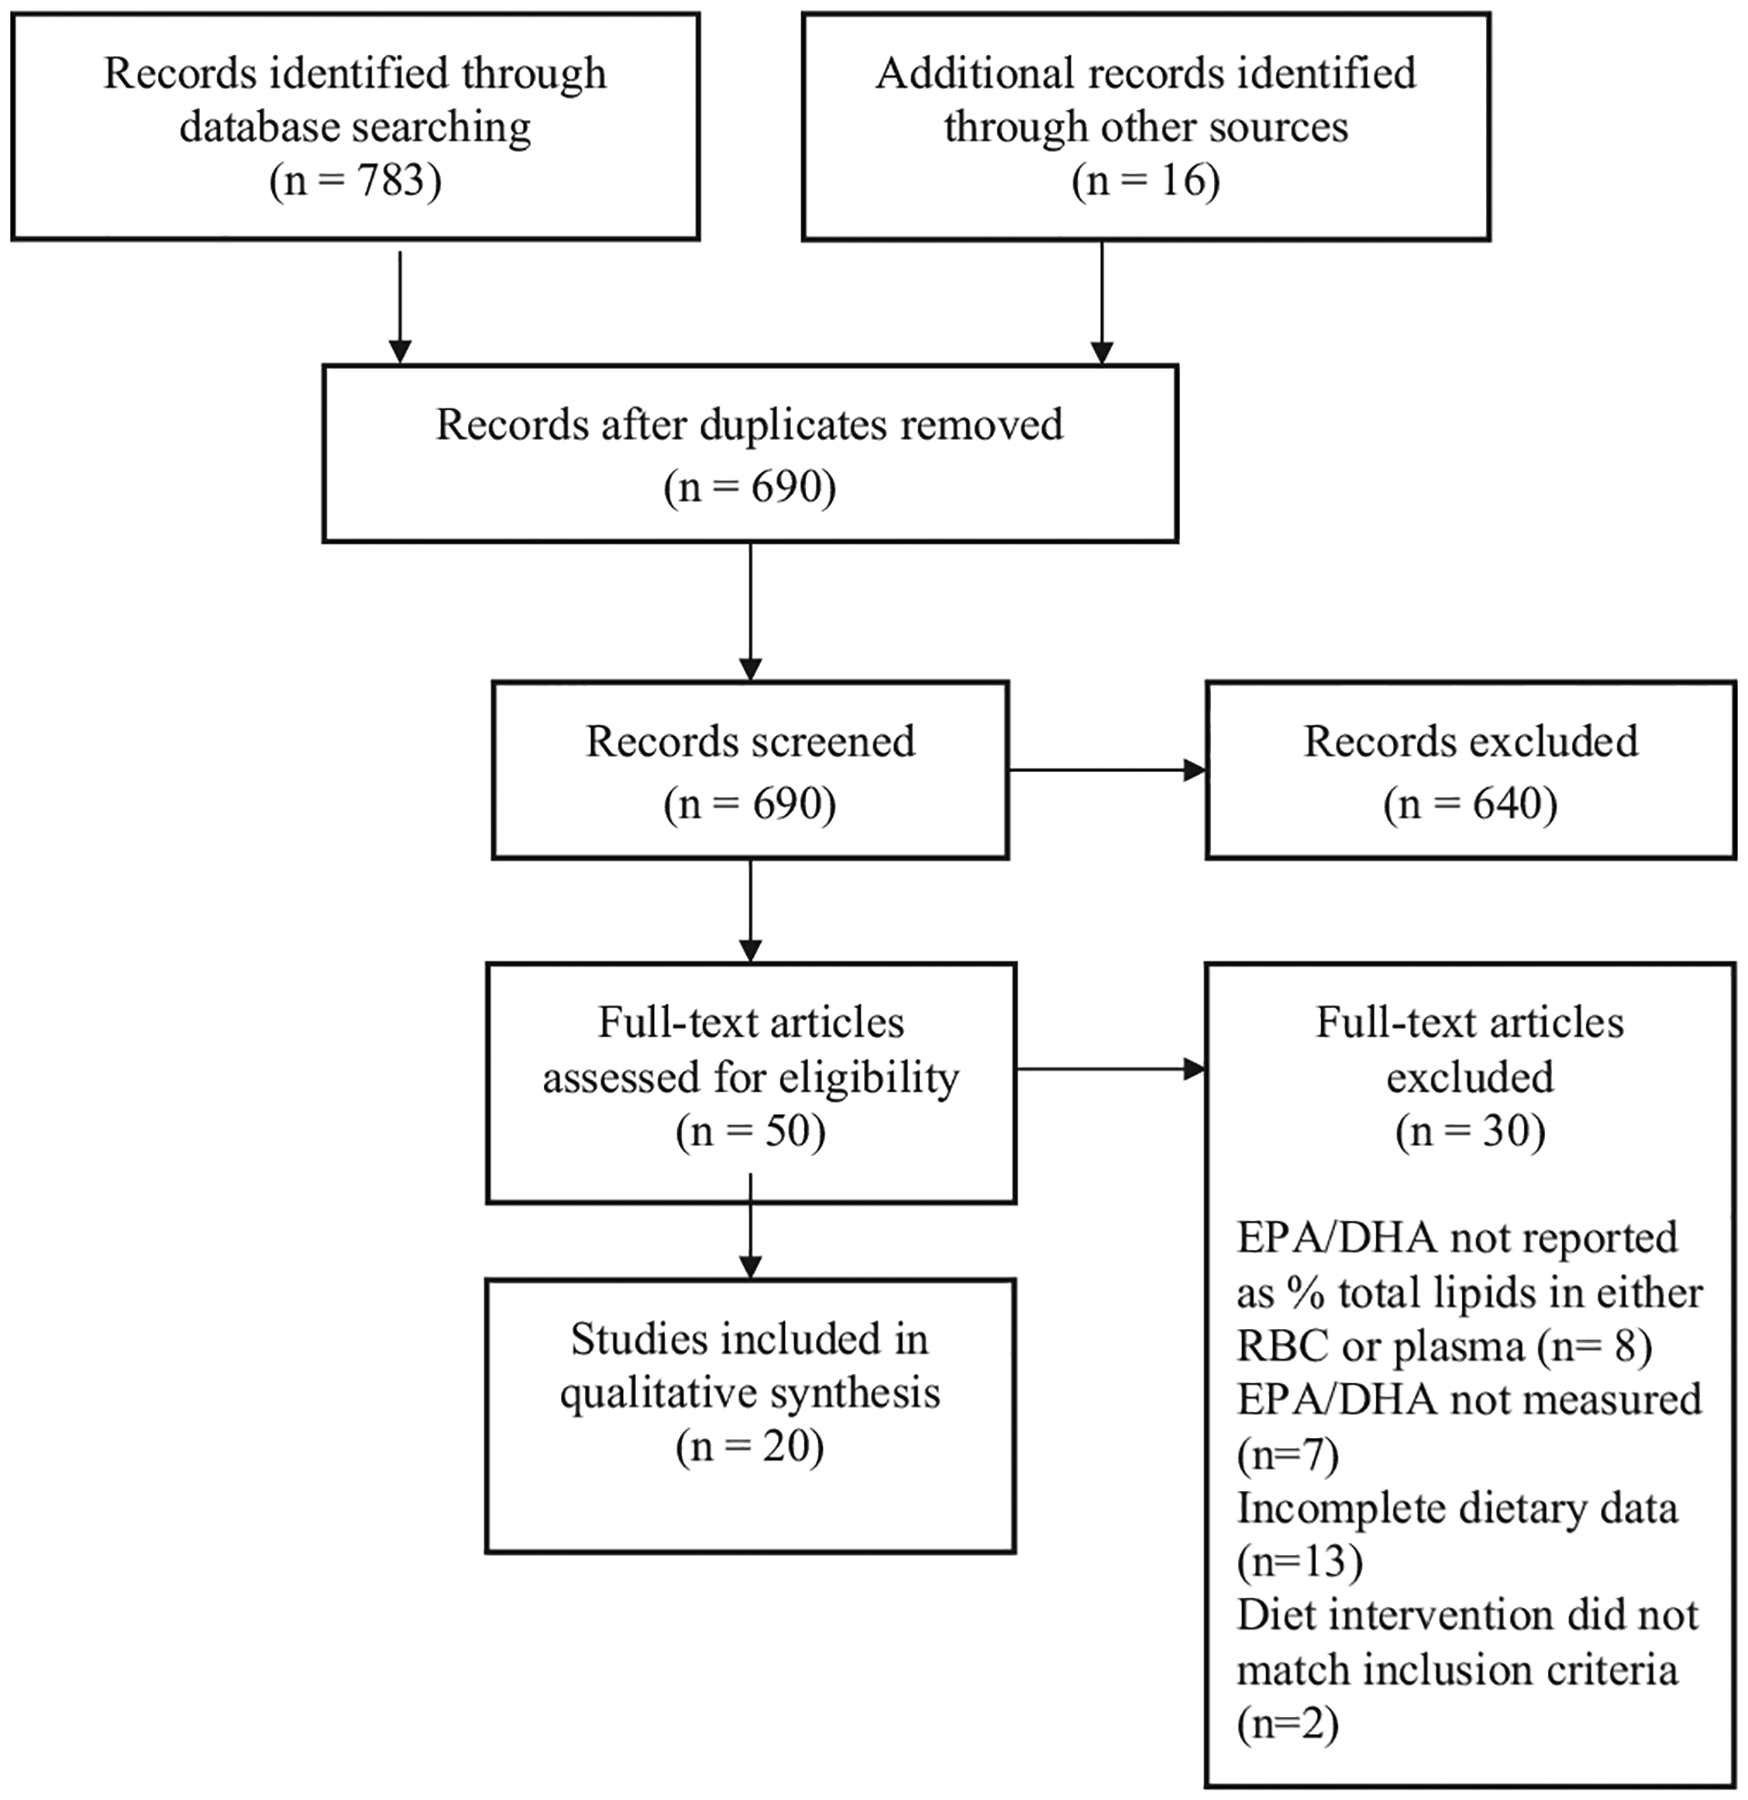
PRISMA diagram depicting the process of article selection and reasons for exclusion.
Data from each included study were independently extracted by 1 review author (KW) and then verified by another (EM). Where all details could not be clearly identified from the article, the authors were contacted for clarification. Three authors did not respond to this request and these studies were therefore excluded from the systematic review [15–17].
3. Results
3.1. Description of included studies
Data from 20 publications reporting data from 18 separate trials were included in this review, dating from 1994 to 2014. All studies were randomized controlled trials apart from one open label clinical trial where participants acted as their own control [18]. The included studies are summarized in Table 1 with extracted information on country, gender and number of participants, description of intervention including the levels of LA and ALA as a percentage of energy, LA:ALA ratio, % total fatty acid results (ALA, EPA and DHA) for baseline (if reported) and post-intervention in plasma phospholipids or erythrocytes.
Table 1.
Included studies on altering dietary intake of omega-6 (n-6) polyunsaturated fatty acid (PUFA) on EPA and DHA levels in plasma phospholipids and red blood cells (RBC).
| Author year country | Participants and duration | Intervention | ALA%E | LA%E | LA:ALA ratio | Outcome measurement | ALA (% fatty acid) | EPA (% fatty acid) | DHA (% fatty acid) |
|---|---|---|---|---|---|---|---|---|---|
| Colombo et al. [21] | F 50–65 yrs (> 0.38 ng/ml testosterone) | Control : standard diet (n = 48) | 0.5 | 3.9 | 8:1 | Plasma PL | 0.17→0.2 | 0.95→1.02 | 3.53→3.75 |
| Italy | Duration: 4.5 months | Intervention: (n = 52) specially prepared meals (1 soy product/day and 1 loaf of bread with 8% flaxseed/week) | 1.4 | 5.5 | 4:1 | 0.18→0.24 | 0.85→0.94 | 3.44→4.29 | |
| Egert et al. [35] | M + F 19–43 yrs | High ALA 30 g portion of fortified margarine/day (n = 24) | 1.74 | 4.3 | 2.5:1 | RBC (sd) | 0.23 ± 0.07→0.47 ± 0.1*** | 0.94 ± 0.36→1.06 ± 0.29 | 6.96 ± 2.42→6.04 ± 1.81 |
| Germany | Duration: 6 weeks | Fish excluded | |||||||
| Finnegan et al. [24] | M + F 25–72 yrs | 3 Groups: Control: standard diet (n = 30), Moderate ALA (n = 30) | 0.45 | 7 | 15.5:1 | Plasma PL (sem) | 0.34 ± 0.02→0.29 ± 0.03 | 0.99 ± 0.14→1.27 ± 0.23 | 4.48 ± 0.24→4.40 ± 0.24 |
| United Kingdom | Duration: 6 months | High ALA (n = 30) | 1.7 | 6 | 3.3:1 | 0.31 ± 0.02→0.46 ± 0.03* | 1.05 ± 0.13→2.00 ± 0.23* | 4.29 ± 0.21→4.16 ± 0.24 | |
| Fortified margarine, Vegetarians excluded | 3.4 | 4.6 | 1.3:1 | 0.3 ± 0.02→0.76 ± 0.08* | 0.92 ± 0.12→2.14 ± 0.3* | 3.46 ± 0.18→3.67 ± 0.26 | |||
| Goyens et al. [22] | M + F 18–65 yrs | 3 Groups Control (n = 18) | 0.4 | 7.3 | 19:1 | Plasma PL (sd) | 0.2 ± 0.1→0.2 | 0.6 ± 0.2→0.6 | 2.8 ± 0.5→2.6 |
| Netherlands | Duration: 4 weeks run-in, 6 weeks intervention | Low LA (n = 18) | 0.4 | 3 | 7:1 | 0.1 ± 0.0→0.2 | 0.5 ± 0.2→0.7* | 2.7 ± 0.5→2.6 | |
| High ALA (n = 18) Margarine and baked goods in special diet fish/seafood excluded |
1.1 | 7 | 7:1 | 0.2 ± 0.0→0.3 | 0.6 ± 0.2→0.8* | 2.9 ± 0.6→2.8 | |||
| Goyens et al. [32] | M+F (M mean 53.8 yrs; F mean 46.2 yrs) | Control group (n = 9) | 0.4 | 7 | 19:1 | Plasma PL (sd) | 0.15 ± 0.04→0.16* | 0.58 ± 0.15→0.6* | 2.9 ± 0.4→2.65 |
| Netherlands | Low LA group (n = 10) | 0.4 | 3 | 7:1 | 0.15 ± 0.05→0.25* | 0.55 ± 0.21→0.84* | 2.6 ± 0.3→2.47 | ||
| High ALA group (n = 10) See Ref. [22] details | 1.1 | 7 | 7:1 | 0.18 ± 0.05→0.29* | 0.66 ± 0.21→0.86* | 3.1 ± 0.73→2.95 | |||
| Hussein et al. [34] | M 35–60 yrs | Flaxseed diet (n = 21) | 6.3 | 3.1 | 1:2 | RBC (sd) | 0.36 ± 0.3→1.33 ± 0.8* | 1.47→3.85* | Data not shown - no change reported |
| United Kingdom | Duration: 12 weeks | Flaxseed oil and spreads supplied Fish and seafood excluded |
|||||||
| Hagfors et al. [27] | M + F 33–75 yrs | Control group (n = 25) | 0.54 | 3 | 5.5:1 | Serum PL (median IQR) | 0.3→0.3 (0.2–0.4)–(0.0–0.5) |
1.1→1.1 (1.0–1.5)–(0.9–1.4) |
3.0→3.0 (1.5–4.3)–(2.2–4.5) |
| Sweden | RA patients Duration: 12 weeks | Cretan Mediterranean diet (n = 26) | 0.80 | 3.1 | 4:1 | 0.3→0.4 (0.0–0.4)–(0.0–0.4) |
1.4→2.1*** (1.1–1.8)–(1.4–3.3) |
3.9→5.0*** (2.2–4.8)–(2.5–7.2) |
|
| James et al. [30] | M + F 18–65 yrs | High ALA (n = 15) supplied with margarine and low n-6 oil | 0.60 | 2.9 | 5:1 | RBC (sd) | Not reported | 0.88 ± 0.17→1.01 ± 0.18 | 4.61 ± 0.71→4.28 ± 0.56 |
| Australia | Duration: 6 weeks | 0–3 wk - 0.75 g/day 3–6 wk - 1.5 g/day | |||||||
| Kelley et al. [19] | M 21–37 yrs | Sunflower oil group (n = 9) | 0.3 | 6 | 20:1 | Serum PL (sem) | 0.2 ± 0→0.5 ± 0.1* | 0.6 ± 0.1→0.5 ± 0 | 0.8 ± 0.1→1.1 ± 0.1 |
| USA | Duration: 2 × 56 days crossover interventions | Linseed oil group (n = 9) | 6.3 | 4.3 | 1:1.5 | 0.2 ± 0→3.2 ± 0.4* | 0.6 ± 0→0.6 ± 0 | 0.8–1.1 ± 0.1 | |
| Pre-basal diet 14 days | Controlled feeding | ||||||||
| No washout | |||||||||
| Kontogianni et al. [28] | M+F 26–44 yrs | Flaxseed group (n = 30) | 4 | 4.1 | 1:1 | RBC (sd) | 0.08 ± 0.02→0.30 ± 0.09*** | 0.53 ± 0.25→0.78 ± 0.38*** | 5.44 ± 1.03→5.47 ± 1.2 |
| Greece | Duration: 6 week crossover design (washout 6 weeks) | Olive oil group (n = 30) | 0.4 | 3.9 | 10:1 | 0.10 ± 0.04→0.08 ± 0.02** | 0.57 ± 0.3→0.58 ± 0.28 | 5.05 ± 1.2→5.4 ± 1.26 | |
| 15 ml/day Either flaxseed or olive oil consumed with normal diet | |||||||||
| Li et al. [33] | M 20–50 yrs; mean 34 yrs | Moderate ALA group (Canola oil/margarine, n = 10) | 2 | 7 | 3.5:1 | Plasma PL(sd) | 0.2 ± 0.1→0.4 ± 0.2* | 0.5 ± 0.3→0.9 ± 0.4* | 1.9 ± 0.5→2.1 ± 0.6 |
| Australia | Duration: 2 week run-in (low ALA), 4 week intervention | High ALA group (linseed oil/margarine, n = 7) | 6.3 | 7.3 | 1.15:1 | 0.2 ± 0.1→1.4 ± 1.5* | 0.3 ± 0.1→1.4 ± 0.7* | 2.0 ± 0.7→1.9 ± 0.5 | |
| Vegetarians only | |||||||||
| Macintosh et al. [26] | M+F 18–62 yrs | 2 Arms: Control diet low n-6, average n-3 (L6) group (n = 27) | 0.7 | 7.4 | RBC (median IQR) | 0.21→0.25 (0.19–0.26)-(0.18–0.31) |
0.39→0.59*** (0.29–0.50)–(0.40–0.79) |
3.30→3.92*** (2.66–3.98)–(3.04–4.97) |
|
| 0.7 | 2.4 | 3.4:1 | |||||||
| USA | Duration: 12 weeks | Control diet low n-6, high n-3 (H3-L6, n = 25) | 0.6 | 6.4 | H3-L6 | 0.20→0.32*** (0.17–0.23)–(0.23–0.38) |
0.38→1.42*** (0.32–0.54)–(1.00–2.02) |
3.78→6.79*** (3.21–4.26)–(5.72–8.05) |
|
| Taha et al. [29] USA | Ground flaxseed, low LA oils and fat supplied and dietary advice provided | 1.6 | 2.5 | 1.5:1 | Plasma PL (median IQR) | 0.20→0.25 (0.18–0.26)-(0.18–0.36) |
0.53→0.74*** (0.36–0.68)–(0.54–0.99) |
2.03→2.24 (1.58–2.61)-(1.85–2.86) |
|
| H3-L6 | 0.22→0.29 (0.16–0.30)-(0.21–0.37) |
0.46→1.86*** (0.38–0.61)–(0.94–2.33) |
2.00→4.04*** (1.68–2.97)–(3.26–5.32) |
||||||
| Mantzioris et al. [23] Australia | M 25–44 yrs | Control group (n = 15) | 0.4 | 7.8 | 19.5:1 | RBC (sd) | 0.1 ± 0.1→0.1 ± 0.6 | 0.7 ± 0.2→0.6 ± 0.2 | 3.3 ± 0.6→3.7 ± 0.6 |
| Duration : 4 weeks | High ALA/low LA group (n = 15) | 5.3 | 3.3 | 1:1.6 | Control Intervention | 0.1 ± 0.1→1.1 ± 0.8* | 0.8 ± 0.3→1.9 ± 0.7* | 2.9 ± 0.6→3.3 ± 0.9 | |
| Flaxseed oil and spreads provided | Plasma PL Control | 0.1 ± 0.1→0.1 ± 0.1 | 0.6 ± 0.1→0.5 ± 0.1 | 3.9 ± 0.6→4.3 ± 0.6 | |||||
| Intervention | 0.1 ± 0.1→0.6 ± 0.4* | 0.6 ± 0.2→1.2 ± 0.3* | 3.6 ± 0.8→3.8 ± 0.8 | ||||||
| Raatz et al. [20] USA | M+F 22–65 yrs | High fat diet (n = 10) | 0.8 | 12 | 15:1 | Plasma PL(sem) | 0.21 ± 0.01 | 0.51 ± 0.04** | 3.54 ± 0.46** |
| Duration: 12 week randomised crossover | Low fat diet (n = 10) | 0.4 | 6 | 15:1 | 0.18 ± 0.01 | 0.71 ± 0.07 | 4.53 ± 0.31 | ||
| Specially designed diets for both groups | **<0.01 Difference b/w diet periods compared | ||||||||
| Renaud et al. [16] | M+F Coronary heart disease patients | Control group (n = 247) | Not reported | Not reported | Not reported | Plasma PL (sem) |
0.39 ± 0.1 | 0.75 ± 0.04 | 2.02 ± 0.04 |
| France | (53 yrs Mean) | Mediterranean diet (n = 236) | 0.72 | 3.5 | 5:1 | Baseline not reported. End results shown | 0.65 ± 0.02* | 0.92 + 0.03* | 2.18 + 0.05* |
| Duration: 2 months | Mediterranean group supplied canola based margarine. Both groups received specific dietary instructions |
Sig. cf. control | |||||||
| Valsta et al. [36] | M+F 20–46 yrs | Rapeseed oil diet (n = 28) | 2.2 | 6.1 | 2.7:1 | Plasma PL (sd) | ALA not reported in Plasma PL | 1.5 ± 0.7→1.3 ± 0.4*** | 5.3 ± 1.1→4.5 ± 0.6* |
| Finland | Duration: 2 × 6 weeks crossover - 6 week washout between | Oleic acid diet (n = 28) | 0.3 | 7.8 | 26:1 | Results reported for 28 who excluded fish from diet | 1.4 ± 0.4→0.6 ± 0.3*** | 5.2 ± 0.9→4.1 ± 0.7*** | |
| Experimental foods and oils/spreads with rapeseed or high oleic sunflower oil provided Fish excluded | |||||||||
| Wensing et al. [31] | M+F 60–78 yrs (Elderly) | Oleic acid group (Elderly, n = 11) | 0.01 | 4.1 | RBC (sem) | 0.1 ± 0.0→0.1 | 0.6 ± 0.1→0.6 | 3.2 ± 0.3→3.3 | |
| Netherlands | M+F < 35 yrs (Young) | High ALA group (elderly, n = 13; young, n = 12) | 3.23 | 4.7 | 1.45:1 | Elderly | 0.0 ± 0.0→0.4*** | 0.6 ± 0.1→1.0 | 3.5 ± 0.2→3.2 |
| Duration: 3 weeks run-in, 6 weeks intervention | Provided with food items to add to their normal diet | Young | 0.1 ± 0.0→0.3 | 0.5 ± 0.2→0.7 | 0.5 ± 0.2→0.7 | ||||
| Fish/seafood excluded | |||||||||
| Wallace et al. [25] United Kingdom | M 18–39 yrs | Control (n = 8) | 0.52 | 4.65 | 9:1 | Plasma PL(sem) | Not reported | 1.1 ± 0.2→0.8 ± 0.3 | 3.8 ± 0.3→4.1 ± 0.3 |
| Duration: 12 weeks | High ALA group (flaxseed oil, n = 8) | 1.6 | 4.96 | 3:1 | 1.0 ± 0.5→1.6 ± 0.3* | 3.9 ± 0.5→4.0 ± 0.4 | |||
| Capsules provided (flaxseed for high ALA group, placebo for control group) Vegetarians excluded | |||||||||
| Wood et al. [18] | M+F 19–62yrs | Baseline diet | 0.53 | 4.6 | 8.6:1 | RBC (median IQR) | 0.14→0.12 (0.13–0.15)–(0.11–0.15) |
0.76→0.82 (0.67–0.95)–(0.67–0.99) |
4.67→4.64 (4.07–5.50)–(4.12–5.22) |
| Australia | Duration: 2 weeks run-in, 4 weeks intervention | Low n-6 diet | 0.3 | 2 | 6:1 | Plasma PL (median IQR) | 0.17→0.19 (0.14–0.23)-(0.15–0.22) |
0.87→1.09* (0.80–1.18)–(0.83–1.34) |
3.47→3.77* (3.01–3.90)–(3.33–426) |
| Macadamia oil and butter provided. Status compared in same individual after diet compared to baseline (n = 32) |
P < 0.05
P.< 0.01
P < 0.001
The dietary interventions in these studies were categorized based on the approach applied to improve n-3 LCPUFA status, i.e. increasing intake of the short-chain n-3 PUFA, ALA, to provide more substrate for conversion to n-3 LCPUFA, reducing intake of the short-chain n-6 PUFA, LA, to reduce competition for ALA conversion/n-3 LCPUFA cellular incorporation or a combination of both. Alternative dietary approaches were placed in a fourth sub-category.
The characteristics of the sub-categories were:
increasing dietary intake ALA to between 1.1 and 6.3%E while maintaining dietary LA intake in the normal range (4.3–7.3%E) (n = 9);
decreasing dietary intake of LA to between 2.4 and 3.9%E while maintaining dietary ALA intake in the normal range (0.4–0.7% E) (n = 7);
increasing ALA intake to between 1.6 and 6.3%E in conjunction with decreased dietary LA intake (2.5–4.6%E) (n = 7); and
decreasing ALA intake to between 0.01 and 0.5%E in conjunction with either decreased or maintained LA intake (2.0–6%E) (n = 6).
The lowest LA:ALA diet ratio in all trials was 1:1 and the highest was 26:1. The number of dietary interventions in each category is summarized in Table 2 (note that some trials included more than one category of dietary intervention).
Table 2.
Fatty acid profile of dietary interventions and number of studies reporting increases in EPA and DHA total fatty acid content.
| Dietary intervention | Number of studies | Number of studies ↑EPA | Number of studies ↑DHA |
|---|---|---|---|
| ① ↑ALA ↔ LA | 9 | 6 | 0 |
| ② ↔ALA ↓ LA | 7 | 5 | 3 |
| ③ ↑ALA ↓LA | 7 | 6 | 3 |
| ④ ↓ALA ↓LA/↔LA | 6 | 1 | 1 |
ALA, alpha-linolenic acid; DHA, docosahexaenoic acid; EPA, eicosapentaenoic acid; LA, linoleic acid; ↑EPA/DHA represents a significant increase, diet interventions ↑increase ↓decrease; and ↔ change.
3.2. Intervention
The majority of trials in all categories used capsules, liquid oil or specially produced foodstuffs, e.g. margarines, salad dressings, bread and cakes, with a pre-defined fatty acid composition against a background of either individually designed diets or standard diets to achieve the desired changes in dietary fatty acid intakes. The majority of the trials (15/20) were conducted in free living individuals who were provided with fortified foods to add to their normal diet and/or were advised on foods to consume and/or to avoid at home. Individually designed diets which were kilojoule and nutrient controlled according to energy requirements were used in the remaining 5 studies [16,19–22].
Flaxseed/linseed oil (LA, 16%; ALA, 57% of total fatty acids) was the oil most commonly used to increase dietary ALA, while sunflower (LA, 64% of total fatty acids) and canola (LA, 20%; ALA, 10% of total fatty acids) oils were used to increase dietary n-6 in the majority of studies. These oils were either provided in the form of capsules or added to foods to modify the dietary fat profile. One study used macadamia oil (LA, 1–3%; ALA, 1–2% of total fatty acids) in the low LA dietary intervention [18]. Studies which aimed to reduce n-6 PUFA intake that did not utilize individually prescribed diets provided specific instructions to participants regarding foods to avoid at home and eating out during the low LA intervention phase.
Thirteen studies [16,18–21,23–30] allowed fish during the high ALA/low LA dietary intervention, while 7 studies excluded fish [22,31–36]. Two studies excluded all meat sources from the diet throughout the trial [33,37].
3.3. Method of recording dietary intake
A number of methods were used to assess dietary intake in these studies. The use of a weighed food diary was reported in 7 of the 20 trials [18,22,23,30–33]. However, of these, diaries were kept only for one week during the intervention period in three studies [22,31,32] and in one study the length of time the diaries were kept was not reported [30]. Six studies stated that dietary intake was assessed using food diaries/records, however, no details of the methodology were provided, and it was unclear whether or not the foods in these records were weighed [25,26,29,34–36]. The remaining studies used food frequency questionnaires, diet history interviews and 24 h food recalls to assess dietary intake [16,20,21,24,26–28].
3.4. Sample population type, sample size and intervention duration
The studies included in this review were undertaken across a range of countries including the USA, Australia, United Kingdom and The Netherlands (Table 1). Sample sizes ranged from 8 to 605 participants with the majority of studies (17/20) having less than 74 participants, and with some of the intervention groups having a sample size as small as 8 [25]. Participants were aged between 19 and 65 years with three studies including participants in their 70s. Of the included studies, 5 included only male participants [19,23,25,33,34], 1 included only female participants [21], while the remaining studies included both sexes. The majority of studies included healthy volunteers with only three studies including participants with coronary disease, rheumatoid arthritis, or chronic daily headaches [16,26,27,29]and one study only including post-menopausal women with high circulating levels of testosterone (> 0.38 ng/ml) [21]. The average body mass index (BMI) in the study populations ranged from 21.4 kg/m2 to 28.4 kg/m2. The majority of studies (14/20) reported no changes between or within groups for body mass index (BMI) with two studies reporting differences in the body weight change across the trial period between treatment groups [21,28]. The dietary interventions varied in length from 4 weeks to 5 years with between 4 and 12 weeks being the most common (17/20 studies). Of the studies reported in this review, 12 reported fatty acid content of plasma phospholipids pre- and post-intervention, 6 reported fatty acid status in erythrocyte phospholipids and 2 reported both.
3.5. Effects on n-3 LCPUFA status
The impact of the dietary intervention on EPA and DHA status for the 4 different intervention categories is summarized in Table 2. Six of the 9 studies which increased dietary ALA while maintaining LA intake reported a significant increase in EPA content in plasma/erythrocyte phospholipids, with a median increase of 60% (range 30.3–366%) [22,24,25,28,32,33]. However, none reported increases in DHA status. Five of the 7 studies which decreased LA while maintaining ALA intake reported a significant increase in EPA status, with a median increase of 33% (range 3.5–51.3%) [16,22,26,29,32]. Three of these studies also reported increases in DHA (median 13.9%, range 7.9–24.7%) [16,26,29]. Six of the 7 studies which both increased ALA and decreased LA intake reported a significant increase in EPA [23,24,26–29,34] and 3 reported increases in both EPA and DHA status [26,27,29]. The median increase in EPA status in these studies was 150% (range 50–273%) while that for DHA status was 79.6% (range 28–112%). Only one of the 6 studies which reduced ALA whilst maintaining or reducing LA intake reported significant increases in EPA and DHA status in plasma phospholipids of 25% and 8%, respectively[18].
4. Discussion
A review of the current literature suggests that most of the studies in adult humans in which ALA intake was increased reported increases in EPA status at the end of the intervention period, whereas only studies that reduced LA intake reported increases in DHA status. The results of these existing studies, therefore, provide evidence that it is possible to improve n-3 LCPUFA status in humans without increasing n-3 LCPUFA intake, however, whether these effects are sufficient to provide clinical benefits or to overcome the effects of long-term habitual dietary intake, remains to be determined.
While the sample sizes were generally small, all but 3 studies reported that increased ALA intake to between 1.1 and 6.3%E, compared to ~0.6%E in the typical Western diet, was associated with a significant increase in EPA status. There was also some suggestion of a dose–response relationship, with the 2 studies which increased ALA intake to the greatest extent (3.4%E and 6.3% E) demonstrating the greatest increases in EPA status [24,33]. There was also considerable variability, however, in the proportional increase in EPA between studies, ranging between 33% and 90% in studies with relatively modest increases in ALA intakes (from ~0.6% to ~1.7%E). This is consistent with previous studies suggesting that the efficiency of ALA conversion in humans is influenced by a range of factors, including the background diet, sex and genetics [38], and suggests that increasing ALA intakes may not necessarily be an appropriate strategy for increasing EPA status in all individuals. There was no clear relationship between the duration of the dietary intervention and the magnitude of the change in EPA status, however this is difficult to assess given that studies of differing durations also provided diets with different contents and rations of ALA and LA, which would also be expected to influence the results. The results of the studies in this review also suggest that increasing ALA intake is not an effective strategy for increasing DHA status in adult humans. This is consistent with studies in rodents, which have reported that while the EPA content of blood and tissues increases linearly with increasing ALA intake, DHA content plateaus at relatively low dietary ALA intakes (~1%E) [11,12]. This is not unexpected given that the delta-6-desaturase is used once in the synthesis of EPA from ALA, but twice in the synthesis of DHA, such that increasing the amount of ALA in the system effectively limits the availability of the desaturase enzyme for converting EPA through to DHA [6]. Bypassing the first delta 6 desaturase required, by increasing dietary SDA, as in the study by James and colleagues [30], was also not associated with an increase plasma DHA, suggesting that other enzymes in the pathway are also rate-limiting to conversion. It is also important to note that while the increase in EPA produced by the high ALA diets would be associated with an increase in overall n-3 LCPUFA status, given that DHA has more potent anti-inflammatory and neuroprotective effects [1,2,39], the physiological/clinical benefits of dietary interventions which increase EPA without a concomitant increase in DHA status are unclear. This should be considered when recommending high ALA diets as a strategy for improving n-3 LCPUFA status in human populations.
The 3 studies that failed to demonstrate an increase in EPA intake in response to increased ALA intake all had methodological issues which complicate the interpretation of the results. Two of the studies did not include a run-in period prior to the start of the dietary intervention [35,36]. This is particularly important given that all three of these studies also excluded fish from the diet. Although dietary intake of n-3 LCPUFA during the intervention period was not reported, it seems reasonable to assume that the exclusion of fish would have resulted in lower EPA and DHA intakes during the intervention period. Thus, any increase in EPA synthesis due to increases in ALA intakes may have been counteracted by decreases in EPA intake over the same period. Notably, the one study that did include a run-in period, although it failed to detect a significant increase in EPA status as a result of 6 weeks on a diet containing 3.23%E ALA, did report increases in EPA status from 0.6% to 1.0% (66%) [31] which was similar in magnitude to that reported in other studies with similar doses. It is therefore possible that the small number of subjects (n=13) and mixture of males and females, which are known to have different capacities for ALA conversion [38], may have increased variability and limited the statistical power of the study to detect differences between groups.
The fact that, of the 7 studies which decreased LA intake without a concomitant increase in ALA, 5 reported an increase in EPA status and 3 also demonstrated increases in DHA status, is consistent with the view that reducing LA intake is an effective strategy for increasing the incorporation of pre-formed n-3 LCPUFA and/or conversion of ALA to its long-chain derivatives in humans, by reducing competition for these processes. The one study that did not report an increase in EPA status following a low LA diet was conducted in a very specific population, i.e. postmenopausal women with low estrogen and high circulating testosterone concentrations [21]. Since estrogen has been implicated in the higher capacity for ALA conversion in females compared to males [5], it is possible that the low estrogen and high testosterone in these women reduced their efficiency for ALA conversion, despite the reduced competition from LA. Interestingly, this same study did report an increase in DHA status following the low LA diet, however, it is difficult to determine the extent to which this was due to the reduction in LA intake, since the authors also reported that fish intake increased 2-fold during the intervention period compared to baseline. This latter example highlights the importance of ensuring that the intake of fatty acids other than those which are the subject of study are maintained at a constant level during the intervention period.
The results of the human studies conducted to date suggest that the most effective strategy for increasing n-3 LCPUFA was a combined approach involving both an increase in ALA and decrease in LA intake, with 6 of the 7 studies which took this approach reporting significant increases in EPA status at the end of the intervention. As with the high ALA diet intervention, there was limited evidence of an effect of duration of the high ALA, low LA diets being related to the effects on fatty acid status. Indeed, unpublished data from the study by Ramsden and colleagues indicated that the change in EPA and DHA status after 4 weeks on the low n-6 LA diet was similar in magnitude to those seen at 12 weeks. This suggests, therefore, that the nature of the intervention, rather than the duration, is the most critical determinant of its effects on tissue fatty acid composition. The one study that was not successful with this intervention was conducted on a small group of males (n=16) [19], and it is possible that the failure to detect an effect was due to the lower efficiency of conversion of ALA to EPA in males compared to females [38]. In addition, the study involved a cross-over design in which the control and low LA/high ALA diets were fed to the same individuals over 2 separate 56-day periods, but failed to include a wash-out period between the diets. This makes it difficult to draw clear conclusions, since carry-over effects of the first diet are likely to have impacted on the response of the individual to the subsequent diet.
While the combination of reduced LA and increased ALA intake appears to be effective at increasing EPA, the current evidence suggests that its efficacy in increasing DHA status may be more limited. The three studies in this intervention category which reported increases in DHA all included fish in the diet [26,27,29]. In addition, one of these studies reported that fish and shellfish intakes actually increased during the intervention [27]. Thus, it is impossible to attribute the increased DHA status solely to the low LA/high ALA diet in this study. The only other studies to report an increase in DHA status [26,29] had the greatest reduction in LA intake (from 7.4%E to 2.4%E), possibly indicating that this degree of reduction in LA intake is required in order to reduce competition to the extent that DHA, as well as EPA, synthesis/incorporation is enhanced. This is supported by the fact that the only study to report an increase in EPA and DHA status in response to a dietary intervention in which both ALA and LA intakes were reduced, was one which achieved a dietary LA intake of ~2.0%E, compared to 6% E in the pre-intervention period [18].
4.1. Methodological limitations and recommendations for future studies
4.1.1. Accurate measures of dietary intake
Results from dietary intervention studies are highly dependent on capturing actual dietary intake and participant’s compliance with the prescribed diet, both of which are notoriously difficult to capture in free-living humans. Less than half of the reviewed studies used a weighed food record, regarded as the gold standard in relation to assessing dietary intakes in humans [40], and where it was applied it was typically only done during a single week of the intervention period [22,31,32]. Thus, our recommendation for future studies is that information on dietary intake be collected using a weighed food diary both before and for each week of the dietary intervention period, in order to provide the most robust information regarding dietary fatty acid composition. In addition, the use of databases with accurate and up-to-date information on the fatty acid composition of foods is essential to ensuring the reliability of these data.
4.1.2. Maintaining consistency in the composition of the background diet
In several studies included in this review the intake of fatty acids other than ALA and/or LA were also altered during the intervention period, making it difficult to attribute the changes in fatty acid status solely to the effects of altered dietary ALA/LA. This was particularly notable in the cases of studies in which participants were instructed to exclude fish from their diet during the intervention period, or in which the participant’s intake of fish/seafood actually increased during the ALA/LA dietary intervention. In addition, only four of the nineteen studies included a run-in period prior to the dietary intervention, or wash-out periods in cross-over designs. Thus, to ensure that the effects of alterations to dietary ALA and/or LA on tissue fatty acid composition, it is essential to ensure that the intake of other fatty acids, in particular the n-3 LCPUFA, remains constant during the ALA/LA dietary intervention and that appropriate run-in periods are applied prior to the intervention where this is not the case.
The majority of studies included in this review included small numbers of participants, and no study provided any justification for the sample size used or indication if they provided sufficient statistical power to limit type 1 errors. In addition, the majority of these studies included both male and female participants, and did not assess the results separately by sex. This is significant given the well-established differences in fatty acid metabolism between males and females, in particular the ~2.5 fold greater efficiency for ALA conversion in females compared to males [38]. Thus, our recommendation is for future studies that a sample size calculation be conducted before recruitment, and that males and females are either stratified or studied separately.
5. Conclusion
In summary, our systematic review of the existing literature suggests that it is possible to increase EPA, and to some extent DHA, status by reducing LA and/or increasing ALA intake in humans, although the magnitude of these changes are arguably substantially less than those achieved with dietary n-3 LCPUFA supplementation. The most effective strategy for improving n-3 LCPUFA status appears to be a combination of increased ALA and reduced LA intakes, although it appears that decrease in LA intake to below 2.5%E may be required to successfully increase DHA status.
Overall, the majority of studies in this area to date have been relatively poor in quality, which limits the ability to draw robust conclusions. We have made a number of recommendations for improving the quality of fatty acid trials, including undertaking sample size calculations to ensure sufficient statistical power, separating males and females in the analysis, ensuring that the fatty acid composition of the background diet does not change during the intervention period and allowing for appropriate ‘wash-out’ and ‘run-in’ periods where this is not the case, e.g. where fish will be excluded.
In conclusion, while the current data support the suggestion that n-3 LCPUFA status in humans can be increased in the absence of increased n-3 LCPUFA intake, there is a need for well-controlled and adequately powered studies in males and females in order to evaluate whether these diets could be a viable alternative to n-3 LCPUFA supplementation for achieving improvements in human health.
Acknowledgements
BM is supported by a Career Development Award from the National Health and Medical Research Council of Australia (NHMRC) (APP1004211). RAG is supported by a NHMRC Senior Research Fellowship (APP1046207). KEW is supported by an Australian Postgraduate Award.
References
- [1].Calder PC, N-3 fatty acids and cardiovascular disease: evidence explained and mechanisms explored, Clin. Sci 107 (2004) 1–11. [DOI] [PubMed] [Google Scholar]
- [2].Makrides M, Gibson RA, McPhee AJ, Yelland L, Quinlivan J, Ryan P, Effect of DHA supplementation during pregnancy on maternal depression and neurodevelopment of young children: a randomized controlled trial, JAMA 304 (2010) 1675–1683. [DOI] [PubMed] [Google Scholar]
- [3].Proudman SM, James MJ, Spargo LD, et al. , Fish oil in recent onset rheumatoid arthritis: a randomised, double-blind controlled trial within algorithm-based drug use, Ann. Rheum. Dis 74 (2015) 89–95. [DOI] [PubMed] [Google Scholar]
- [4].Flock MR, Harris WS, Kris-Etherton PM, Long-chain omega-3 fatty acids: time to establish a dietary reference intake, Nutr. Rev 71 (2013) 692–707. [DOI] [PubMed] [Google Scholar]
- [5].Burdge GC, Calder PC, Conversion of alpha-linolenic acid to longer-chain polyunsaturated fatty acids in human adults, Reprod. Nutr. Dev 45 (2005) 581–597. [DOI] [PubMed] [Google Scholar]
- [6].Sprecher H, Luthria D, Mohammed B, Baykousheva S, Reevaluation of the pathways for the biosynthesis of polyunsaturated fatty acids, J. Lipid Res 36 (1995) 2471–2477. [PubMed] [Google Scholar]
- [7].Sprecher H, Chen Q, Yin FQ, Regulation of the biosynthesis of 22:5n-6 and 22:6n-3: a complex intracellular proces, Lipids 34 (1999) S153–156. [DOI] [PubMed] [Google Scholar]
- [8].Lands WE, Morris A, Libelt B, Quantitative effects of dietary polyunsaturated fats on the composition of fatty acids in rat tissues, Lipids 25 (1990) 506–516. [DOI] [PubMed] [Google Scholar]
- [9].Lands B, A critique of paradoxes in current advice on dietary lipids, Prog. Lipid Res 47 (2008) 77–106. [DOI] [PubMed] [Google Scholar]
- [10].Blasbalg TL, Hibbeln JR, Ramsden CE, Majchrzak SF, Rawlings RR, Changes in consumption of omega-3 and omega-6 fatty acids in the united states during the 20th century, Am. J. Clin. Nutr 93 (2011) 950–962. [DOI] [PMC free article] [PubMed] [Google Scholar]
- [11].Gibson RA, Neumann MA, Lien EL, Boyd KA, Tu WC, Docosahexaenoic acid synthesis from alpha-linolenic acid is inhibited by diets high in polyunsaturated fatty acids, Prostaglandins Leukot. Essent. Fatty Acids 88 (2013) 139–146. [DOI] [PubMed] [Google Scholar]
- [12].Tu WC, Cook-Johnson RJ, James MJ, Muhlhausler BS, Gibson RA, Omega-3 long chain fatty acid synthesis is regulated more by substrate levels than gene expression, Prostaglandins Leukot. Essent. Fatty Acids 83 (2010) 61–68. [DOI] [PubMed] [Google Scholar]
- [13].Blank C, Neumann MA, Makrides M, Gibson RA, Optimizing dha levels in piglets by lowering the linoleic acid to {alpha}-linolenic acid ratio, J. Lipid Res 43 (2002) 1537–1543. [DOI] [PubMed] [Google Scholar]
- [14].Clark KJ, Makrides M, Neumann MA, Gibson RA, Determination of the optimal ratio of linoleic acid to alpha-linolenic acid in infant formulas,J. Pediatr 120 (1992) S151–158. [DOI] [PubMed] [Google Scholar]
- [15].Tarpila S, Aro A, Salminen I, et al. , The effect of flaxseed supplementation in processed foods on serum fatty acids and enterolactone, Eur. J. Clin. Nutr 56 (2002) 157–165. [DOI] [PubMed] [Google Scholar]
- [16].Renaud S, De Lorgeril M, Delaye J, et al. , Cretan mediterranean diet for prevention of coronary heart disease, Am. J. Clin. Nutr 61 (1995) 1360S–1367S. [DOI] [PubMed] [Google Scholar]
- [17].Liou YA, King DJ, Zibrik D, Innis SM, Decreasing linoleic acid with constant alpha-linolenic acid in dietary fats increases (n-3) eicosapentaenoic acid in plasma phospholipids in healthy men, J. Nutr 137 (2007) 945–952. [DOI] [PubMed] [Google Scholar]
- [18].Wood K, Lau A, Mantzioris E, Gibson R, Ramsden C, Muhlhausler B, A low omega-6 polyunsaturated fatty acid (n-6 pufa) diet increases omega-3 (n-3) long chain pufa status in plasma phospholipids in humans, Prostaglandins Leukot. Essent. Fatty Acids 90 (2014) 133–138. [DOI] [PMC free article] [PubMed] [Google Scholar]
- [19].Kelley D, Nelson G, Love J, et al. , Dietary α-linolenic acid alters tissue fatty acid composition, but not blood lipids, lipoproteins or coagulation status in humans, Lipids 28 (1993) 533–537. [DOI] [PubMed] [Google Scholar]
- [20].Raatz SK, Bibus D, Thomas W, Kris-Etherton P, Total fat intake modifies plasma fatty acid composition in humans, J. Nutr 131 (2001) 231–234. [DOI] [PubMed] [Google Scholar]
- [21].Colombo C, Muti P, Pala V, et al. , Plant-based diet, serum fatty acid profile, and free radicals in postmenopausal women: the diet and androgens (DIANA) randomized trial, Int. J. Biol. Markers 20 (2005) 169–176. [DOI] [PubMed] [Google Scholar]
- [22].Goyens PL, Mensink RP, The dietary alpha-linolenic acid to linoleic acid ratio does not affect the serum lipoprotein profile in humans, J. Nutr 135 (2005) 2799–2804. [DOI] [PubMed] [Google Scholar]
- [23].Mantzioris E, James M, Gibson R, Cleland L, Dietary substitution with an alinolenic acid-rick vegetable oil increases eicosapentaenoic acid concentrations in tissues, Am. J. Clin. Nutr 59 (1994) 1304–1309. [DOI] [PubMed] [Google Scholar]
- [24].Finnegan YE, Minihane AM, Leigh-Firbank EC, et al. , Plant and marinederived n-3 polyunsaturated fatty acids have differential effects on fasting and postprandial blood lipid concentrations and on the susceptibility of LDL to oxidative modification in moderately hyperlipidemic subjects, Am. J. Clin. Nutr 77 (2003) 783–795. [DOI] [PubMed] [Google Scholar]
- [25].Wallace FA, Miles EA, Calder PC, Comparison of the effects of linseed oil and different doses of fish oil on mononuclear cell function in healthy human subjects, Br. J. Nutr 89 (2003) 679–689. [DOI] [PubMed] [Google Scholar]
- [26].Macintosh BA, Ramsden CE, Faurot KR, et al. , Low-n-6 and low-n-6 plus high-n-3 diets for use in clinical research, Br. J. Nutr 110 (2012) 559–568. [DOI] [PMC free article] [PubMed] [Google Scholar]
- [27].Hagfors L, Nilsson I, Skoldstam L, Johansson G, Fat intake and composition of fatty acids in serum phospholipids in a randomized, controlled, mediterranean dietary intervention study on patients with rheumatoid arthritis, Nutr. Metab 2 (2005) 26. [DOI] [PMC free article] [PubMed] [Google Scholar]
- [28].Kontogianni MD, Vlassopoulos A, Gatzieva A, et al. , Flaxseed oil does not affect inflammatory markers and lipid profile compared to olive oil, in young, healthy, normal weight adults, Metabolism 62 (2013) 686–693. [DOI] [PubMed] [Google Scholar]
- [29].Taha AY, Cheon Y, Faurot KF, et al. , Dietary omega-6 fatty acid lowering increases bioavailability of omega-3 polyunsaturated fatty acids in human plasma lipid pools, Prostaglandins Leukot. Essent. Fatty Acids 90 (2014) 151–157. [DOI] [PMC free article] [PubMed] [Google Scholar]
- [30].James MJ, Ursin VM, Cleland LG, Metabolism of stearidonic acid in human subjects: comparison with the metabolism of other n-3 fatty acids, Am. J. Clin. Nutr 77 (2003) 1140–1145. [DOI] [PubMed] [Google Scholar]
- [31].Wensing AGCL, Mensink RP, Hornstra G, Effects of dietary n-3 polyunsaturated fatty acids from plant and marine origin on platelet aggregation in healthy elderly subjects, Br. J. Nutr 82 (1999) 183–191. [PubMed] [Google Scholar]
- [32].Goyens PL, Spilker ME, Zock PL, Katan MB, Mensink RP, Conversion of alpha-linolenic acid in humans is influenced by the absolute amounts of alpha-linolenic acid and linoleic acid in the diet and not by their ratio, Am. J. Clin. Nutr 84 (2006) 44–53. [DOI] [PubMed] [Google Scholar]
- [33].Li D, Sinclair A, Wilson A, et al. , Effect of dietary α-linolenic acid on thrombotic risk factors in vegetarian men, Am. J. Clin. Nutr 69 (1999) 872–882. [DOI] [PubMed] [Google Scholar]
- [34].Hussein N, Ah-Sing E, Wilkinson P, Leach C, Griffin BA, Millward DJ, Long-chain conversion of [13c]linoleic acid and α-linolenic acid in response to marked changes in their dietary intake in men, J. Lipid Res 46 (2005) 269–280. [DOI] [PubMed] [Google Scholar]
- [35].Egert S, Kannenberg F, Somoza V, Erbersdobler HF, Wahrburg U, Dietary α-linolenic acid, epa, and dha have differential effects on ldl fatty acid composition but similar effects on serum lipid profiles in normolipidemic humans, J. Nutr 139 (2009) 861–868. [DOI] [PubMed] [Google Scholar]
- [36].Valsta LM, Salminen I, Aro A, Mutanen M, Alpha-linolenic acid in rapeseed oil partly compensates for the effect of fish restriction on plasma long chain n-3 fatty acids, Eur. J. Clin. Nutr 50 (1996) 229–235. [PubMed] [Google Scholar]
- [37].Wien M, Rajaram S, Oda K, Sabate J, Decreasing the linoleic acid to alpha-linolenic acid diet ratio increases eicosapentaenoic acid in erythrocytes in adults, Lipids 45 (2010) 683–692. [DOI] [PubMed] [Google Scholar]
- [38].Burdge G, Alpha-linolenic acid metabolism in men and women: nutritional and biological implications, Curr. Opin. Clin. Nutr. Metab. Care 7 (2004) 137–144. [DOI] [PubMed] [Google Scholar]
- [39].James MJ, Gibson RA, Cleland LG, Dietary polyunsaturated fatty acids and inflammatory mediator production, Am. J. Clin. Nutr 71 (2000) 343S–348S. [DOI] [PubMed] [Google Scholar]
- [40].Thompson F, Byers T, Dietary assessment resource manual, J. Nutr 124 (Suppl. 11) (1994) 2245S–2317S. [DOI] [PubMed] [Google Scholar]