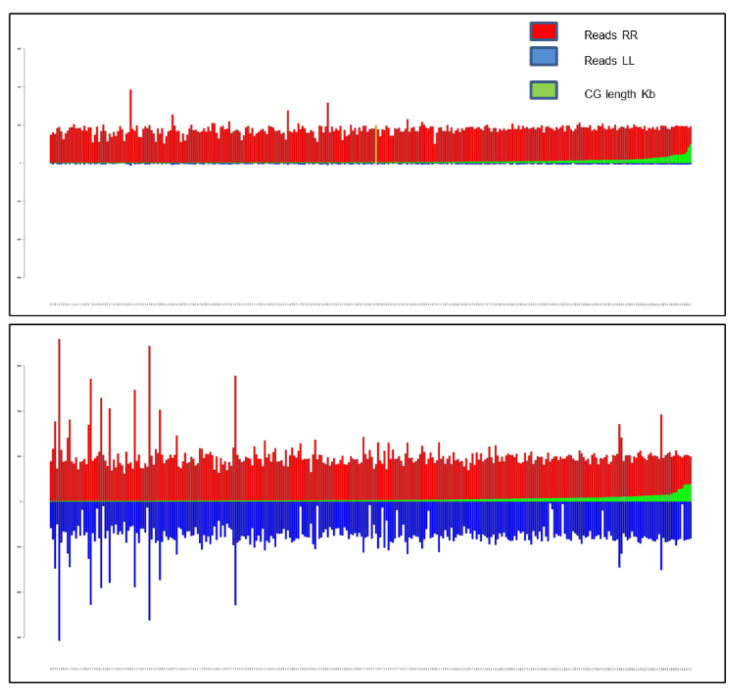
Figure 6.
Graphical representation of selected contig coverage in the asm_305 assembly. Upper panel: Contigs exhibiting a ratio of mapped RR vs. SS reads of a least 30 (log2 > 4.90) are shown. Lower panel: contigs exhibiting a ratio of RR vs. SS reads < 30 are shown. For both panels, contigs are ordered by increasing the length along the X axis. RR, SS and contig length are represented as red, blue and green bars, respectively.

