Abstract
Background:
We investigated the extent to which the administered dose (activity) level can be reduced without sacrificing diagnostic accuracy for three reconstruction strategies for SPECT-myocardial perfusion imaging (MPI).
Methods:
We optimized the parameters of the three reconstruction strategies for perfusion-defect detection over a range of simulated administered dose levels using a set of hybrid studies (derived from 190 subjects) consisting of clinical SPECT-MPI data modified to contain realistic simulated lesions. The optimized strategies we considered are filtered backprojection (FBP) with no correction for degradations, ordered-subsets expectation-maximization (OS-EM) with attenuation correction (AC), scatter correction (SC), and resolution correction (RC), and OS-EM with scatter and resolution correction only. Each study was evaluated using a total perfusion deficit (TPD) score computed by the Quantitative Perfusion SPECT (QPS) software package. We conducted a receiver operating characteristics (ROC) study based on the TPD scores for each dose level and reconstruction strategy.
Results:
For EBP, the achieved optimum values of the area under the ROC curve (AUC) at 100%, 50%, 25% and 12.5% of standard dose were 0.75, 0.74, 0.72 and 0.70, respectively, compared to 0.81, 0.79, 0.76 and 0.74 for OS-EM with AC-SC-RC and 0.78, 0.77, 0.74, 0.72 for OS-EM with SC-RC.
Conclusions:
Our results suggest that studies reconstructed by OS-EM with AC-SC-RC could possibly be reduced, on average, to 25% of the originally administered dose without causing diagnostic accuracy (AUC) to decrease below that of FBP.
INTRODUCTION
Myocardial perfusion imaging (MPI) provides important, objective findings for patients with known or suspected, chronic, coronary-artery disease (CAD) relating to the assessment of disease severity, risk stratification, and prognosis (1). MPI with single-photon emission computed tomography (SPECT) has been shown to improve sensitivity for the detection of CAD (2). However, as in any nuclear imaging modality, radiation exposure in SPECT-MPI has become a major concern. Reduction of radiation dose has become a major focus of attention (3–5), with SPECT identified as the second-leading contributor to radiation dose among medical imaging studies (5). Owing to the crucial role of SPECT-MPI in the clinic and the high levels of radiation involved, dose reduction in these studies is critically important.
Significant advances, such as three-dimensional (3D) iterative reconstruction, may lead to potential reductions in radiation dose; however, the full extent to which such reductions can be made through optimization have not yet been determined. Modern reconstruction methods allow the correction of common SPECT imaging artifacts, achieving more-accurate results than those obtained by conventional clinical reconstruction methods. In 2003, our group demonstrated via a clinical receiver-operating characteristic (ROC) study that 3D iterative reconstruction in MPI with resolution recovery (RC), modeling distance-dependent resolution, in conjunction with attenuation correction (AC) and scatter correction (SC), can lead to the increased diagnostic accuracy over AC alone, and that both are more accurate than conventional reconstruction (6). Also, there have been exciting findings showing that the improvements produced by 3D reconstruction can be traded for reductions in imaging time and/or administered activity (7–14). Although these preliminary studies show highly encouraging potential for dose reduction, they are difficult to compare owing to variations and limitations in the methodologies employed, and inconsistencies between studies in their underlying assumptions. For example, in (14), a dose-reduction study was performed using simulated data and figures of merit related to image quality instead of diagnostic performance (14). Thus, the study did not capture the fully biological variability that is inherent in clinical data. In (13), the effect of halving administered activity was simulated by reducing the scanning time by half, but no further investigation was performed with respect to the tuning of reconstruction parameters to achieve maximum diagnostic performance. Furthermore, none of the previous studies (7–14) has sought to determine the full extent to which administered dose can be reduced without harming diagnostic accuracy.
Herein, we examine the diagnostic accuracy of SPECT-MPI as a function of dose reduction, and we determine the optimal parameter settings of the reconstruction strategies so as to minimize injected activity without deleterious effect on diagnostic performance. We provide a comparison of perfusion-defect detection accuracy versus administered dose, ranging from full clinical dose, down to one-eighth of clinical dose, for ordered-subsets expectation maximization (OS-EM) using two different correction settings (AC-SC-RC or SC-RC), and filtered-backprojection (FBP) with no correction for degradations. Our experiments were based on hybrid studies, i.e., clinical data in which we introduced simulated defects. At each count level we optimized the reconstruction parameters for maximum perfusion-defect detection accuracy, with detection accuracy measured using clinical model observers from the extensively validated Quantitative Perfusion SPECT (QPS) software package (15). We then compared the two reconstruction algorithms with respect to their ability to preserve defect-detection performance as dose is reduced.
MATERIALS AND METHODS
Clinical data acquisition
Under institutional review board approval, data were acquired from 190 patients between February 2013 to November 2016 at the Department of Radiology, University of Massachusetts Medical School, Worcester, MA. Data were acquired by a Philips BrightView SPECT/CT system in list mode. All patients underwent a one-day rest/stress SPECT MPI protocol with Tc-99m sestamibi, with rest activity level ranging from 10 to 12 mCi, depending on BMI, and stress activity level that was 3 times higher. As some tracer would remain in the syringe after injection, the actual activity injected was determined by assaying the syringe with a dose calibrator. Stress was induced either by exercise or pharmacologically. Approximately 45 minutes after injection of sestamibi, patients were positioned supinely on the imaging table while the two camera heads, in a 90° configuration, acquired data at 64 projection angles over 180° from right anterior oblique (RAO) to left posterior oblique (LPO) using low-energy high-resolution (LEHR) parallel-hole collimators. With patients quietly breathing, cone-beam computed tomography (CT) imaging (60 seconds) was performed prior to emission imaging for use in attenuation correction (AC) (16). The cone-beam CT slices were converted to attenuation maps for usage with Tc-99m (17). We have previously determined that such attenuation maps provided good correction even in the presence of respiratory motion (18).
Formation of hybrid studies
In order to perform perfusion-defect based optimization of our selected reconstruction strategies, we created a set of “hybrid studies”. These are clinical studies with realistic simulated perfusion defects distributed randomly among the three vascular territories: the left-anterior-descending coronary artery (LAD), the right coronary artery (RCA), and the left circumflex (LCX). Defects created for one- and two-vessel disease were simulated with the locations of the defects selected according to clinical prevalence (19). Defects representing one-vessel disease were placed in locations easily identified as the LAD, the RCA, and the LCX, while defects representing two-vessel disease straddled the LAD and LCX, the LCX and RCA, and the RCA and LAD.
Synthetic cardiac-perfusion defects were introduced into SPECT images read as normal during clinical evaluation, using the polar map to define defect size and location (20). The process started with manual definition of two-dimensional (2D) regions of interest (ROIs) representing the defect area in the left-ventricular (LV) polar maps generated from the SPECT images. The inverse transformations to all of the operations performed to form the polar maps were then applied to the 2D ROI to obtain the altered projections of the desired lesions (20, 21).
In our population of hybrid studies, in addition to providing variation in defect location, we also generated defects with three different sizes (extents; small, moderate and large) and four contrast levels (severities; 65%, 50%, 35% and 20%). The contrast levels, chosen based on preliminary ROC experiments, characterize the reduction in average counts from the LV wall for each simulated perfusion defect. The goal of these choices was to simulate typical variations among clinical studies.
Figures 1 and 2 illustrate the variations we generated by adjusting the severity and extent of the lesions for an example patient. The figures show short-axis images of the patient’s clinical image (labeled “no defect”), along with hybrid images containing a large simulated LAD defect at four different severities. At higher contrast levels (i.e. 65% or 50%) the defect is readily seen, but more difficult to observe at lower contrast levels (i.e. 35% or 20%), in spite of the large size of the lesion.
Figure 1.
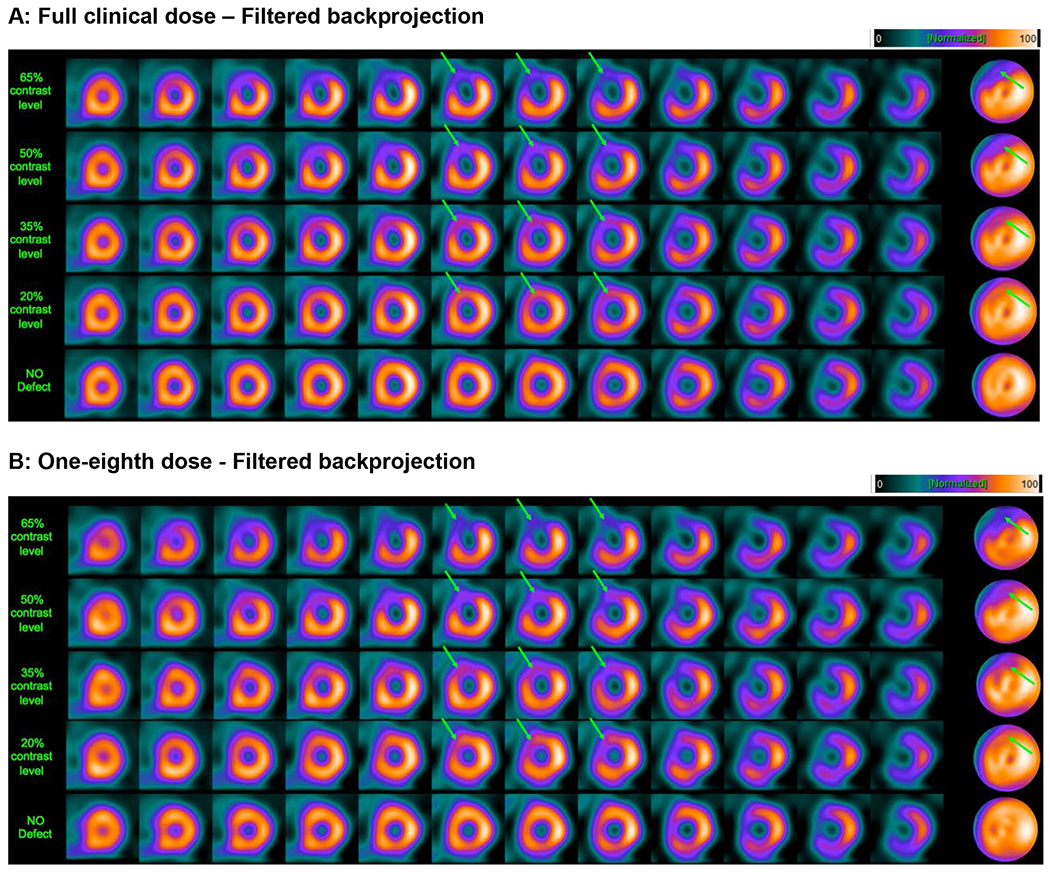
Example short-axis slices and polar maps, obtained by filtered backprojection, for a 55-year-old female patient with a body-mass index (BMI) of 33.3 from a clinical study, with a large, simulated defect introduced in the LAD territory. Arrows indicate the defect location. Panels A and B show short-axis image slices and polar maps for a clinical scan (no defect; bottom row) and for four levels of defect contrast (20%, 35%, 50%, and 65%). The images in Panel A were obtained from full clinical dose, while the images in Panel B are at a simulated dose level that is one-eighth (12.5%) of clinical dose. The images were obtained by optimizing the reconstruction parameters for the particular dose level. This figure illustrates that image quality can be preserved at reduced dose by optimizing the reconstruction parameters (in this case, the cutoff frequency of the smoothing filter).
Figure 2.
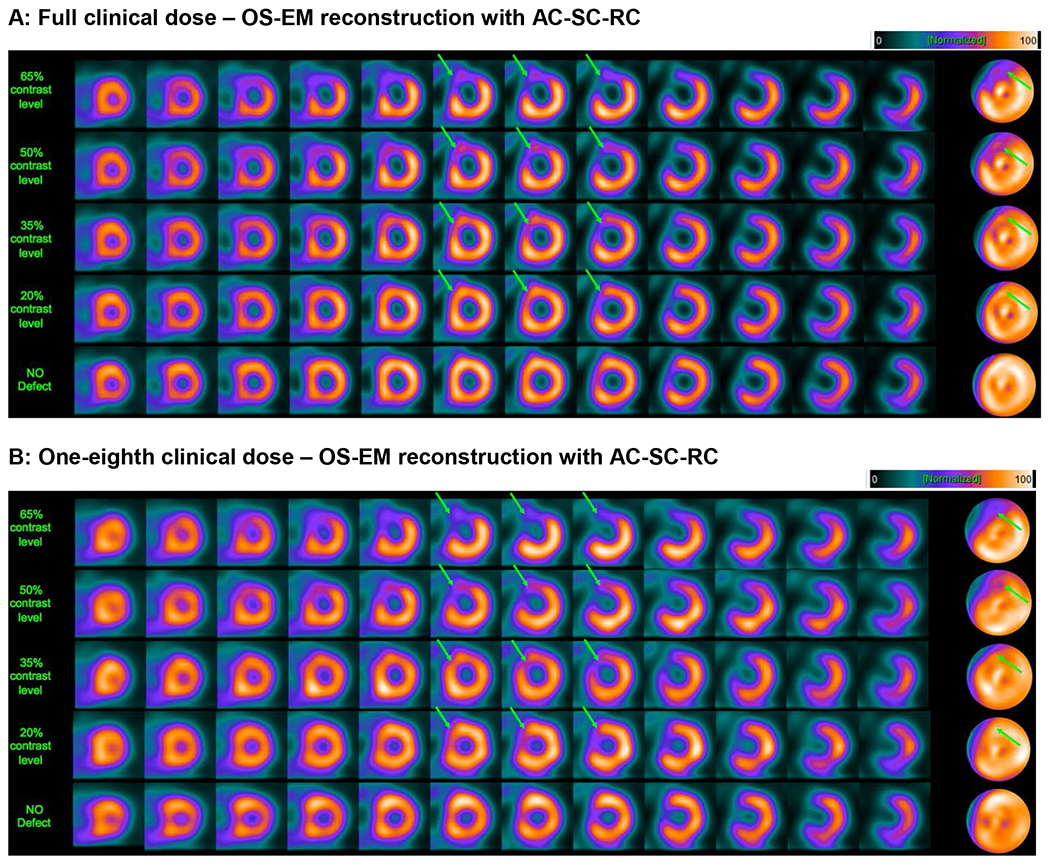
Example short-axis slices and polar maps, obtained by OS-EM reconstruction with attenuation, scatter and resolution correction for the same patient and same defect contrast cases as in Figure 1. This figure again shows that image quality can be maintained at reduced dose by optimizing the reconstruction parameters (in this case, the post-reconstruction filter parameter and number of OS-EM iterations).
Low-dose simulated studies
The observed counts in the clinical images varied across patients due to: a) variations in administered activity (caused by retention of tracer in the syringe), b) variations in attenuation and scattering of the emitted photons (caused by anatomical differences among the patients), and c) variations in localization of the Tc-99m sestamibi in the body tissues at the time of imaging. In the hybrid data, we simulated dose reductions by applying a fixed percentage reduction to all patients, to mimic the intrinsic variability seen among the clinical scans. We explored dose reductions of 50% (one half), 25% (one quarter), and 12.5% (one eighth) with respect to the full clinical dose (designated as 100%). We simulated reduced dose levels by applying statistical subsampling of the clinical data, in which each photon event detected at the clinical dose was randomly accepted or rejected according to a binomial distribution with probability equal to the proportion of desired dose level reduction, as in (22).
QPS software: clinical model observer for perfusion-defect detection
To evaluate perfusion-defect detectability we used the clinically validated commercial package from Cedars-Sinai (Quantitative Perfusion SPECT; QPS) as a clinical model observer. We used the total perfusion deficit score (TPD) computed by QPS as a measure of the defect, because it has been shown to agree well with experienced visual observers in detection of disease (23). TPD quantifies the non-uniformity of myocardial perfusion in the polar maps with respect to a reference database of normal studies (15). The measure captures both the severity and extent of the perfusion defect based on the average and standard deviation of normal studies included in the reference database. Thus, large (extent) defects or high contrast (severity) defects result on higher TPD scores while small or lower contrast defects result on lower TPD scores.
The characteristics of MPI-SPECT images depend on the reconstruction algorithm used, the algorithm parameter values (i.e. post-filter cutoff frequency), the injected dose level, and the patient gender. To account for this, we generated separate QPS normal-reference databases of “low-likelihood” patients for every combination of these settings. Each reconstructed image was compared to the corresponding QPS reference database. The QPS software was set so that it automatically chose the corresponding reference database for a given study depending on the study gender, dose level and reconstruction strategy used. This is also called “batch mode”, which allows to process large number of studies at the same time.
For purposes of algorithm optimization, we measured the final performance via area under the ROC curve (AUC) for the detection of perfusion defects. We applied Metz’s ROCkit software (24) to the total perfusion deficit (TPD) scores computed by QPS. Higher AUC values represent better separation between the TPD scores of normal versus abnormal patients. Since the TPD scores represent a total measure of both severity and extent for each patient’s myocardium, good separation of the TPD score distribution is equivalent to good detection performance of perfusion defects, which is represented by the AUC value. We used the option in the ROCkit software to input continuous data (TPD values) as opposed to the rating scale input typically employed with human observer scoring. Since simulated studies were employed we knew the truth as to perfusion defect presence or absence. Thus true-positives were defined as occurring when the QPS derived TPD value for the study was greater than the threshold value for a series of software determined threshold values, and false-positives were defined as when the QPS derived TPD values were greater than the same thresholds when no defect is present.
Optimization procedure for perfusion-defect detection
We optimized the parameters of three reconstruction strategies—filtered-back projection (FBP) with no correction for degradations, ordered-subsets expectation-maximization (OS-EM) with attenuation correction (AC), scatter correction (SC) and resolution correction (RC), and OS-EM with scatter and resolution correction only (SC-RC) —at each dose level to achieve maximum diagnostic accuracy (perfusion-defect detection) as judged by the area-under-the-curve (AUC). The parameter to be optimized in FBP was the cutoff frequency of the 2D pre-reconstruction Butterworth filter. We used an order-5 Butterworth (6). For the two strategies with OS-EM (AC-SC-RC or SC-RC), the SC was implemented by using the triple energy window (TEW) method (25). We performed distance-dependent resolution (DDR) correction by using a Gaussian diffusion model in the projection-backprojection step (6). In OS-EM we fixed the number of subsets at 16, and used a 3D-Gaussian post-reconstruction filter. We varied the filter width of the standard deviation of the Gaussian (σ) and the number of OS-EM iterations to achieve maximum defect-detection performance.
Our optimization strategy was as follows. We began at full dose to define a lower bound on noise smoothing and to narrow the parameter search space. For a given algorithm and dose level, we generated separate male/female QPS reference databases for the various parameter values under consideration. For FBP, the tested cutoff frequencies were [0.16, 0.18, 0.19, 0.2, 0.21, 0.22, 0.24, 0.3] cycles/pixel. For OS-EM, the Gaussian filter parameter values were [0.5, 0.8, 1, 1.2, 1.4, 2] voxels with 2, 4, 8, 12 or 16 iterations. For the reference databases we used 30 normal males and 30 normal females respectively. The clinical characteristics for the reference database population are shown in Table 1.
Table 1.
Clinical characteristics for population used for reference databases (n=60)
| Male reference (n=30) |
Female reference (n=30) |
|
|---|---|---|
| Body mass index (kg·m−2) | 30.39 ± 6.72 | 31.43 ± 6.64 |
| Age (years) | 57.83 ± 13.46 | 62.96 ± 13.38 |
The ROC-study test database for the optimization procedure contained the patient distribution specified in Table 2. We used 72 patients with random location and size of perfusion defects at the four contrast levels specified in previous sections, thus adding a total of 288 abnormal cases. We also used 58 normal patients plus the normal versions of the patients used to generate hybrid defects, for a total of 130 normal cases. It is important to note that, to avoid testing on training data, neither of these groups was based on the studies used for generation of the reference database. The clinical characteristics for the ROC study population are specified in Table 3.
Table 2.
Summary of the cases used in the ROC study.
| Number of patients | Contrast levels | Total cases | |
|---|---|---|---|
| Hybrid defect cases at 4 contrast levels | 72 | (65%, 50%, 35%, 20%) | 288 |
| Normal cases | 58 | - | 58 |
| Normal versions of hybrid studies | 72 | - | 72 |
Table 3.
Clinical characteristics of the population used in the ROC study
| Normal studies (n=58) |
Hybrid studies (n=72) |
|
|---|---|---|
| Female gender (% n) | 71.9% (41) | 66.66% (48) |
| Body mass index (kg·m−2). [Female] | 29.57 ± 4.87 | 28.73 ± 5.863 |
| Age (years). [Female] | 60.44 ± 12.17 | 64.29 ± 10.05 |
| Body mass index (kg·m−2). [Male] | 30.53 ± 5.25 | 29.91 ± 5.80 |
| Age (years). [Male] | 57.18 ± 11.99 | 53.87 ± 14.24 |
We computed the TPD score for all the studies in the test data set by using the corresponding QPS reference database for a given dose level, algorithm, parameter value, and gender. Thus, we obtained a distribution of normal and abnormal TPD scores for each of the tested combinations (algorithm, dose, parameter values, gender). Finally, we used the computed TPD scores to obtain the AUC for each combination of these choices and then we identified the parameters corresponding to the maximum AUC value for each dose level.
RESULTS
FBP optimization results
Figure 3 shows detection performance (AUC) versus cutoff frequency (smoothing) for FBP. Each curve in Figure 3 corresponds to a different dose level (100%, 50%, 25% and 12.5%) over the range of cutoff frequencies under optimization. The green circles in Figure 3 represent the optimum detection performance values for FBP at each dose level.
Figure 3.
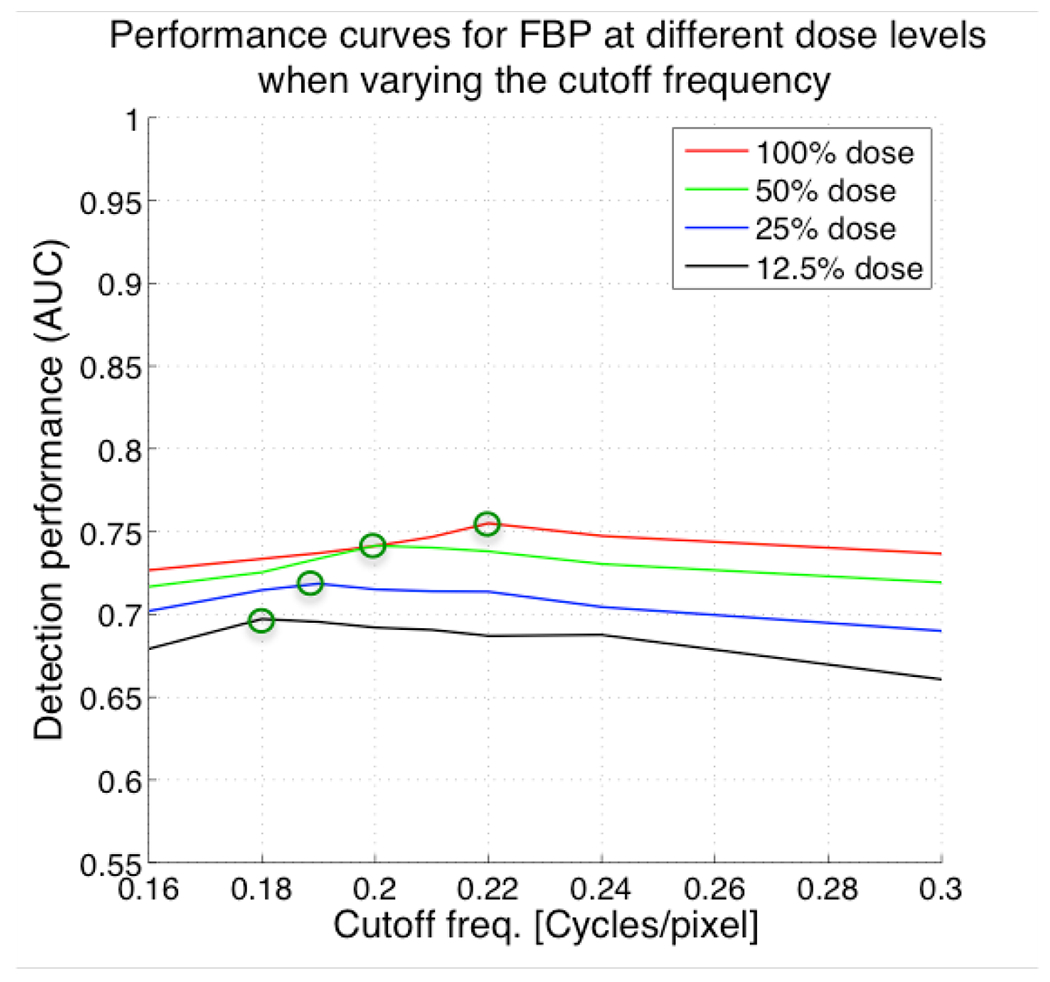
Plots of AUC versus cutoff frequency of 2D pre-reconstruction Butterworth filter used in controlling noise in filtered backprojection (FBP) for different dose levels. Lower cutoff frequencies result in smoother images. As expected, the optimal cutoff frequency is lower because the images become noisier requiring more spatial smoothing to achieve maximal detection accuracy for that dose level.
At the extreme values of cutoff frequencies, the detection performance decreased significantly, illustrating the importance of careful selection of this parameter. This can also be seen in the reconstructed images in Figure 4, which show how the image appearance varies with cutoff frequency (spatial smoothing).
Figure 4.
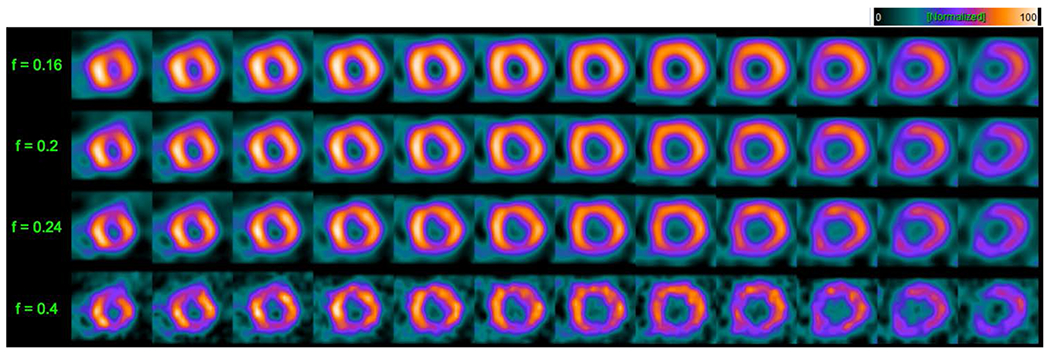
Short-axis slices at the 100% dose level for FBP reconstruction illustrating the impact of variation in cutoff frequency of the 2D pre-reconstruction Butterworth filter for a 49-year-old female patient with a BMI of 30 whose study was interpreted as normal. Cutoff frequency values are shown along the left of the figure. Notice the definite increase in noise and perfusion detail in the slices as the cutoff frequency increases, illustrating the need for optimization of this parameter before comparing AUC’s between dose levels and reconstruction strategies.
For the lesion distribution described in the previous section, the optimum values for the FBP cutoff frequency at 100%, 50%, 25% and 12.5% were 0.22, 0.2, 0.19 and 0.18, respectively. The AUC values at the optimum parameters were 0.75, 0.74, 0.72 and 0.70, respectively. As expected, the optimum cutoff frequency at reduced dose levels was lower than at the higher dose levels. That is, more smoothing is needed at reduced administered dose levels. We observed a decrease of detection performance when reducing the administered dose levels, even at the optimum parameters.
OS-EM optimization results: AC-SC-RC and SC-RC
The performance curves for ordered-subsets expectation-maximization (OS-EM) algorithm with attenuation, resolution and scatter correction (AC-SC-RC), and OS-EM with scatter and resolution correction only (SC-RC) are shown in Figures 5 and 6 respectively. Each of the four graphs in the two Figures represents the computed AUC values for a given dose level. In this case we varied both the number of OS-EM iterations and the post-reconstruction Gaussian filter parameter. Each curve represents the AUC values for a fixed number of OS-EM iterations, when varying the filter parameter (spatial smoothing). The green circles in Figure 5 show the optimum detection performance for ordered-subsets expectation-maximization (OS-EM) algorithm with attenuation, scatter and resolution correction (AC-SC-RC) at each dose level. Similarly, the green circles in Figure 6 show the optimum detection performances for OS-EM with SC-RC only.
Figure 5.
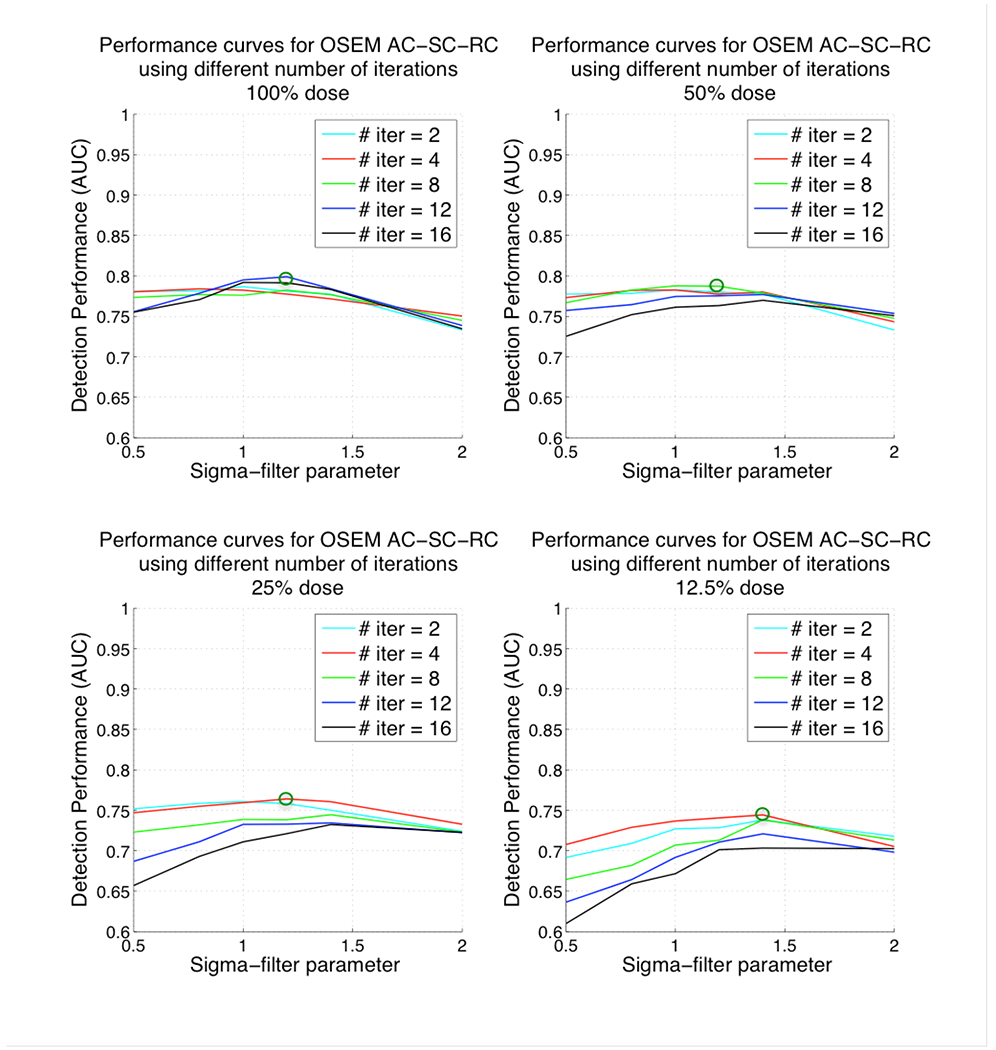
Plots of AUC versus 3D post-reconstruction Gaussian filter parameter and number of iterations for ordered-subsets expectation-maximization (OS-EM) algorithm with attenuation, scatter and resolution correction (AC-SC-RC) for different dose levels. Top-left corresponding to 100% administered dose, top-right 50% administered dose, bottom-left 25% administered dose and bottom-right 12.5% administered dose. Note that lower values for the filter parameter result in reconstructed images that are noisier (less smoothed) and higher values result in smoother images.
Figure 6.
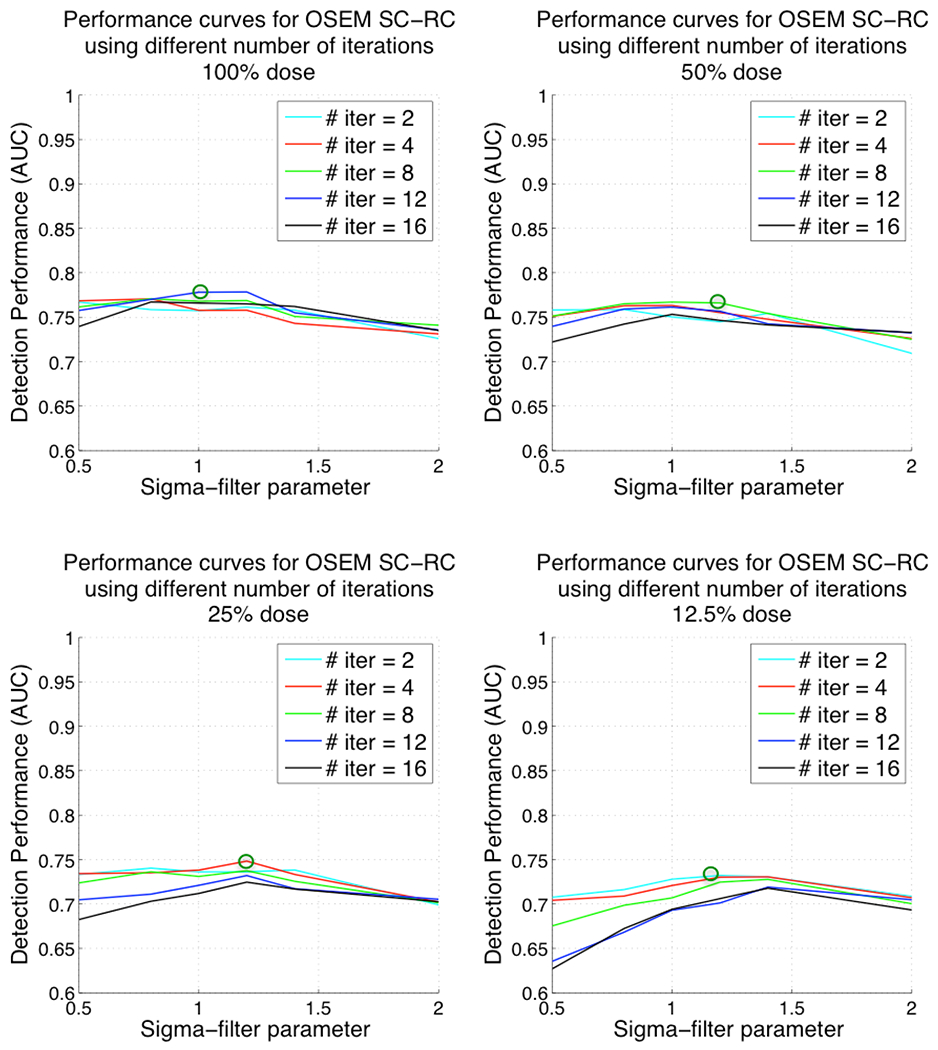
Plots of AUC versus 3D post-reconstruction Gaussian filter parameter and number of iterations for ordered-subsets expectation-maximization (OS-EM) algorithm with scatter and resolution correction (SC-RC) for different dose levels. Top-left corresponding to 100% administered dose, top-right 50% administered dose, bottom-left 25% administered dose and bottom-right 12.5% administered dose. Note that lower values for the filter parameter result in reconstructed images that are noisier (less smoothed) and higher values result in smoother images.
For both reconstruction strategies, at the extreme values for the filter parameters, the detection performance decreased significantly. Also, the number of iterations needed for better detection performance at low dose levels (i.e. 4 or 2 iterations at 12.5% dose) was smaller than the number of iterations needed at full dose levels (i.e. 12 iterations at 100%).
The optimum values for the OS-EM parameters [filter parameter, number of iterations] at 100%, 50%, 25% and 12.5% dose were [1.2, 12], [1.2, 8], [1.2, 4], [1.4, 4] respectively when using AC-SC-RC and [1, 12], [1.2, 8], [1.2, 4], [1.2, 2] when using SC-RC only. The AUC values at the optimum parameters were 0.81, 0.79, 0.76 and 0.74 for AC-SC-RC, and 0.78, 0.77, 0.74, 0.72 for SC-RC respectively. The optimum filter parameter was higher at reduced doses (more smoothing was required) than at higher dose levels. We observed a decrease of detection performance when reducing the administered dose, even at the optimum parameters.
Comparison between the three strategies: FBP, OS-EM SC-RC and OS-EM AC-SC-RC
Figure 7 presents a comparison between the optimum detection performance levels of OS-EM with AC-SC-RC, OS-EM with SC-RC and FBP at each dose level. In Figure 7 the black curve represents the optimum detection performance as a function of dose reduction for OS-EM with AC-SC-RC, the blue curve represents the performance for OS-EM with SC-RC and the red curve shows the performance for FBP.
Figure 7.
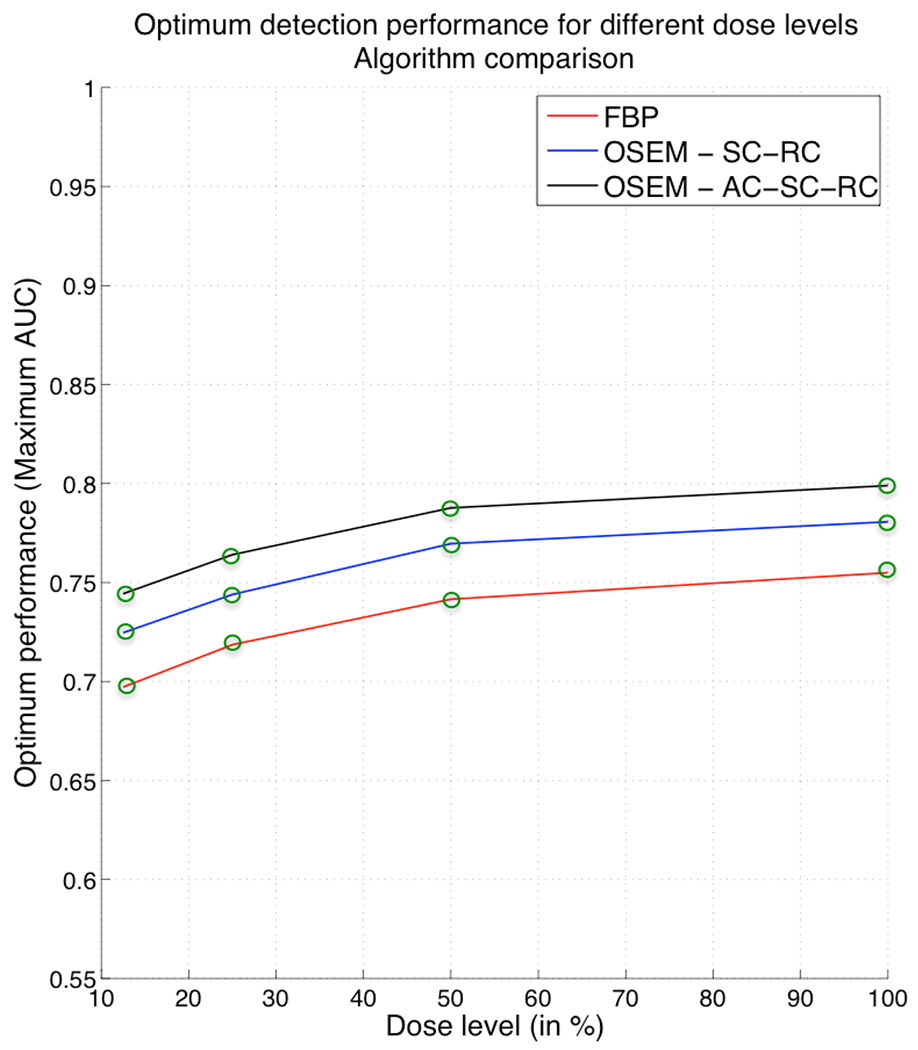
Comparison between optimum detection performance for different administered dose levels for FBP, OS-EM with SC-RC and OS-EM with AC-SC-RC.
At all dose levels, OS-EM with any of the correction strategies (AC-SC-RC or SC-RC) produced better detection performance than FBP, with an advantage occurring particularly for low-contrast lesions. Thanks to the improvements produced by the combination of three corrections, OS-EM with AC-SC-RC achieved the same detection performance at 25% of administered dose that FBP at full clinical dose (100%). Therefore, by using OS-EM with AC, SC, and RC we could achieve a reduction of the administered dose level down to 25% without sacrificing the diagnostic accuracy, as compared to full dose FBP. Without the inclusion of AC, the OS-EM performance is slightly reduced. However, we can see that OS-EM with SC-RC achieves the same performance at around 40% of administered dose that FBP at full clinical dose (100%). Therefore, without the inclusion of AC we still can achieve a reduction of administered dose level down to approximately 40%.
Figures 1 and 2 show examples of short-axis images for FBP and OS-EM with AC-SC-RC. In Figures 1 and 2, panel A shows several short-axis images of the same patient with a large LAD defect at different contrast levels, reconstructed with the optimum parameter value for FBP at 100% dose (0.22). Panel B in each figure depicts the same short-axis images but at 12.5% dose, and reconstructed with the optimum value obtained after the optimization at that dose level. One can see in both cases that the parameter setting must be optimized in order to maintain image quality that is as close as possible to that achieved at 100% dose.
DISCUSSION
To our knowledge this is the first study that systematically probes the extent to which radiation dose reduction in cardiac SPECT-MPI can be reduced through optimization of the reconstruction algorithm. We considered three reconstruction strategies: FBP, OS-EM with AC-SC-RC and OS-EM with SC-RC. Our results define the optimal parameter settings and a corresponding set of recommendations for the administered activity in clinical cardiac imaging for these three strategies.
Although we did not apply commercially available reconstruction software in this manuscript, the software we did apply shares a common theoretical foundation with algorithms employed by manufacturers. Thus despite implementational details between our software and that of a given manufacturer we believe the findings of this study provide qualitative indications of relative rankings of the different reconstruction strategies what would be applicable to clinical study comparisons performed by physician readers, as a comparison to the study of Narayanan et al (6).
Because multiple dose levels, algorithms and parameter value combinations had to be tested in our optimization procedure, the total number of TPD quantifications performed was very large (around 65,000). Such an extensive study would not be possible by visual physician scoring
For all reconstruction strategies, high and low values of the reconstruction parameters led to significant decreases in detection performance, emphasizing that optimization of these is essential to achieve maximum dose reduction.
The inclusion of attenuation correction (AC) along with scatter and resolution correction (SC-RC) for OS-EM increased the detection performance compared to that of OS-EM with SC-RC alone. Thus, achieving lower dose levels without sacrificing diagnostic accuracy. We believe that these results in conjunction with the ones obtained in our previous study (6), where we showed the comparison of OS-EM using different correction combinations, summarize how the attenuation correction, scatter correction and resolution correction can contribute to the superiority of the OS-EM technique when compared to FBP.
This study has some limitations. Defects with different contrast levels simulated in one patient scan were considered in the ROC study as if they were different patients. By using different contrast levels for a given patient, we were able to increase the number of cases for the ROC study and, thus, reduce the variance of the AUC curves. However, this approach perhaps did not fully capture the biological and clinical variability that would be seen in a similar number of fully independent patient studies. We are in the process of acquiring a large number of studies so that we will be able to observe greater variation in defect contrast without repetition.
Finally, it is important to note that our results are based on a two-headed system (90°) Philips Brightview cone beam XCT. We are aware of the existence of other means of achieving dose reduction, such as high-sensitivity, dedicated, cardiac-SPECT systems that achieve similar reduction levels (26, 27). However, we anticipate that the optimization approaches described in this paper could be applied to those systems as well, and would likely result in even further reductions in dose without sacrificing diagnostic accuracy.
CONCLUSIONS
When reducing the administered tracer dose, the detection performance for all reconstruction strategies studied herein progressively decreases, but this decrease is modest down to 25% of the full dose. OS-EM reconstruction with appropriate corrections achieved higher detection performance than FBP at all dose levels, thus showing the benefits of iterative reconstruction with accounting for physical image-degradation effects.
Finally, we determined that, on average, our hybrid studies reconstructed by OS-EM could be reduced down to 25% with AC-SC-RC and ~40% with SC-RC only of the original administered dose without the diagnostic accuracy (AUC) dropping below that achieved by FBP with 100% dose. Our study indicates that dose reduction by optimization of the image reconstruction algorithm and its parameters could yield a significant reduction in radiation exposure for patients.
NEW KNOWLEDGE GAINED.
Our paper provides a comprehensive study of perfusion-defect detection accuracy as a function of administered SPECT MPI activity and parameter settings for three reconstruction methods (FBP with no correction for degradations, OSEM with AC-SC-RC, and OSEM with SC-RC). By focusing on inexpensive software solutions, this study has shown the reductions in administered activity that can be achieved by optimizing these algorithms, with the reductions in activity having a potentially significant impact on radiation absorbed dose to the US population.
Acknowledgements
This work was supported by the National Institutes of Health (NIH) Grant No. R01-HL122484. P.S. was also supported by the National Institutes of Health (NIH) Grant No. R01-HL089765. The contents are solely the responsibility of the authors and do not necessarily represent the official views of the National Institutes of Health.
Abbreviations:
- SPECT
Single-photon emission computed tomography
- MPI
Myocardial perfusion imaging
- FBP
Filtered-backprojection
- OS-EM
Ordered-subsets expectation-maximization
- AC
Attenuation correction
- SC
Scatter correction
- RC
Resolution correction
- AUC
Area under the ROC curve
- TPD
Total perfusion deficit
- CAD
Coronary-artery disease
Footnotes
A preliminary version of this work was presented in part at the IEEE Medical Imaging Conference, Strasbourg, 2016, and published in the conference proceedings (28).
Disclosure
The University of Massachusetts had a research agreement with Philips Healthcare at the time some of this work was performed.
Contributor Information
Albert Juan Ramon, Illinois Institute of Technology, Medical Imaging Research Center, Chicago, IL.
Yongyi Yang, Illinois Institute of Technology, Medical Imaging Research Center, Chicago, IL.
P. Hendrik Pretorius, University of Massachusetts Medical School, Dept. of Radiology, Worcester, MA.
Piotr J. Slomka, Dept. of Medicine, Cedars-Sinai Medical Center, Los Angeles, CA.
Karen L. Johnson, University of Massachusetts Medical School, Dept. of Radiology, Worcester, MA
Michael A King, University of Massachusetts Medical School, Dept. of Radiology, Worcester, MA.
Miles N. Wernick, Illinois Institute of Technology, Medical Imaging Research Center, Chicago, IL.
References
- 1.Bourque JM, Beller GA. Stress myocardial perfusion imaging for assessing prognosis: an update. JACC: Cardiovascular Imaging 2011;4:1305–19. [DOI] [PubMed] [Google Scholar]
- 2.Stratmann HG, Williams GA, Wittry MD, Chaitman BR, Miller DD. Exercise technetium-99m sestamibi tomography for cardiac risk stratification of patients with stable chest pain. Circulation 1994;89:615–22. [DOI] [PubMed] [Google Scholar]
- 3.Einstein AJ, Pascual TN, Mercuri M, Karthikeyan G, Vitola JV, Mahmarian JJ et al. Current worldwide nuclear cardiology practices and radiation exposure: results from the 65 country IAEA Nuclear Cardiology Protocols Cross-Sectional Study (INCAPS). European heart journal 2015;36:1689–96. [DOI] [PMC free article] [PubMed] [Google Scholar]
- 4.Jerome SD, Tilkemeier PL, Farrell MB, Shaw LJ. Nationwide laboratory adherence to myocardial perfusion imaging radiation dose reduction practices. JACC: Cardiovascular Imaging 2015;8:1170–6. [DOI] [PubMed] [Google Scholar]
- 5.Administration UFaD. Initiative to reduce unnecessary radiation exposure from medical imaging. US Food and Drug Administration; 2010;9. [Google Scholar]
- 6.Narayanan MV, King MA, Pretorius PH, Dahlberg ST, Spencer F, Simon E et al. Human-observer receiver-operating-characteristic evaluation of attenuation, scatter, and resolution compensation strategies for 99mTc myocardial perfusion imaging. Journal of Nuclear Medicine 2003;44:1725–34. [PubMed] [Google Scholar]
- 7.Zafrir N, Solodky A, Ben-Shlomo A, Mats I, Nevzorov R, Battler A et al. Feasibility of myocardial perfusion imaging with half the radiation dose using ordered-subset expectation maximization with resolution recovery software. Journal of Nuclear Cardiology 2012;19:704–12. [DOI] [PubMed] [Google Scholar]
- 8.Zoccarato O, Scabbio C, De Ponti E, Matheoud R, Leva L, Morzenti S et al. Comparative analysis of iterative reconstruction algorithms with resolution recovery for cardiac SPECT studies. A multi-center phantom study. Journal of Nuclear Cardiology 2014;21:135–48. [DOI] [PubMed] [Google Scholar]
- 9.Borges-Neto S, Pagnanelli RA, Shaw LK, Honeycutt E, Shwartz SC, Adams GL et al. Clinical results of a novel wide beam reconstruction method for shortening scan time of Tc-99m cardiac SPECT perfusion studies. Journal of nuclear cardiology 2007;14:555–65. [DOI] [PubMed] [Google Scholar]
- 10.Ali I, Ruddy TD, Almgrahi A, Anstett FG, Wells RG. Half-time SPECT myocardial perfusion imaging with attenuation correction. Journal of Nuclear Medicine 2009;50:554–62. [DOI] [PubMed] [Google Scholar]
- 11.Bateman TM, Heller GV, McGhie AI, Courter SA, Golub RA, Case JA et al. Multicenter investigation comparing a highly efficient half-time stress-only attenuation correction approach against standard rest-stress Tc-99m SPECT imaging. Journal of nuclear cardiology 2009;16:726–35. [DOI] [PubMed] [Google Scholar]
- 12.DePuey EG, Bommireddipalli S, Clark J, Thompson L, Srour Y. Wide beam reconstruction “quarter-time” gated myocardial perfusion SPECT functional imaging: a comparison to “full-time” ordered subset expectation maximum. Journal of nuclear cardiology 2009;16:736–52. [DOI] [PubMed] [Google Scholar]
- 13.Modi B, Brown J, Kumar G, Driver R, Kelion A, Peters A et al. A qualitative and quantitative assessment of the impact of three processing algorithms with halving of study count statistics in myocardial perfusion imaging: filtered backprojection, maximal likelihood expectation maximisation and ordered subset expectation maximisation with resolution recovery. Journal of Nuclear Cardiology 2012;19:945–57. [DOI] [PubMed] [Google Scholar]
- 14.He X, Links JM, Frey EC. An investigation of the trade-off between the count level and image quality in myocardial perfusion SPECT using simulated images: the effects of statistical noise and object variability on defect detectability. Physics in medicine and biology 2010;55:4949. [DOI] [PMC free article] [PubMed] [Google Scholar]
- 15.Slomka PJ, Nishina H, Berman DS, Akincioglu C, Abidov A, Friedman JD et al. Automated quantification of myocardial perfusion SPECT using simplified normal limits. Journal of nuclear cardiology 2005;12:66–77. [DOI] [PubMed] [Google Scholar]
- 16.Sowards-Emmerd D, Balakrishnan K, Wiener J, Shao L, Ye J. CBCT-subsystem performance of the multi-modality Brightview XCT system (M09-26). Nuclear Science Symposium Conference Record (NSS/MIC), 2009 IEEE; 2009. p. 3053–8. [Google Scholar]
- 17.Bai C, Shao L, Da Silva AJ, Zhao Z. A generalized model for the conversion from CT numbers to linear attenuation coefficients. IEEE Transactions on Nuclear Science 2003;50:1510–5. [Google Scholar]
- 18.Könik A, Kikut J, Lew R, Johnson K, King MA. Comparison of methods of acquiring attenuation maps for cardiac SPECT in the presence of respiratory motion. Journal of Nuclear Cardiology 2013;20:1093–107. [DOI] [PMC free article] [PubMed] [Google Scholar]
- 19.Svane B Polar presentation of coronary angiography and Thallium-201 single photon emission computed tomography. Stockholm, Sweden; 1990. [PubMed] [Google Scholar]
- 20.Pretorius PH, King MA, Johnson K, Yang Y, Wernick MN. Introducing polar map defined defects into normal cardiac perfusion SPECT slices using 3D respiratory and rigid-body motion projection. Proceedings of the 13th International Meeting on Fully Three-Dimensional Image Reconstruction in Radiology and Nuclear Medicine; Accepted, 2015 [Google Scholar]
- 21.Narayanan MV, King MA, Leppo J, Dahlbert S, Pretorius PH, Gifford HC. Optimization of regularization of attenuation and scatter-corrected 99m Tc cardiac SPECT studies for defect detection using hybrid images. IEEE Transactions on Nuclear Science 2001;48:785–9. [Google Scholar]
- 22.Jin M, Niu X, Qi W, Yang Y, Dey J, King MA et al. 4D reconstruction for low-dose cardiac gated SPECT. Medical physics 2013;40. [DOI] [PMC free article] [PubMed] [Google Scholar]
- 23.Arsanjani R, Xu Y, Hayes SW, Fish M, Lemley M, Gerlach J et al. Comparison of fully automated computer analysis and visual scoring for detection of coronary artery disease from myocardial perfusion SPECT in a large population. Journal of Nuclear Medicine 2013;54:221–8. [DOI] [PMC free article] [PubMed] [Google Scholar]
- 24.Metz C, Lorenzo LP, Papaioannu J. ROC-kit software. http://metz-roc.uchicago.edu/MetzROC/software; 2011.
- 25.Ogawa K, Harata Y, Ichihara T, Kubo A, Hashimoto S. A practical method for position-dependent Compton-scatter correction in single photon emission CT. IEEE transactions on medical imaging 1991;10:408–12. [DOI] [PubMed] [Google Scholar]
- 26.Slomka PJ, Patton JA, Berman DS, Germano G. Advances in technical aspects of myocardial perfusion SPECT imaging. Journal of nuclear cardiology 2009;16:255–76. [DOI] [PubMed] [Google Scholar]
- 27.DePuey EG, Mahmarian JJ, Miller TD, Einstein AJ, Hansen CL, Holly TA et al. Patient-centered imaging. Journal of nuclear cardiology 2012;19:185–215. [DOI] [PubMed] [Google Scholar]
- 28.Juan Ramon A, Yang Y, Pretorius H, Slomka P, King M, Wernick MN. Dose optimization of SPECT-MPI reconstruction algorithms for perfusion-defect detection. Nuclear Science Symposium Conference Record (NSS/MIC); Accepted, 2016. [Google Scholar]


