

Abstract
Mutations in MECP2 gene have been identified in more than 95% of patients with classic Rett syndrome, one of the most common neurodevelopmental disorders in females. Taking advantage of the breakthrough technology of genetic reprogramming, we investigated transcriptome changes in neurons differentiated from induced Pluripotent Stem Cells (iPSCs) derived from patients with different mutations. Profiling by RNA-seq in terminally differentiated neurons revealed a prominent GABAergic circuit disruption along with a perturbation of cytoskeleton dynamics. In particular, in mutated neurons we identified a significant decrease of acetylated α-tubulin which can be reverted by treatment with selective inhibitors of HDAC6, the main α-tubulin deacetylase. These findings contribute to shed light on Rett pathogenic mechanisms and provide hints for the treatment of Rett-associated epileptic behavior as well as for the definition of new therapeutic strategies for Rett syndrome.
Keywords: iPSC-derived neurons, RNA-seq, GABA, HDAC6, acetylated α-tubulin, HDAC6 inhibitors
Introduction
Rett syndrome (RTT; OMIM# 312750) is a severe neurodevelopmental disorder and one of the most common genetic causes of intellectual disability in girls with an estimated prevalence of about 1:10.000 [1, 2]. The key feature of the classic form is regression, especially in the areas of language and motor abilities. Rett girls present an apparent normal development for the first 6–18 months of life, after which ability to speak and purposeful hand movements are lost, together with a reduction in interpersonal contact and the appearance of autistic behavior. Typical features include involuntary movements with the classic ‘hand-washing’ stereotypic activities, electroencephalogram abnormalities, postnatal microcephaly and inability to speak and walk. Over the years, other somatic and neurologic handicaps become evident and patients finally develop further somatic and neurologic deterioration resulting in end-stage spastic quadriparesis [3]. Pathogenic mutations in the X–linked Methyl–CpG-binding Protein 2 (MECP2, Xq28) gene have been identified in the majority of classic RTT and in a small percentage of variant patients [1, 2]. According to the Rett Database Network, the most frequent mutation is p.Thr158Met followed by stop codon mutations in 255, 168 and 270 and p.Arg306Cys missense change (https://www.rettdatabasenetwork.org) [4]. MeCP2 has been originally identified as a factor that interacts with DNA in the context of CpG islands and works as transcriptional repressor through the modulation of chromatin structure [5–8]. It has been recently shown that transcriptional repression by MeCP2 is preferentially targeted to long genes through interaction with methylated CpA dinucleotides in vitro and in the mouse brain [9, 10]. Recent data indicate that a higher number of genes is down-regulated rather than up-regulated in the absence of MeCP2, suggesting a bimodal role as transcriptional activator or repressor depending upon binding at different loci [11].
Despite the growing amount of knowledge on MeCP2 function, the patho-mechanisms of RTT are still unknown leading to a consequent lack of effective therapeutic targets. For these reasons, at present, no cure or disease-modifying therapy is available and patients’ management is mainly symptomatic. Mice or other animal models are available; however, the potential differences in the underlying biology between humans and mice and the complexity of neurodevelopmental and neurodegenerative diseases makes the current animal models insufficient and possibly misleading to study disease mechanisms [12]. With the advent of the genetic reprogramming approach able to generate induced Pluripotent Stem Cells (iPSCs) from human fibroblasts [13], it has become feasible to model disease and test therapeutic strategies in human cells by deriving patient-specific iPSCs. iPSCs are similar to human Embryonic Stem Cells (hESCs) and can be differentiated in vitro into different cell types, including neurons, allowing to obtain an unlimited number of affected human neurons harboring the disease-causing mutation in a patient genetic background. Previous studies have indeed shown that iPSC-derived neurons closely resemble human fetal brain [14–16] and a recent study has confirmed that even at the level of individual cells there is a marked transcriptome similarity to human fetal neurons [17].
We have previously demonstrated that it is possible to establish iPSCs from MECP2-mutated patients and to identify relevant molecular alterations in derived neurons [18–20], confirming the applicability of iPSCs technology to model RTT in vitro [21–23] and providing a useful tool which closely mimics patients early brain development. Neurons derived from MECP2-iPSCs have fewer synapses, reduced spine density, smaller soma size, as well as altered calcium signaling when compared to controls, a phenotype consistent with that observed in mouse models and patients’ post-mortem brain tissue [21].
To shed light on the molecular signature of RTT patients’ neurons underlying the phenotypic changes, we performed transcriptome profiling of iPSC-derived MECP2-mutated neurons. Our findings strongly support GABAergic neurons impairment in Rett pathogenesis. Moreover, we show an alteration of Histone Deacetylase 6 (HDAC6) in RTT neurons and demonstrate that selective inhibitors can correct the abnormal reduction in acetylated α-tubulin resulting from HDAC6 overexpression. Notably, these findings provide a real possibility of an efficacious treatment for RTT with either repurposed drugs or newly developed compounds specifically targeting the identified altered pathways.
Materials and Methods
iPSCs and iPSC-derived neurons
Fibroblasts from a female patient attending the Medical Genetics Unit in Siena and harboring a p.Thr158Met mutation on the MECP2 gene were used to derive and characterize three iPSC clones: two expressing the mutated (2271#1 = P0; 2271#22 = P1) and one expressing the normal MECP2 allele (2271#2 = C1) due to X-chromosome inactivation. The latter was used as partial isogenic control being autosomal and pseudoautosomal gene expression identical. An iPSC line from a second MECP2-mutated female patient (p.Arg306Cys) was obtained from James Ellis (University of Toronto) (clone R306C = P2) [24]. As a second control we used an available iPSC clone derived from a healthy newborn male (BJ = C0), commonly used as control in autism spectrum disorders [23]. A third control iPSC derived from a healthy female child (01–04 = C2) was used during the validation process. All iPSC lines were derived using the Yamanaka’s retroviral approach [13] and characterized according to standard criteria [15, 18, 25]. Neurons were differentiated from mutated and control iPSC lines as previously reported [20]. Isolation of neurons for quantitative analyses was performed by immuno-magnetic sorting using anti-CD24 antibodies [19].
Immunofluorescence and RNAseq analysis on control clones confirmed that the cells differentiate as expected giving rise mainly to glutamatergic neurons with a smaller proportion of GABAergic neurons (Fig. S1). Indeed, RNAseq analysis showed that terminally differentiated neurons express different cortical layer markers, indicative of both upper layers (II, III, IV) differentiation, such as CUX1 and KITLG, and lower layer differentiation, namely TLE4, FOXP2 and ETV1 (Fig. S1b). A lower expression for other layer-specific markers was also observed (OPN3, UNC5D, NEFH and RELN) (Fig. S1b) [26]. The majority of neurons obtained with our differentiation protocol is expected to be glutamatergic. Accordingly, we detected a high expression of the glutamatergic vesicular transporter SLC17A6 (VGLUT2) and GRIA1 and GRIA3 AMPA receptor subunits (Fig. S1b), and highly variable levels of other AMPA receptor subunits (GRIA2, GRIA4). The NMDA (GRIN1, GRIN2A, GRIN2B, GRIN2D, GRIN3A) and Kainate subunit genes (GRIK1, GRIK3 and GRIK5) were also present (Fig. S1b). GABAergic neurons assemble functional GABAA pentameric receptors composed by 2 Alpha, 2 Beta and 1 Gamma subunit. Subunits expression in our cells supports the presence of GABAA receptors composed by alpha2/3, beta2/3 and gamma3 subunits (Fig. S1b). In addition, both subunits of GABAB receptors, GABAB1 and GABAB2, are expressed, although at very different levels (Fig. S1b). The cells also expressed GAD1 and SLC31A1 (Fig. S1b). In contrast with markers for glutamatergic and GABAergic neurons, markers of other neuronal subtypes are scarcely represented, with only TH, the rate-limiting enzyme in Dopamine biosynthesis, DRD2 and DRD4 Dopamine receptors and HTR2C and HTR7P1 Serotonin receptors displaying appreciable expression (FPKM≥1), although with high inter-sample variability (Fig. S1b).
RNA-seq sampling
RNA-seq analysis was performed on iPSC-derived terminally differentiated neurons. Three clones from two different MECP2 mutated patients (P0-P2, the two independent clones from the p.Thr158Met patient and one clone from the p.Arg306Cys mutated patient) and 2 control iPSC clones (C0 and C1, the male control and the female partial isogenic clone derived from the p.Thr158Met mutated patient but expressing the normal allele) were used.
RNA isolation and library preparation.
Total RNA was extracted using the Nucleospin RNA kit (Machery-Nagel). The ribodepletion was performed using “RiboMinus™ Eukaryote Kit v2” (ThermoFisher Scientific), according to manufacturer’s instructions. After ribodepletion, retrotranscription and library preparation were performed using “Ion Total RNA-Seq Kit v2” (ThermoFisher Scientific), following manufacturer’s protocol. Libraries were run in duplex on the Ion proton Torrent system.
Mapping and data analysis.
RNA-seq reads were trimmed of any adapter sequences with the Cutadapt-Toolkit (version 1.10) [27], and then aligned to the GRCh38/hg38 reference genome using Tophat [28] with novel splice discovery disabled. An average of 4×10⁷ mapped reads per sample of total RNAs were obtained. For some of the downstream analyses, Samtools (version 0.1.19) was used to remove reads with multiple mapping locations from the aligned files. Reads per exon were grouped, from which FPKM (Fragments Per Kilobase per Million mapped reads) [29] values were calculated using Cufflinks [30]. Only genes with FPKM >1 were included in further analyses. This normalized value was used for visualization on a genome browser (http://genome.ucsc.edu/) [31], as well as to compare read coverage between and throughout different genes. Cuffdiff tool from Cufflinks was used to identify differentially expressed genes [32], comparing the log ratio of a gene’s expression in mutation bearing samples against that of controls. Significantly affected genes were considered those with a Fold Change (FC)≥ 2 and a p-value ≤0.05. To identify relevant altered pathways, GO analysis was performed with DAVID software with an FDR (false discovery rate) of 0.05 using the Benjamini- Hochberg correction for multiple-testing.
Real-time qRT-PCR
One μg of total RNA was reverse transcribed with the QuantiTect Reverse transcription kit (Qiagen) according to manufacturer’s instructions. Quantitative PCR was carried out in singleplex reactions in a 96-well optical plate with FastStart SYBR Green Master Mix (Roche) on an ABI Prism 7700 Sequence Detection System (Applied Biosystems). Experiments were performed in triplicate in a final volume of 20 uL with 25–100 ng of cDNA and 150nM of each primer, following the SYBR Green protocol. Standard thermal cycling conditions were employed (Applied Biosystems): 2 minutes at 50 °C and 10 minutes at 95 °C followed by 40 cycles at 95 °C for 15 s and 60 °C for 1 min. Results were analyzed using the comparative Ct method. GraphPad software was employed for statistical analysis. Unpaired Student’s t-test with a significance level of 95% was used for the identification of statistically significant differences in expression levels.
To establish the reliability of RNA-seq expression data, we compared expression levels established by RNA-seq and real time qRT-PCR for a set of randomly selected genes in one control and one MECP2-mutated clone. To this aim, the Log2 values of FC from RNA-seq data were plotted against the Log2 values of FC derived from qRT-PCR (Fig. S2).
Western Blot
Proteins from iPSC-derived neurons were extracted with RIPA buffer (Tris-HCl 50 mM, Triton X-100 1%, SDS 0.1%, NaCl 150 mM, EDTA 5 mM, pH 7.4, DTT 1 mM, PMSF 1 mM, Na-Fluoride 10 mM and Na-orthovanadate 1 mM) supplemented with 1X Protease inhibitors cocktail (SIGMA). Protein concentration was measured with Bradford Assay (BioRad). A total of 25 μg of protein was used in each lane for immunoblotting. Immunosignals were detected by autoradiography using multiple exposures to ensure that signals were in the linear range. Signals were quantified through densitometry using ImageJ. The following antibodies were employed for analysis: anti-GAD67 (GAD1) (Millipore, #MAB5406); anti-GABRA1 (Neuromab, #N95/35); anti-α-Tubulin (SIGMA, #T9026); anti-Acetylated-Tubulin (SIGMA, # T7451) and anti-GAPDH (Millipore, #AB2302).
Electrophysiology
Control and MECP2-mutated neurons at day 60 of terminal differentiation were transferred to the recording chamber and superfused with oxygenated ACSF containing 126mM NaCl, 2.5mM KCl, 1mM MgCl2, 2mM CaCl2, 1.2mM NaH2PO4, 15mM NaHCO3, 10mM HEPES and 10mM Glucose, pH 7.4. Somatic whole-cell recordings were obtained from cells visualized under a phase contrast microscope. Intracellular solution contained 130mM KCl, 10mM K-Gluconate, 10mM KCl, 10mM Hepes, 1mM EGTA, 0.3mM CaCl2, 1mM MgCl2, 4mM MgATP, 0.3mM NaGTP, pH 7.3. Cells were voltage-clamped at −80 mV, and IPSCs were isolated by 10 μM DNQX. 20μM bicuculline was used to block GABA receptors after the experiment, to confirm the GABAergic nature of the recorded synaptic currents. Glass pipette electrodes (4 to 6 MΩ resistance) were pulled from borosilicate capillaries (World Precision Instruments) by using a Sutter P97 Flame Brown Puller (Sutter Instruments). Data acquisition was performed with Clampex 8.2 and analyses were conducted by using Clampfit 10.3 (Molecular Devices). Currents were acquired by a Multiclamp 700A computer-controlled amplifier (Molecular Devices) at 10 kHz and low-pass filtered at 2 kHz. To assess neuronal excitability spiking activity was recorded in current-clamp mode using a depolarizing step protocol. In order to compensate for variations in the membrane resistance (Rm) on the input-output curve, the amplitude of the injected current was calculated as a function of Rm using the Ohm law (I= V/Rm). The calculated injected current produced a shift of 10 mV in the membrane potential compared to the previous step, starting at a resting potential of −70 mV. The lenght of the step was of 250 ms; immature spikes were included only when they were clearly distinguishble and reached a maximum depolarization of at least −20 mV.
Drug treatment
To inhibit HDAC6 activity, control and mutated neurons were treated with different concentrations of either compound #1 or ACY-1215 dissolved in sterile water with 1% DMSO at day 26 and 29 of terminal differentiation (Fig. 4b). To exclude nonspecific effects, two control and two mutated clones were treated in parallel with vehicle only (sterile water with 1% DMSO) and no difference was observed compared to untreated neurons (not shown). At day 30, neurons were isolated as described above to obtain proteins for Western blot analysis.
Fig. 4. Reduction in acetylated α-tubulin levels and treatment with selective HDAC6 inhibitors.
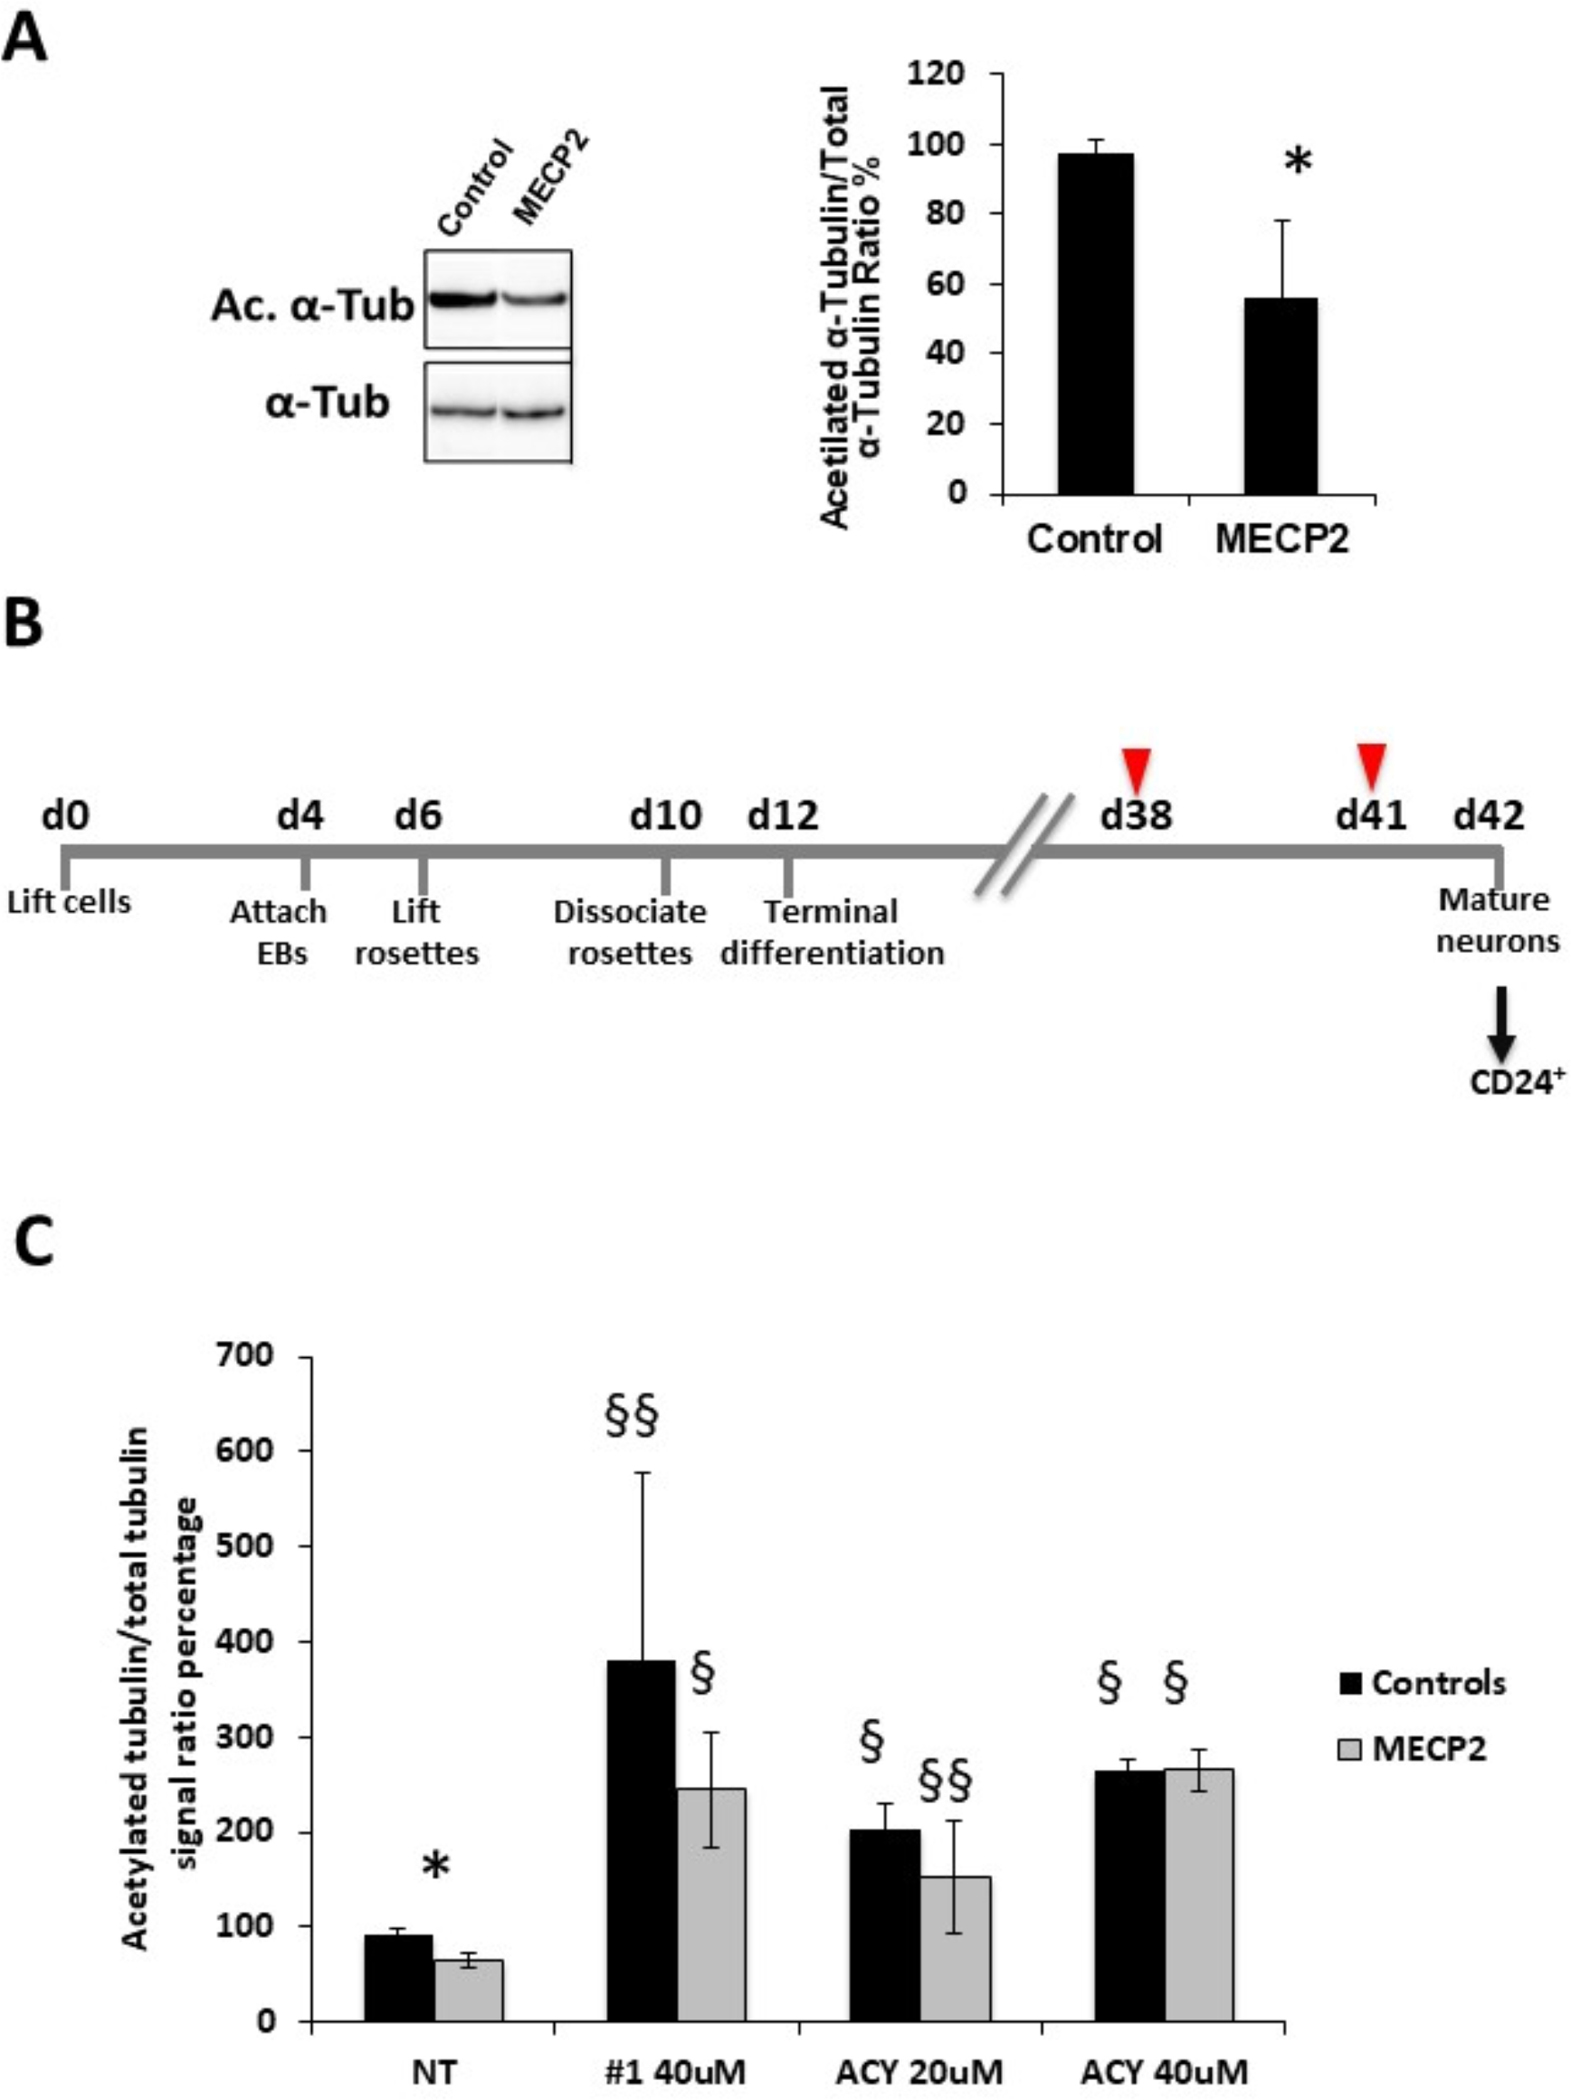
a) A reduction in acetylated α-tubulin levels was observed by Western Blot analysis in MECP2-derived neurons (n=3 clones) compared to control ones (n=2 clones). * p<0.05. b) Overview of the neuronal differentiation protocol with critical time-points indicated below the time lane. Cells were differentiated in Terminal Differentiation medium for 30 days; differentiating cells were treated twice (arrowheads) with either the selective inhibitor (Compound #1 or ACY1215) or vehicle and then neurons were isolated (arrow) by immunomagnetic sorting with anti-CD24 antibodies for further analyses. c) Treatment with compound #1 (40uM) or ACY-1215 (ACY 20uM or ACY 40uM) resulted in a significant increase in acetylated α-tubulin levels in both MECP2-mutated and control neurons. Data are expressed as the mean ± SEM from 3 independent experiments performed on 3 control and 3 MECP2-mutated clones. *p<0.05 between mutated and control neurons; §p<0.0001 and §§p<0.005 compared to the corresponding untreated neurons. Statistical significance was determined using unpaired student’s t test.
Immunofluorescence
Cells were fixed with 4% PFA in 1X PBS for 10 min, rinsed 3×5 min in PBS and permeabilized with Triton-X100 0.1% for 15 min, blocked for 2 hr in Blocking Solution (2% Fetal calf serum, 2% BSA, 0.2% Fish skin gelatin and 1X PBS), and incubated for one hour at room temperature, with the following antibodies: Anti-OCT4 (Abcam, #ab19857); Anti-TRA-1–60 (Abcam, #ab16288); anti-SOX1 (R&D Systems, #AF3369), anti-Nestin (Millipore, #MAB5326), anti-VGLUT1 (Synaptic Systems, #135303), anti-TuJ1 (Millipore, #MAB1637). Cells were then washed 3×5 min in PBS-T (1X PBS with 0.1% Tween-20) and incubated for 1 hr with Alexa Fluor 568 goat anti-mouse IgG or Alexa Fluor 488 goat anti-rabbit IgG secondary antibody (Invitrogen). Nuclei were counterstained with DAPI. Slides were rinsed 3×5 min in PBS-T and mounted with Mowiol (DABCO). Images were acquired on an Axioscop 40FL Microscope (ZEISS).
Results
RNA-seq analysis
RNA-seq analysis on neurons differentiated from three clones from 2 different MECP2 mutated patients and 2 control iPSC clones revealed that about 17,000 transcripts are significantly expressed (FPKM≥1) both in controls and MECP2-mutated samples. The distribution of reads corresponding to coding sequences (CDS), 5’UTRs, 3’UTRs, introns and intergenic regions did not show a statistically significant difference between control and mutated samples. Differentially expressed genes were identified comparing the log ratio of gene’s expression (FPKM value) in mutation bearing samples against that of controls. We identified about 900 deregulated genes, with the proportion of down-regulated genes being almost double the amount of up-regulated transcripts (Fig. 1; Table S1). A direct or indirect effect of MeCP2 on the expression level for some of the identified deregulated genes (BDNF, RELN, TNR, NEFL, NRXN1, NRXN3, ID1-3 and EGR2) (Table S1) has been previously reported, confirming the reliability of our disease model [10, 33–36].
Fig. 1. RNAseq data analysis.

a) Scatter plot of log2 transformed RNAseq expression level (FPKM) of MECP2-derived cells (P0, P1, P2) versus controls (C0, C1) in terminally differentiated neurons (day 30 is) shown. Red and green spots indicate significantly (p<0.05) up-regulated and down-regulated genes, respectively.
To clarify MECP2 function in directly regulating the identified altered genes, given its role as transcriptional regulator, we investigated a possible action through binding at the promoter regions. Thus, we interrogated published MeCP2-ChIP-chip data. Among the 937 genes deregulated in our dataset, 38 genes were reported by Yasui and colleagues to be modulated by MeCP2 binding at their promoters in human cells [34] (Table 1). Evaluation of the significance of this overlap by Hypergeometric probability, indicates that it is statistically significant (p<0.0001). Then, to further investigate a possible role of MeCP2 as transcriptional repressor through the binding to non-promoter genomic regions, we surveyed the few MeCP2 ChIP-seq available datasets from studies of Mecp2-mutant mice, asking if genes up-regulated in our MECP2-mutated cell lines have been previously described as direct Mecp2 targets. Among the 342 up-regulated transcripts in our dataset, we identified 17 transcripts previously reported by Gabel to be consistently repressed by Mecp2 binding to methylated CA sites in different mouse studies (Table 2) [10]; none of these 17 transcripts was present among those common to Yasui list (compare Table 1 to Table 2). Hypergeometric probability analysis indicates that also this overlap is statistically significant (p<0.0005).The fact that many dysregulated genes in our dataset may not be directly regulated by MeCP2 binding at promoter and non-promoter regions suggests that MECP2 regulates gene expression by both direct and indirect mechanisms. In line with this idea, further interrogation of datasets of deregulated genes identified in expression profiling studies in different MECP2 patient material (post-mortem brain, primary lymphocytes, lympohlbasts, fibroblasts) found no relevant overlap (Gibson JH et al, BMC Neurosci 2010; Ballestar E et al, Hum Genet 2005; Traynor J and BMC Med Genet 2002; Delgado IJ et al, BMC Med Genet 2006).
Table 1:
Deregulated genes in iPSC-derived neurons known to be regulated by MECP2 in Human cells [34].
| Gene symbol | Change direction in present study | Fold Change (M/C) | p value |
|---|---|---|---|
| AATF | UP | 3,52 | 0,01675 |
| BDNF | UP | 3,47 | 0,04875 |
| CDKL2 | UP | 7,12 | 0,00325 |
| GAN | UP | 2,49 | 0,02810 |
| HSPA4 | UP | 2,57 | 0,02685 |
| MAGEE2 | UP | 4,42 | 0,04320 |
| NCAM1 | UP | 2,77 | 0,01545 |
| NEFL | UP | 4,15 | 0,00545 |
| PCDH1 | UP | 2,99 | 0,04655 |
| PIK3R3 | UP | 2,47 | 0,02110 |
| SLC38A1 | UP | 2,25 | 0,04300 |
| STXBP5 | UP | 3,37 | 0,00840 |
| VGF | UP | 4,43 | 0,01665 |
| ADRB2 | DOWN | 0,05 | 0,00825 |
| ANTXR1 | DOWN | 0,30 | 0,01020 |
| B4GALT1 | DOWN | 0,12 | 0,00115 |
| CD164 | DOWN | 0,19 | 0,01100 |
| DLEU1 | DOWN | 0,25 | 0,00965 |
| EGFR | DOWN | 0,29 | 0,01430 |
| FAM46C | DOWN | 0,04 | 0,00115 |
| FRZB | DOWN | 0,08 | 0,00020 |
| GULP1 | DOWN | 0,33 | 0,02010 |
| HIST1H4B | DOWN | 0,33 | 0,02245 |
| ID3 | DOWN | 0,22 | 0,01225 |
| IGFBP5 | DOWN | 0,06 | 0,00025 |
| IL11RA | DOWN | 0,20 | 0,00520 |
| IQGAP3 | DOWN | 0,24 | 0,00215 |
| LAPTM4A | DOWN | 0,15 | 0,00460 |
| OLFML2B | DOWN | 0,29 | 0,01700 |
| PBXIP1 | DOWN | 0,29 | 0,01135 |
| PDGFRA | DOWN | 0,12 | 0,02755 |
| PPP1R1B | DOWN | 0,21 | 0,03115 |
| RGS16 | DOWN | 0,32 | 0,01410 |
| SNAP23 | DOWN | 0,26 | 0,01935 |
| SNX3 | DOWN | 0,30 | 0,01370 |
| SPAG8 | DOWN | 0,27 | 0,03980 |
| TNFRSF19 | DOWN | 0,39 | 0,04860 |
| UQCRB | DOWN | 0,32 | 0,04625 |
Table 2:
Deregulated genes in iPSC-derived neurons known to be repressed by Mecp2 in mouse
| Gene symbol | Change direction in present study | Fold Change (M/C) | p value |
|---|---|---|---|
| AK5 | UP | 3,41 | 0,02020 |
| CABP1 | UP | 14,53 | 0,01055 |
| CHGB | UP | 3,28 | 0,01635 |
| DPP10 | UP | 3,65 | 0,00560 |
| HSPA12A | UP | 6,91 | 0,00040 |
| KCNK2 | UP | 3,38 | 0,04340 |
| KRT222 | UP | 7,94 | 0,04015 |
| LRRTM4 | UP | 3,69 | 0,00515 |
| NPNT | UP | 4,72 | 0,01960 |
| SCN1A | UP | 13,94 | 0,01035 |
| SH3GL2 | UP | 6,23 | 0,00585 |
| SLC4A10 | UP | 3,00 | 0,02035 |
| SORBS2 | UP | 2,75 | 0,03125 |
| TFRC | UP | 2,78 | 0,03035 |
| TNR | UP | 13,35 | 0,01065 |
| TPD52 | UP | 3,02 | 0,02930 |
| ZBTB7C | UP | 4,72 | 0,00025 |
GABAergic circuits up-regulation
GO analysis revealed a statistically significant enrichment among up-regulated transcripts for genes related to neuron development/differentiation, synaptic transmission axonogenesis and dendrite development (Table 3). Further inspection of these genes revealed a substantial number of GABA pathway genes including GABA receptors and other GABA circuits related genes as represented by the heatmap in Fig. 2a. A trend toward up-regulation was noticed also for GAD1, the rate-limiting enzyme the production of GABA from L-glutamic acid. The up-regulation was confirmed by Real-Time qRT-PCR and western blot analyses on neurons from independent differentiation experiments (Fig. 2b). Furthermore, we found a significant increase in mRNA levels of NRG1 and NRG3 that encode proteins expressed mainly in interneurons controlling the development of GABAergic circuits and promoting the formation of excitatory synapses onto the dendrites of GABAergic interneurons [37–39]. Specifically, NRG1 signaling can affect NMDA receptor activity by acting on the NR2 subunit of the receptor. We thus surveyed our RNA-seq data for the expression levels of GRIN2B, the gene encoding for the NR2B subunit of NMDA receptors, and found a trend toward an up-regulation (Fig. 2a); Real Time qRT-PCR analysis on cDNAs from an independent differentiation experiment confirmed the up-regulation of GRIN2B (Fig. 2c). A statistically significant up-regulation was also detected for Neurexin1 (NRXN1) and Neurexin3 (NRXN3), transcripts essential for modulating GABAergic transmission by direct binding to GABAA-receptors [40] and important for their concurrent role in axon path-finding.
Table 3:
Biological processes enriched in over-expressed genes
| GO Term | p Value | Genes | Fold Enrichment | Bonferroni-corrected p value | Benjamini-corrected p value | FDR-corrected p value |
|---|---|---|---|---|---|---|
| GO:0007268~synaptic transmission | 1.83E-11 | SYT1, TAC1, GABBR2, ADORA1, RIMS1, HCRTR2, CTTNBP2, SLC1A2, SHC3, SLC1A1, GABRG2, KCND2, NRXN3, GABRA3, SLC12A5, LIN7C, NRXN1, GRIA4, NAALAD2, GRIA2, GRIA1, TMOD2, GHRL, ABAT, CACNA1E, NCAN | 5.32 | 2.83E-08 | 2.83E-08 | 3.06E-08 |
| GO:0030182~euron differentiation | 1.31E-10 | CDK5R1, LPPR4, IRX5, SOX5, PAX3, KLHL1, ALDH1A2, BDNF, S1PR1, ANK3, PAX7, TNR, GBX2, ROBO3, OLFM3, DCX, NEFL, DSCAM, APC, GNAO1, MCF2, NRXN3, PTPRZ1, DOCK7, NRXN1, ASCL1, MAP2, GHRL, RELN, NTM | 4.17 | 2.02E-07 | 6.74E-08 | 2.19E-07 |
| GO:0048666~euron development | 1.54E-09 | CDK5R1, LPPR4, GNAO1, IRX5, MCF2, PTPRZ1, NRXN3, DOCK7, NRXN1, KLHL1, ASCL1, BDNF, ANK3, TNR, MAP2, GBX2, GHRL, RELN, ROBO3, OLFM3, DCX, NEFL, NTM, DSCAM, APC | 4.49 | 2.38E-06 | 5.95E-07 | 2.57E-06 |
| GO:0031175~euron projection development | 7.30E-09 | CDK5R1, LPPR4, GNAO1, MCF2, PTPRZ1, NRXN3, DOCK7, NRXN1, KLHL1, BDNF, ANK3, TNR, MAP2, GBX2, GHRL, RELN, ROBO3, DCX, NEFL, DSCAM, APC | 5.00 | 1.13E-05 | 2.25E-06 | 1.22E-05 |
| GO:0007267~cell-cell signaling | 4.43E-08 | SYT1, TAC1, GABBR2, VGF, ADORA1, RIMS1, HCRTR2, CTTNBP2, PCDH1, SLC1A2, BDNF, SHC3, SLC1A1, GABRG2, KCND2, NRXN3, GABRA3, SLC12A5, LIN7C, PCDH8, NRXN1, GRIA4, NAALAD2, WNT7B, GRIA2, GRIA1, TMOD2, ABAT, GHRL, CACNA1E, NCAN | 3.15 | 6.83E-05 | 1.14E-05 | 7.39E-05 |
| GO:0030030~cell projection organization | 6.61E-07 | CDK5R1, LPPR4, GNAO1, ONECUT1, MCF2, PTPRZ1, NRXN3, DOCK7, NRXN1, KLHL1, BDNF, ANK3, TNR, MAP2, GBX2, GHRL, RELN, ROBO3, DCX, NEFL, DSCAM, APC | 3.64 | 1.02E-03 | 1.45E-04 | 1.10E-03 |
| GO:0032940~secretion by cell | 1.54E-06 | SYT1, CPLX2, NRXN3, LIN7C, SYT6, VGF, RIMS1, CADPS, BDNF, GNPTAB, STXBP5, GHRL, EXOC6, SYTL2, DOC2B, SCAMP5 | 4.71 | 2.37E-03 | 2.97E-04 | 2.57E-03 |
| GO:0048667~cell morphogenesis involved in neuron differentiation | 1.73E-06 | CDK5R1, LPPR4, PTPRZ1, NRXN3, DOCK7, NRXN1, BDNF, ANK3, TNR, GBX2, RELN, ROBO3, DCX, NEFL, DSCAM, APC | 4.67 | 2.66E-03 | 2.96E-04 | 2.89E-03 |
| GO:0048812~euron projection morphogenesis | 2.19E-06 | CDK5R1, LPPR4, PTPRZ1, NRXN3, DOCK7, NRXN1, BDNF, ANK3, TNR, GBX2, RELN, ROBO3, DCX, NEFL, DSCAM, APC | 4.58 | 3.38E-03 | 3.38E-04 | 3.66E-03 |
| GO:0048858~cell projection morphogenesis | 2.68E-06 | CDK5R1, LPPR4, ONECUT1, PTPRZ1, NRXN3, DOCK7, NRXN1, BDNF, ANK3, TNR, GBX2, RELN, ROBO3, DCX, NEFL, DSCAM, APC | 4.23 | 4.12E-03 | 3.75E-04 | 4.47E-03 |
| GO:0007409~axonogenesis | 3.41E-06 | CDK5R1, LPPR4, PTPRZ1, NRXN3, DOCK7, NRXN1, BDNF, ANK3, TNR, GBX2, RELN, ROBO3, DCX, NEFL, APC | 4.74 | 5.25E-03 | 4.38E-04 | 5.69E-03 |
| GO:0046903~secretion | 8.76E-06 | SYT1, CPLX2, NRXN3, LIN7C, SYT6, TPD52, VGF, ADORA1, RIMS1, CADPS, BDNF, GNPTAB, STXBP5, GHRL, EXOC6, SYTL2, DOC2B, SCAMP5 | 3.66 | 1.34E-02 | 9.64E-04 | 1.46E-02 |
| G0:0000904~cell morphogenesis involved in differentiation | 1.14E-05 | CDK5R1, LPPR4, PTPRZ1, NRXN3, DOCK7, NRXN1, BDNF, ANK3, TNR, GBX2, RELN, ROBO3, DCX, NEFL, DSCAM, APC | 4.00 | 1.74E-02 | 1.17E-03 | 1.90E-02 |
| GO:0016358~dendrite development | 1.94E-05 | BDNF, MCF2, MAP2, GHRL, DCX, KLHL1, DSCAM | 12.19 | 2.95E-02 | 1.87E-03 | 3.23E-02 |
| GO:0006811~ion transport | 2.12E-05 | SLC8A3, SCN1A, SCN3A, SCN3B, GRIK3, GLRA2, CTTNBP2, SLC1A2, CAMK2B, SLC39A5, HCN4, SLC1A1, GABRG2, GABRA1, KCND2, GABRA3, KCNB2, SLC12A5, SCN2A, GRIA3, GRIA4, KCNK2, PRKCB, SLC4A10, GRIA2, GRIA1, RYR3, CACNA1E, SLC38A1, CACNA1D | 2.38 | 3.22E-02 | 1.92E-03 | 3.54E-02 |
| GO:0007155~cell adhesion | 2.90E-05 | CDK5R1, NPNT, ASTN1, MEGF10, CDH8, PCDH1, S1PR1, CDH9, TNR, AATF, CDH26, NEGR1, DSCAM, APC, CNTN5, NRXN3, CNTNAP5, SIGLEC10, PCDH15, PCDH8, NRXN1, NCAM1, CDH18, RELN, NCAN, CDH10, NTM, UNCX | 2.44 | 4.37E-02 | 2.48E-03 | 4.83E-02 |
Fig. 2. Up regulation of GABAergic axis.
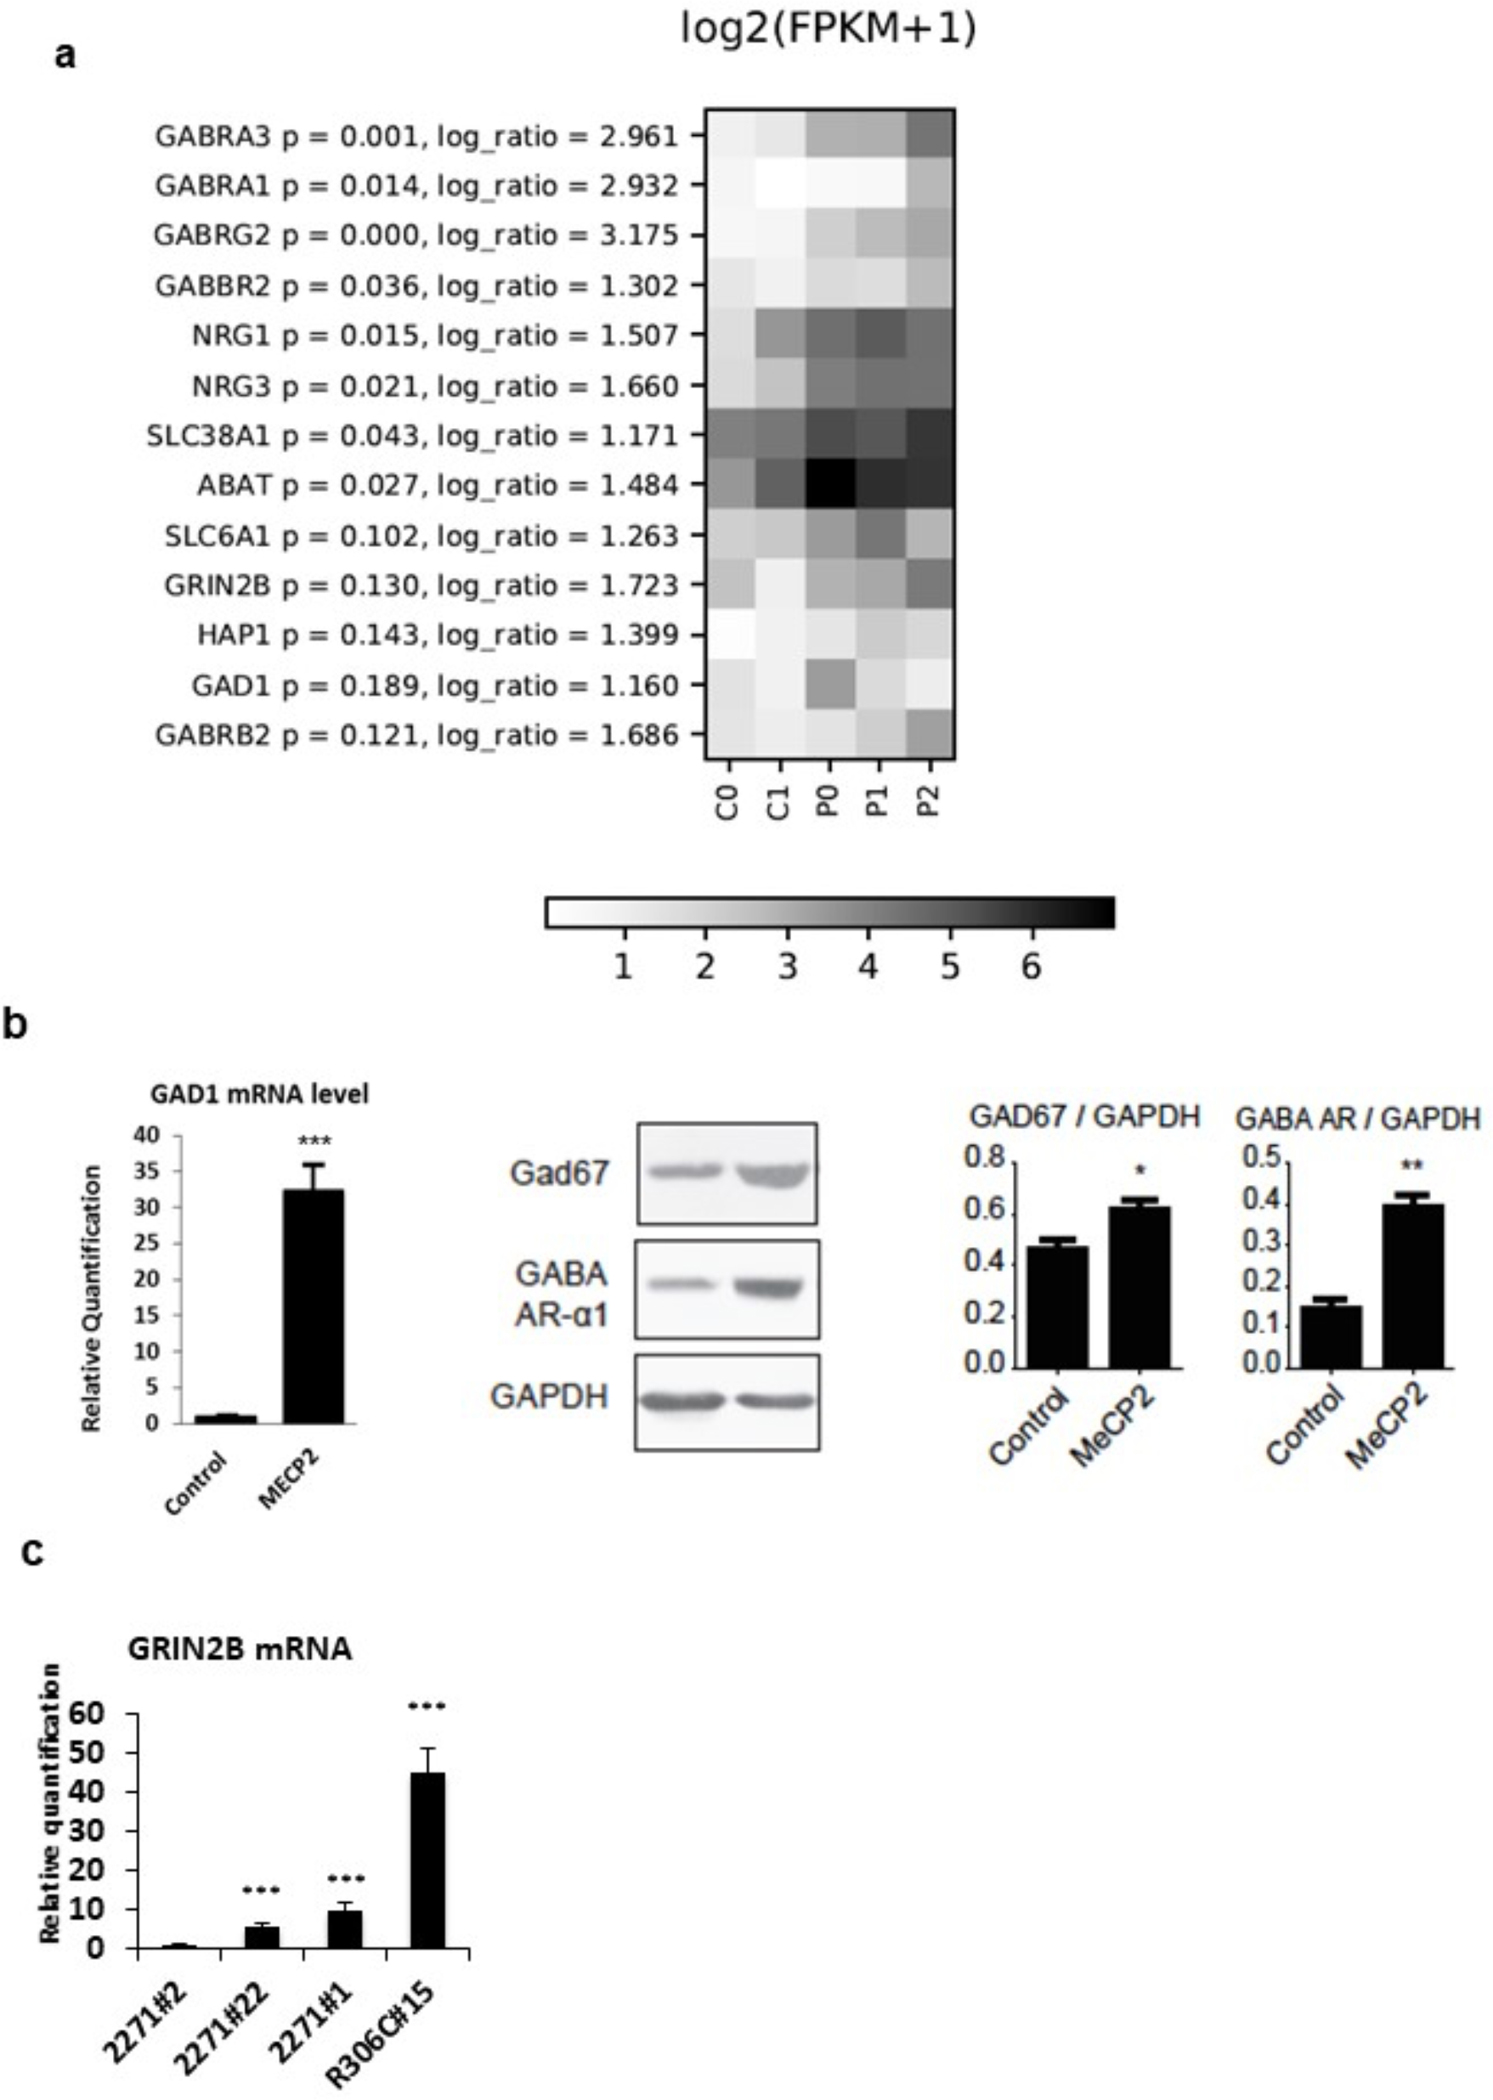
a) HeatMap of GABAergic pathway genes; for each gene, log ratio and related p-values are shown. b) Validation of RNAseq data on neurons from and independent differentiation experiment demonstrate a significant upregulation of GAD1 mRNA and protein levels and of GABA-R receptor alpha 1 (GABA-AR) protein in MECP2-mutated neurons compared to controls. GAPDH was used as loading control for western blot analysis. n=3. c) Upregulation of GRIN2B mRNA in neurons from the 3 MECP2-mutated clones respect to neurons from the partial isogenic control clone (2271#2). Statistical significance was determined using unpaired student’s t test (*p<0.05; **p<0.001; ***p<0.0001).
Functional studies reveal altered GABAergic transmission and increased excitability of mutant cells
To investigate the functional consequences of MeCP2 mutation in iPSC-derived patient neurons we first assessed general biophysical neuronal parameters such as resting potential (Fig. 3a), membrane capacitance (Fig. 3b), membrane resistance (Fig. 3c). None of these parameters was significantly different between control and mutant neurons. Then, we studied neuronal excitability by measuring the peak of the V-gated Na current and depolarization evoked firing (Fig. 3d–e). Evoked firing resulted to be significantly affected by MeCP2 mutation. Indeed, mutants cells produced more action potentials than wt cells in response to different depolarizing steps. No difference was present in Na current peaks.
Fig. 3. Altered functional properties of MeCP2 mutant neurons.
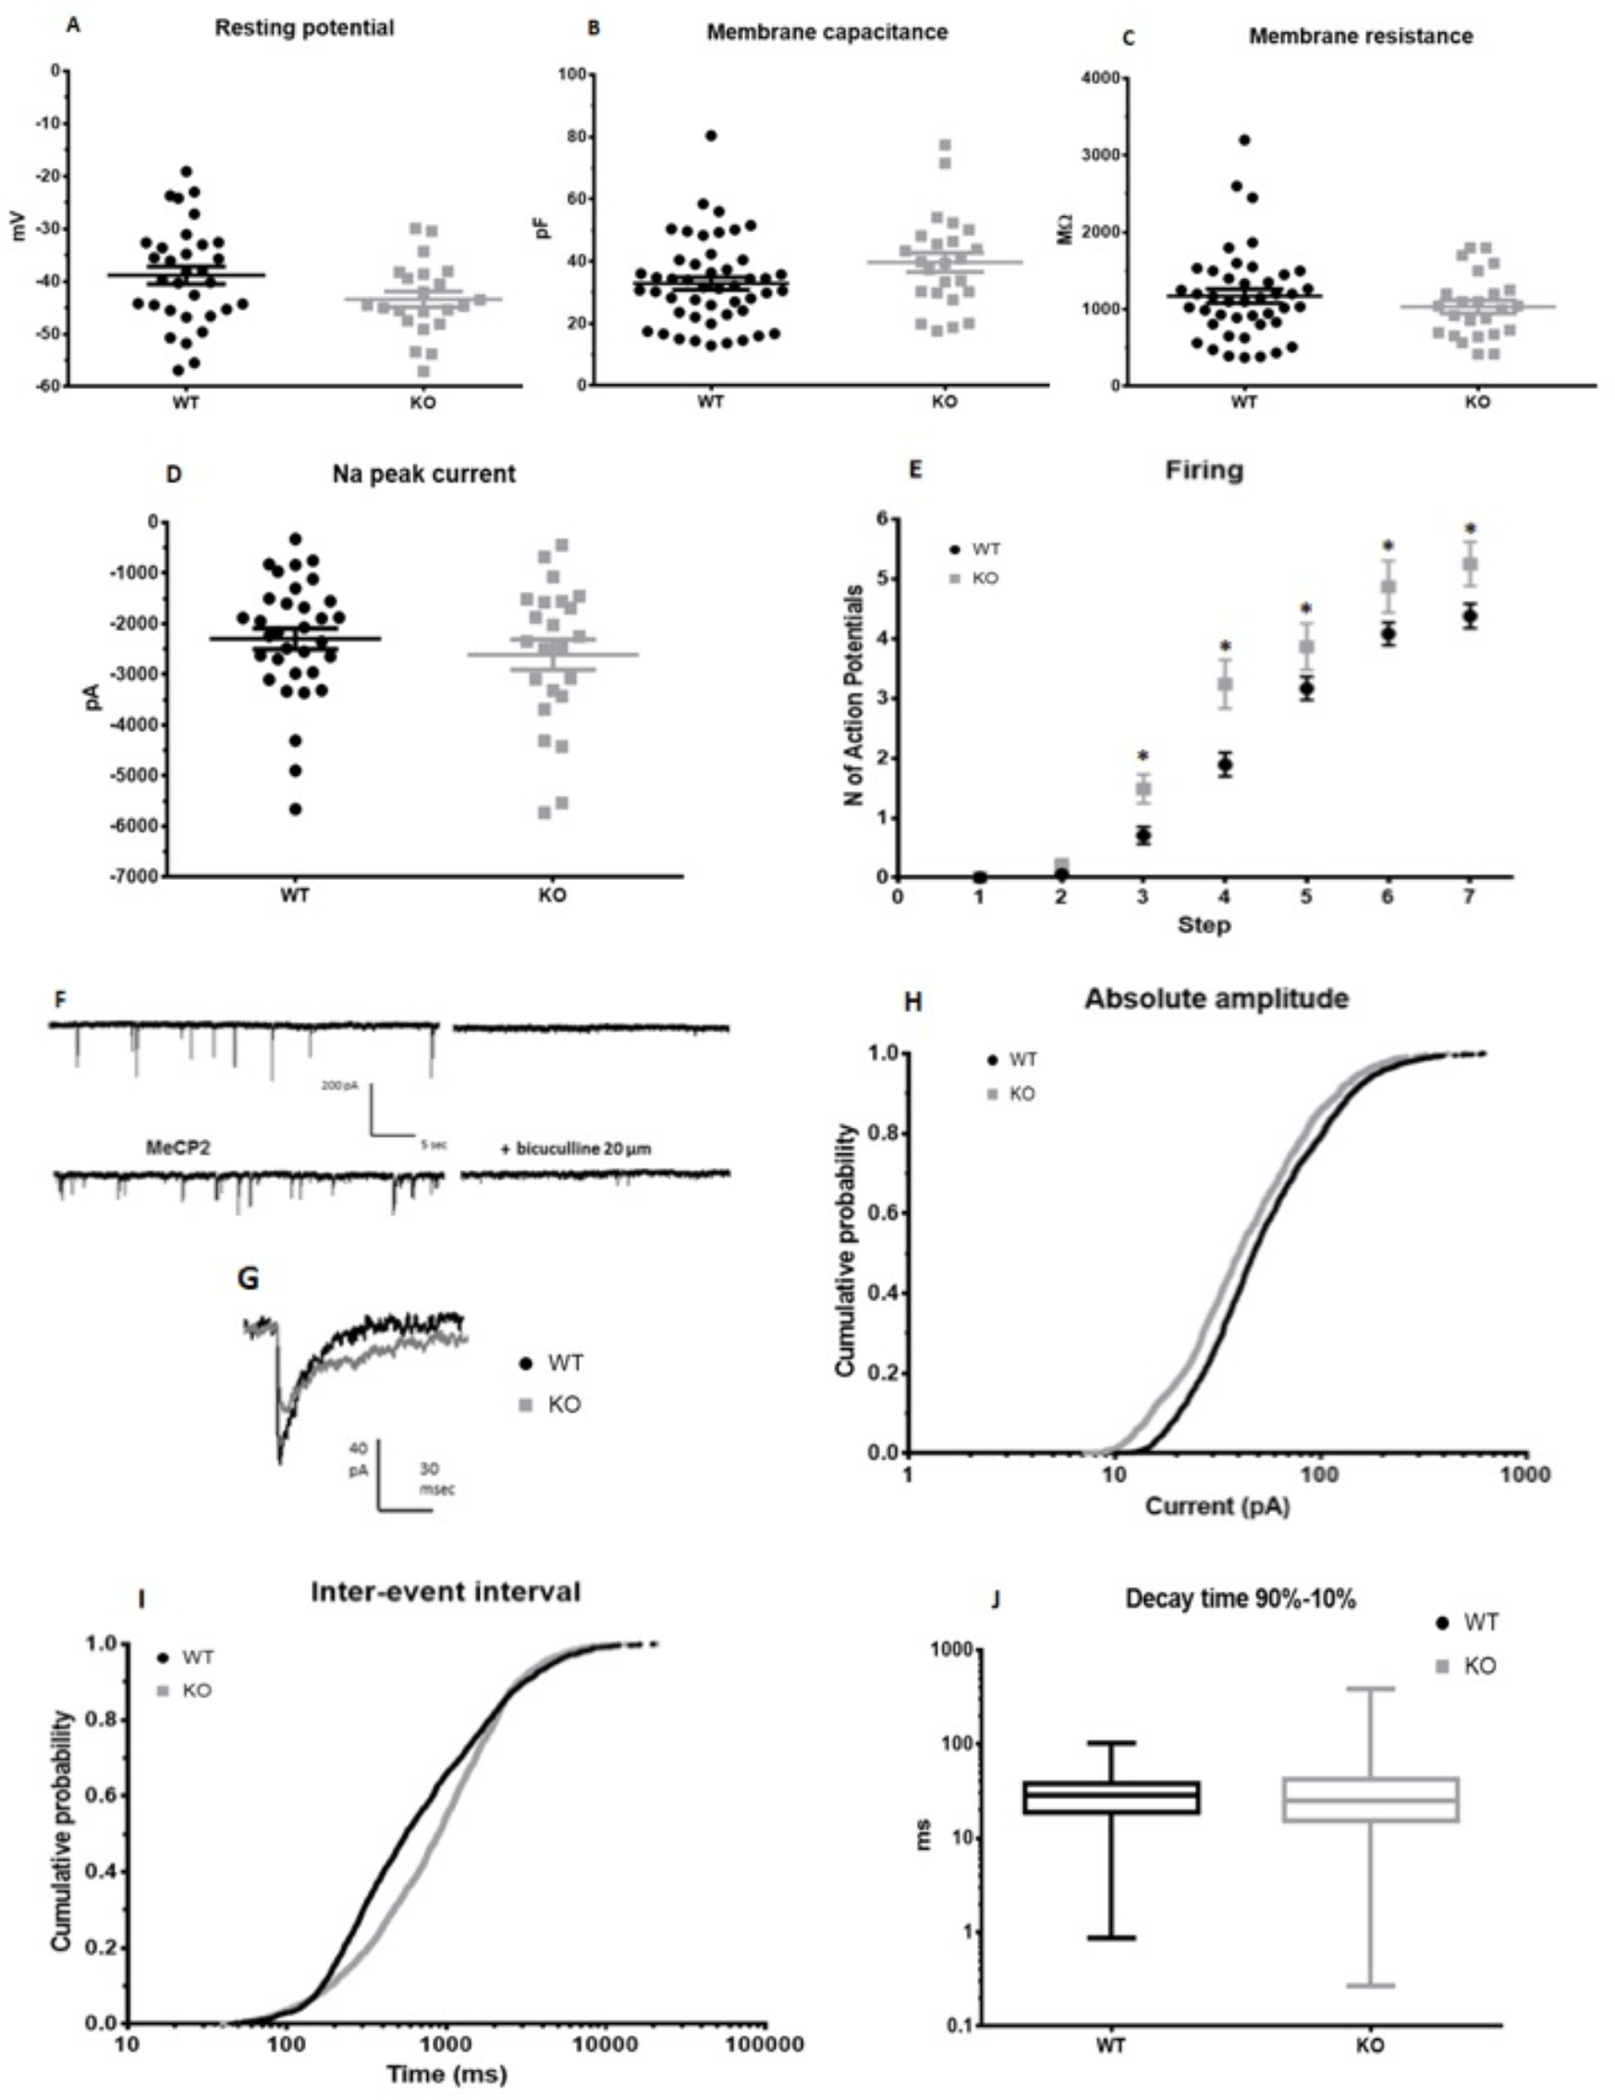
a) Membrane resting potential (mV). Student t test: p = 0.093, n wt = 32, n ko = 22. b) Membrance capacitance (pF), p = 0.063, n wt = 48, n ko = 24. c) Membrane resistance (MΩ). Student t test: p = 0.31, n wt = 43, n ko = 24. d) Maximum peak of Na current recorded in voltage clamp. Student t test: p = 0.373, n wt = 33, n ko = 23. e) Firing: number of action potentials evoked by +10 mV steps of the membrane potential starting from −70 mV. Two way ANOVA, * p < 0.05, n wt = 27, n ko = 20. f) Example of traces for control and MECP2 mutated cells; traces from the same cell in the presence of bicuculine are shown on the right. g) Average sIPSCs in a control (CNT) and a mutant cell. h) Cumulative distribution of sIPSC amplitude (pA). Mann-Whitney: p <0.001; wt median: 47.0, 25th-75th percentile = 30.0–87.0; ko median: 40.1, 25th-75th percentile = 24.5– 73.0. i) Cumulative distribution of sIPSCs inter-event interval (ms). Mann-Whitney: p <0.001; wt median: 56.4, 25th-75th percentile: 263.5–1494.6; ko median: 895.0, 25th-75th percentile 392.6–1764.0. j) Whisker plot of sIPSC decay kinetics (90–10% decay time). Mann-Whitney: p = 0.078; wt: median: 28.6, 25th-75th percentile 18.6–37.7; ko median: 25.3, 25th-75th percentile 15.2–41.8. Measurements for h, i and j were collected from 28 control neurons and 18 MECP2-mutated neurons. Data are reported as mean ± SEM. Each circle in a-d represents a cell.
To explore the functional differences in GABAergic transmission caused by MeCP2 mutations, we recorded spontaneous GABAergic currents using patch-clamp in whole cell configuration in the presence of 6,7-dinitroquinoxaline-2,3-dione (DNQX) to inhibit excitatory glutamatergic transmission. Spontaneous currents were abolished by bicuculline confirming the GABAergic nature of the recorded currents (Fig. 3f–g). We found that spontaneous current amplitude (Fig. 3h) and frequency (fig. 3i) were significantly lower in MeCP2 cells (187 cells, ) with respect to control cells (28 cells). No significant difference was present in current decay time (Fig. 3j). These data indicate at functional level that alterations in the GABAergic transmission are present in MECP2-mutated neurons and report enhanced excitability of mutant neurons.
Microtubules system impairment, selective over-expression of HDAC6 and increase of acetylated α-tubulin levels after iHDAC6 treatment
Intriguingly, RNA-seq data analysis revealed an over-expression of the histone deacetylase 6 (HDAC6) gene, encoding for a cytoplasmic deacetylase whose main substrate is acetylated α-tubulin, in MECP2-mutated neurons (Table S1). Western blot analysis revealed a significant reduction in acetylated α-tubulin in MECP2-mutated neurons compared to controls, likely as a consequence of the increase in HDAC6 activity (p-value <0.05) (Fig. 4a). The levels of acetylated tubulin are of fundamental relevance for many functions in neuronal cells, including vesicle trafficking, neuronal migration and axon polarization and elongation [41]. Therefore, this finding indicates that an impairment of the microtubule network together with a reduction of acetylated α-tubulin mediated by HDAC6 overexpression could be reflected in axonogenesis alterations.
To validate the direct correlation between HDAC6 overexpression and acetylated tubulin reduction, we treated mutated neurons with a new potent and selective heterocyclic inhibitor of HDAC6 (compound #1, HDAC1/HDAC6 IC50 ratio = 47). Specifically, differentiating neurons were treated for 5 days with 40 μM drug concentration (Fig. 4b). Western blot analyses on mutated and control neurons showed that the treatment significantly increases acetylated α-tubulin levels (Fig. 4c). A literature search for commercial HDAC6 inhibitors revealed a molecule, ACY-1215 (HDAC1/HDAC6 IC50 ratio = 12), presently under evaluation for Multiple Myeloma treatment [42]. We thus decided to test also this second molecule for its ability to modulate acetylated α-tubulin levels in our model. Since the selected dose for inhibitor #1 resulted in a significant increase in acetylated α-tubulin also in control cells, for ACY-1215 we evaluated lower drug doses (20 μM and 40 μM). This treatment also resulted in a marked increase in the levels of acetylated α-tubulin (Fig. 4c), confirming the direct link between HDAC6 activity and microtubule network status.
Discussion
Our gene expression analysis of MECP2-mutated neurons revealed key developmental abnormalities including an overexpression of GABAergic gene products and dysregulated cytoskeletal proteins. The comparison of MECP2-mutated cell lines with two controls, including an partial isogenic control (p.Thr158Met), allowed us to partially overcome the limitation of the genetic background and to study transcriptome perturbations linked to RTT rather than background-specific effects.
Over the years, expression profiling has been performed on multiple tissues and cell types, both from patients and mouse models. Comparison of genes lists from these experiments has always yielded limited overlap, even when comparing patients’ material, suggesting that target genes vary significantly depending on the analyzed tissue/brain area but also probably as a function of disease progression and age. In line with this trend, when comparing our deregulated genes to those identified by Gabel and colleagues [10] as targets of Mecp2 repression in mouse brain, we found only 17 genes in common (Table 2). Similarly, comparison with MeCP2 direct targets in SH-SY5Y human neuroblastoma cells identified by CHIP-Chip resulted in 38 common genes, none of which was present in Gabel’ list. Even if the overlap is statistically significant, it is however very limited, either reinforcing the idea that a large number of MeCP2 targets are cell type-specific [43] or suggesting an indirect effect of MECP2 on the identified dysregulated transcripts. In line with these hypothesis, comparison with published datasets of genes deregulated in patients did not identify relevant overlaps.
Our RNA-sequencing analysis, together with functional studies, reveals that the fine-tuning of GABAergic circuits represents one of the main perturbed pathways in MECP2-related RTT. It has been indeed demonstrated that the selective depletion of Mecp2 from GABAergic neurons results in a severe RTT-like phenotype [44] while restoring Mecp2 expression only in GABAergic neurons of Mecp2 null mice results in a significant, although not complete, rescue [45]. Differently from what found in our cells, in these mice Mecp2 ablation results in the reduction of Gad1 levels and GABAergic circuits activity. It must be however noticed that Chao and colleagues analyzed adult brain tissues, while our cells are closer to embryonic brain neurons, as indicated by previous studies [14] and as confirmed by a predominance of GABAA receptor alpha-3 and alpha-2 subunits (Fig. S1b) whose expression, higher in the embryo and at birth, gradually decreases as alpha-1 subunit takes over [46]. In our recent publication modeling FOXG1-related RTT variants, we found that, although GABAergic markers are upregulated in the embryonic Foxg1+/− mouse brain at a gestational age corresponding to iPSC-derived neurons, the same markers are down-regulated in adult Foxg1+/− brain, suggesting an age-dependent effect [20]. MECP2 deficiency might result in a similar phenomenon, with excessive GABAergic markers expression during brain development and depression of both GABA and glutamate circuits later in life. Surprisingly, in spite of excessive expression og GABAergic markers, functional characterization of our neurons revealed reduced amplitude and frequency of spontaneous GABAergic currents and neurons hyper-excitability (Fig. 3). The identification of neuronal hyper-excitability is in line with literature data that reported the same finding in different mouse and cellular models of RTT (REF: Calfa G et al, Hippocampus. 2015: Excitation/inhibition imbalance and impaired synaptic inhibition in hippocampal area CA3 of Mecp2 knockout mice; Zhong W et al, Physiol Rep. 2017 Jan;5(2): Effects of early-life exposure to THIP on brainstem neuronal excitability in the Mecp2-null mouse model of Rett syndrome before and after drug withdrawal.; Marchetto M et al, Cell 2010: A Model for Neural Development and Treatment of Rett Syndrome using human induced Pluripotent Stem Cells). It must be however noticed that opposite results, with reduced excitability or reduction of both excitation and inhibition have been reported, suggesting a complex spatial and temporal modulation of electophysiological alterations in RTT neurons (REF: Dani VS et al, Proc Natl Acad Sci U S A. 2005 Aug 30;102(35):12560–5: Reduced cortical activity due to a shift in the balance between excitation and inhibition in a mouse model of Rett syndrome; El-Khoury R et al, PLoS One 2014: GABA and glutamate pathways are spatially and developmentally affected in the brain of Mecp2-deficient mice; Banerjee A et al, PNAS 2016: Jointly reduced inhibition and excitation underlies circuit-wide changes in cortical processing in Rett syndrome; Bedogni F et al, Cereb Cortex. 2016 Jun;26(6):2517–2529: Defects During Mecp2 Null Embryonic Cortex Development Precede the Onset of Overt Neurological Symptoms). In this scenario, the increased expression of GABAergic circuit markers might represent an attempt of the neuronal network to compensate the increased excitatory response of mutated neurons. Moreover, GABA neurons are excitatory during early stages of neurodevelopment as a result of a higher intracellular chloride concentration [Cl−](i) [46], and undergo a switch towards an inhibitory function later in life [47]. According to a recent work neurons differentiated from iPSCs derived from RTT patients show a KCC2-mediated delayed GABA functional switch from excitatory to inhibitory [48]. We did not detect statistically significant changes in KCC2 transcript levels in our cells, likely due to a mutation-dependent effect. Our electrophysiological experiments were performed with conventional whole-cell recordings that perturb chloride gradients, therefore they cannot be used to assess the timing of the switch of GABAergic currents from excitatory to inhibitory; however, our data support the idea that the excessive expression of GABAA receptor in MECP2-mutated neurons could result in hyper-excitability in a critical time window during brain development which might be responsible for triggering epilepsy, a RTT disease feature, leading to additional neuronal damage and thus causing the subsequent depletion of both GABAergic and glutamatergic markers. Further investigations using perforated patch clamp recordings at different time points are needed to clarify this issue.
The identified alteration of GABAergic circuits has important implications for the therapy currently adopted for RTT, raising some concerns on the pertinence of the use of Benzodiazepines in Rett children, since GABAA receptor agonists such as Clonazepam, potentiating neurons hyper-excitability, could have a paradoxical effect, increasing anxiety and aggression, in line with literature data [49] and with our personal clinical observations (unpublished data). Our analyses rather open up the possibility of new therapeutic approaches, such as the investigation of the therapeutic outcome of Flumazenil (Ro 15–1788), a GABAA receptor antagonist approved for Benzodiazepine over-dosage treatment, that is well-tolerated both systemically and locally with no significant adverse effects [49]. Finally, these results, together with our previously published data in FOXG1-mutated iPSC-derived neurons and in embryonic Foxg1+/− mouse brain [20, 50], strongly support the idea that common molecular pathways underlie the overlapping phenotype observed for Rett spectrum disorders and open up the possibility of a shared therapeutic approach.
Notably, functional annotation revealed that deregulated genes are enriched for neuron development, neuron projection morphogenesis, axonogenesis and cytoskeleton dynamic transcripts. Accordingly, we identified an upregulation of Histone Deacetylase 6 (HDAC6) enzyme. HDAC6 is a cytoplasmic Histone Deacetylase (HDAC) that regulates the acetylation of α-tubulin, playing a key role in maintaining typical distribution of acetylated microtubules in cells. A role of HDAC6 and its regulation of acetylated tubulin levels in RTT has already been identified in patients-derived fibroblasts [51]. In accordance with these data, we indeed found a significant reduction in the levels of acetylated α-tubulin in MECP2-mutated iPSC-derived patient neurons compared to control ones. This reduction is reverted following treatment with two selective HDAC6 inhibitors (compound #1 and ACY-1215), confirming the direct link between HDAC6 overexpression and reduced acetylated α-tubulin. This result might have fundamental implications for the design of a therapeutic approach for RTT. Indeed, HDAC6 plays relevant roles in many processes altered in RTT, including axon path-finding, vesicular and mitochondrial trafficking, oxidative stress responses, neuronal migration and differentiation [52], suggesting that its modulation might impact on different pathologically relevant alterations. In this respect, both tested drugs selectively act on HDAC6, thus significantly reducing the risk of off-target effects usually associated to the use of pan-HDAC inhibitors. Moreover, one of these drugs (ACY-1215) recently passed a phase 1b trial for Multiple myeloma [42] and it is thus close to clinical application. As a consequence, if its relevance to RTT will be confirmed, its repurposing might significantly reduce the time to a clinical trial in patients.
In conclusion, we demonstrate here for the first time that reduced levels of acetylated tubulin are present in human patient-derived neurons, the most disease-relevant human cells. This alteration, together with GABAergic circuit impairment, represent a signature of MECP2-related RTT. Both pathways are amenable to treatment with drugs currently approved or under evaluation for use in patients, thus foreseeing a fast progression to clinical trials to evaluate the therapeutic relevance of their modulation for RTT therapy.
Supplementary Material
Acknowledgements
Authors thank Prof. Manfred Jung for binding assays. The Cell lines and DNA bank of Rett Syndrome, X-linked mental retardation and other genetic diseases, member of the Telethon Network of Genetic Biobanks (project no. GTB12001), funded by Telethon Italy, and of the EuroBioBank network, and the “Associazione Italiana Rett O.N.L.U.S.” provided us with specimens. Authors (GC, MB) thank PRIN 2010 for financial support and COST Action CM1406 EpiChemBio. This work was partially supported by grants to AR from the Italian Health Ministry [grant n. RF-2010–2317597] and from the “Associazione Italiana Rett O.N.L.U.S.”.
Footnotes
Declaration of interest
Conflicts of interest: none.
References
- [1].Chahrour M, Zoghbi HY, The story of Rett syndrome: from clinic to neurobiology, Neuron 56 (2007) 422–437. [DOI] [PubMed] [Google Scholar]
- [2].Katz DM, Bird A, Coenraads M, Gray SJ, Menon DU, Philpot BD, Tarquinio DC, Rett Syndrome: Crossing the Threshold to Clinical Translation, Trends Neurosci 39 (2016) 100–113. [DOI] [PMC free article] [PubMed] [Google Scholar]
- [3].Hagberg B, Witt-Engerstrom I, Rett Syndrome: A suggested staging system for describing impairment profile with increasing age towards adolescence, Am J Hum Genet 24 (1986) 47–59. [DOI] [PubMed] [Google Scholar]
- [4].Grillo E, Villard L, Clarke A, Ben Zeev B, Pineda M, Bahi-Buisson N, Hryniewiecka-Jaworska A, Bienvenu T, Armstrong J, Roche-Martinez A, Mari F, Veneselli E, Russo S, Vignoli A, Pini G, Djuric M, Bisgaard AM, Mejaski Bosnjak V, Polgar N, Cogliati F, Ravn K, Pintaudi M, Melegh B, Craiu D, Djukic A, Renieri A, Rett networked database: an integrated clinical and genetic network of Rett syndrome databases, Hum Mutat 33 (2012) 1031–1036. [DOI] [PubMed] [Google Scholar]
- [5].Lyst MJ, Bird A, Rett syndrome: a complex disorder with simple roots, Nat Rev Genet 16 (2015) 261–275. [DOI] [PubMed] [Google Scholar]
- [6].Nan X, Ng H, Johnson C, Laherty C, Turner B, Eisenman R, Bird A, Transcriptional repression by the methyl-CpG-binding protein MeCP2 involves a histone deacetylase complex., Nature 393 (1998) 386–389. [DOI] [PubMed] [Google Scholar]
- [7].Jones PL, Veenstra GJ, Wade PA, Vermaak D, Kass SU, Landsberger N, Strouboulis J, Wolffe AP, Methylated DNA and MeCP2 recruit histone deacetylase to repress transcription, Nat Genet 19 (1998) 187–191. [DOI] [PubMed] [Google Scholar]
- [8].Renieri A, Meloni I, Longo I, Ariani F, Mari F, Pescucci C, Cambi F, Rett syndrome: the complex nature of a monogenic disease., J. Mol. Med. 81 (2003) 346–354. [DOI] [PubMed] [Google Scholar]
- [9].Guo JU, Su Y, Shin JH, Shin J, Li H, Xie B, Zhong C, Hu S, Le T, Fan G, Zhu H, Chang Q, Gao Y, Ming GL, Song H, Distribution, recognition and regulation of non-CpG methylation in the adult mammalian brain, Nat Neurosci 17 (2014) 215–222. [DOI] [PMC free article] [PubMed] [Google Scholar]
- [10].Gabel HW, Kinde B, Stroud H, Gilbert CS, Harmin DA, Kastan NR, Hemberg M, Ebert DH, Greenberg ME, Disruption of DNA-methylation-dependent long gene repression in Rett syndrome, Nature 522 (2015) 89–93. [DOI] [PMC free article] [PubMed] [Google Scholar]
- [11].Chahrour M, Jung SY, Shaw C, Zhou X, Wong ST, Qin J, Zoghbi HY, MeCP2, a key contributor to neurological disease, activates and represses transcription, Science 320 (2008) 1224–1229. [DOI] [PMC free article] [PubMed] [Google Scholar]
- [12].Jucker M, The benefits and limitations of animal models for translational research in neurodegenerative diseases, Nature medicine 16 (2010) 1210–1214. [DOI] [PubMed] [Google Scholar]
- [13].Takahashi K, Tanabe K, Ohnuki M, Narita M, Ichisaka T, Tomoda K, Yamanaka S, Induction of pluripotent stem cells from adult human fibroblasts by defined factors, Cell 131 (2007) 861–872. [DOI] [PubMed] [Google Scholar]
- [14].Mariani J, Simonini MV, Palejev D, Tomasini L, Coppola G, Szekely AM, Horvath TL, Vaccarino FM, Modeling human cortical development in vitro using induced pluripotent stem cells, Proc Natl Acad Sci U S A 109 (2012) 12770–12775. [DOI] [PMC free article] [PubMed] [Google Scholar]
- [15].Mariani J, Coppola G, Zhang P, Abyzov A, Provini L, Tomasini L, Amenduni M, Szekely A, Palejev D, Wilson M, Gerstein M, Grigorenko EL, Chawarska K, Pelphrey KA, Howe JR, Vaccarino FM, FOXG1-Dependent Dysregulation of GABA/Glutamate Neuron Differentiation in Autism Spectrum Disorders, Cell 162 (2015) 375–390. [DOI] [PMC free article] [PubMed] [Google Scholar]
- [16].Pasca AM, Sloan SA, Clarke LE, Tian Y, Makinson CD, Huber N, Kim CH, Park JY, O’Rourke NA, Nguyen KD, Smith SJ, Huguenard JR, Geschwind DH, Barres BA, Pasca SP, Functional cortical neurons and astrocytes from human pluripotent stem cells in 3D culture, Nat Methods 12 (2015) 671–678. [DOI] [PMC free article] [PubMed] [Google Scholar]
- [17].Handel AE, Chintawar S, Lalic T, Whiteley E, Vowles J, Giustacchini A, Argoud K, Sopp P, Nakanishi M, Bowden R, Cowley S, Newey S, Akerman C, Ponting CP, Cader MZ, Assessing similarity to primary tissue and cortical layer identity in induced pluripotent stem cell-derived cortical neurons through single-cell transcriptomics, Hum Mol Genet 25 (2016) 989–1000. [DOI] [PMC free article] [PubMed] [Google Scholar]
- [18].Amenduni M, De Filippis R, Cheung AY, Disciglio V, Epistolato MC, Ariani F, Mari F, Mencarelli MA, Hayek Y, Renieri A, Ellis J, Meloni I, iPS cells to model CDKL5-related disorders, Eur J Hum Genet (2011). [DOI] [PMC free article] [PubMed] [Google Scholar]
- [19].Livide G, Patriarchi T, Amenduni M, Amabile S, Yasui D, Calcagno E, Lo Rizzo C, De Falco G, Ulivieri C, Ariani F, Mari F, Mencarelli MA, Hell JW, Renieri A, Meloni I, GluD1 is a common altered player in neuronal differentiation from both MECP2-mutated and CDKL5-mutated iPS cells, Eur J Hum Genet 23 (2015) 195–201. [DOI] [PMC free article] [PubMed] [Google Scholar]
- [20].Patriarchi T, Amabile S, Frullanti E, Landucci E, Lo Rizzo C, Ariani F, Costa M, Olimpico F, W.H. J, M.V. F, Renieri A, Meloni I, Imbalance of excitatory/inhibitory synaptic protein expression in iPSC-derived neurons from FOXG1(+/−) patients and in foxg1(+/−) mice, Eur J Hum Genet 24 (2016) 871–880. [DOI] [PMC free article] [PubMed] [Google Scholar]
- [21].Marchetto MC, Carromeu C, Acab A, Yu D, Yeo GW, Mu Y, Chen G, Gage FH, Muotri AR, A model for neural development and treatment of Rett syndrome using human induced pluripotent stem cells, Cell 143 (2010) 527–539. [DOI] [PMC free article] [PubMed] [Google Scholar]
- [22].Cheung AY, Horvath LM, Grafodatskaya D, Pasceri P, Weksberg R, Hotta A, Carrel L, Ellis J, Isolation of MECP2-null Rett Syndrome patient hiPS cells and isogenic controls through X-chromosome inactivation, Hum Mol Genet 20 (2011) 2103–2115. [DOI] [PMC free article] [PubMed] [Google Scholar]
- [23].Kim JE, O’Sullivan ML, Sanchez CA, Hwang M, Israel MA, Brennand K, Deerinck TJ, Goldstein LS, Gage FH, Ellisman MH, Ghosh A, Investigating synapse formation and function using human pluripotent stem cell-derived neurons, Proc Natl Acad Sci U S A 108 (2011) 3005–3010. [DOI] [PMC free article] [PubMed] [Google Scholar]
- [24].Hotta A, Cheung AY, Farra N, Garcha K, Chang WY, Pasceri P, Stanford WL, Ellis J, EOS lentiviral vector selection system for human induced pluripotent stem cells, Nat Protoc 4 (2009) 1828–1844. [DOI] [PubMed] [Google Scholar]
- [25].Abyzov A, Mariani J, Palejev D, Zhang Y, Haney MS, Tomasini L, Ferrandino AF, Rosenberg Belmaker LA, Szekely A, Wilson M, Kocabas A, Calixto NE, Grigorenko EL, Huttner A, Chawarska K, Weissman S, Urban AE, Gerstein M, Vaccarino FM, Somatic copy number mosaicism in human skin revealed by induced pluripotent stem cells, Nature 492 (2012) 438–442. [DOI] [PMC free article] [PubMed] [Google Scholar]
- [26].Molyneaux BJ, Arlotta P, Menezes JR, Macklis JD, Neuronal subtype specification in the cerebral cortex, Nat Rev Neurosci 8 (2007) 427–437. [DOI] [PubMed] [Google Scholar]
- [27].Martin M, Cutadapt removes adapter sequences from high-throughput sequencing reads., EMBnet.Journal 17 (2011) 10–12. [Google Scholar]
- [28].Trapnell C, Pachter L, Salzberg SL, TopHat: discovering splice junctions with RNA-Seq, Bioinformatics 25 (2009) 1105–1111. [DOI] [PMC free article] [PubMed] [Google Scholar]
- [29].Mortazavi A, Williams BA, McCue K, Schaeffer L, Wold B, Mapping and quantifying mammalian transcriptomes by RNA-Seq, Nat Methods 5 (2008) 621–628. [DOI] [PubMed] [Google Scholar]
- [30].Trapnell C, Roberts A, Goff L, Pertea G, Kim D, Kelley DR, Pimentel H, Salzberg SL, Rinn JL, Pachter L, Differential gene and transcript expression analysis of RNA-seq experiments with TopHat and Cufflinks, Nat Protoc 7 (2012) 562–578. [DOI] [PMC free article] [PubMed] [Google Scholar]
- [31].Kent WJ, Sugnet CW, Furey TS, Roskin KM, Pringle TH, Zahler AM, Haussler D, The human genome browser at UCSC, Genome Res 12 (2002) 996–1006. [DOI] [PMC free article] [PubMed] [Google Scholar]
- [32].Trapnell C, Williams BA, Pertea G, Mortazavi A, Kwan G, van Baren MJ, Salzberg SL, Wold BJ, Pachter L, Transcript assembly and quantification by RNA-Seq reveals unannotated transcripts and isoform switching during cell differentiation, Nat Biotechnol 28 (2010) 511–515. [DOI] [PMC free article] [PubMed] [Google Scholar]
- [33].Zhou Z, Hong EJ, Cohen S, Zhao WN, Ho HY, Schmidt L, Chen WG, Lin Y, Savner E, Griffith EC, Hu L, Steen JA, Weitz CJ, Greenberg ME, Brain-specific phosphorylation of MeCP2 regulates activity-dependent Bdnf transcription, dendritic growth, and spine maturation, Neuron 52 (2006) 255–269. [DOI] [PMC free article] [PubMed] [Google Scholar]
- [34].Yasui DH, Peddada S, Bieda MC, Vallero RO, Hogart A, Nagarajan RP, Thatcher KN, Farnham PJ, Lasalle JM, Integrated epigenomic analyses of neuronal MeCP2 reveal a role for long-range interaction with active genes, Proc Natl Acad Sci U S A 104 (2007) 19416–19421. [DOI] [PMC free article] [PubMed] [Google Scholar]
- [35].Jordan C, Li HH, Kwan HC, Francke U, Cerebellar gene expression profiles of mouse models for Rett syndrome reveal novel MeCP2 targets, BMC Med Genet 8 (2007) 36. [DOI] [PMC free article] [PubMed] [Google Scholar]
- [36].Runkel F, Rohlmann A, Reissner C, Brand SM, Missler M, Promoter-like sequences regulating transcriptional activity in neurexin and neuroligin genes, J Neurochem 127 (2013) 36–47. [DOI] [PMC free article] [PubMed] [Google Scholar]
- [37].Fazzari P, Paternain AV, Valiente M, Pla R, Lujan R, Lloyd K, Lerma J, Marin O, Rico B, Control of cortical GABA circuitry development by Nrg1 and ErbB4 signalling, Nature 464 (2010) 1376–1380. [DOI] [PubMed] [Google Scholar]
- [38].Ting AK, Chen Y, Wen L, Yin DM, Shen C, Tao Y, Liu X, Xiong WC, Mei L, Neuregulin 1 promotes excitatory synapse development and function in GABAergic interneurons, J Neurosci 31 (2011) 15–25. [DOI] [PMC free article] [PubMed] [Google Scholar]
- [39].Li H, Chou SJ, Hamasaki T, Perez-Garcia CG, O’Leary DD, Neuregulin repellent signaling via ErbB4 restricts GABAergic interneurons to migratory paths from ganglionic eminence to cortical destinations, Neural Dev 7 (2012) 10. [DOI] [PMC free article] [PubMed] [Google Scholar]
- [40].Tong XJ, Hu Z, Liu Y, Anderson D, Kaplan JM, A network of autism linked genes stabilizes two pools of synaptic GABA(A) receptors, Elife 4 (2015) e09648. [DOI] [PMC free article] [PubMed] [Google Scholar]
- [41].Tapia M, Wandosell F, Garrido JJ, Impaired function of HDAC6 slows down axonal growth and interferes with axon initial segment development, PLoS One 5 (2010) e12908. [DOI] [PMC free article] [PubMed] [Google Scholar]
- [42].Yee AJ, Bensinger WI, Supko JG, Voorhees PM, Berdeja JG, Richardson PG, Libby EN, Wallace EE, Birrer NE, Burke JN, Tamang DL, Yang M, Jones SS, Wheeler CA, Markelewicz RJ, Raje NS, Ricolinostat plus lenalidomide, and dexamethasone in relapsed or refractory multiple myeloma: a multicentre phase 1b trial, Lancet Oncol 17 (2016) 1569–1578. [DOI] [PubMed] [Google Scholar]
- [43].Sugino K, Hempel CM, Okaty BW, Arnson HA, Kato S, Dani VS, Nelson SB, Cell-type-specific repression by methyl-CpG-binding protein 2 is biased toward long genes, J Neurosci 34 (2014) 12877–12883. [DOI] [PMC free article] [PubMed] [Google Scholar]
- [44].Chao HT, Chen H, Samaco RC, Xue M, Chahrour M, Yoo J, Neul JL, Gong S, Lu HC, Heintz N, Ekker M, Rubenstein JL, Noebels JL, Rosenmund C, Zoghbi HY, Dysfunction in GABA signalling mediates autism-like stereotypies and Rett syndrome phenotypes, Nature 468 (2010) 263–269. [DOI] [PMC free article] [PubMed] [Google Scholar]
- [45].Ure K, Lu H, Wang W, Ito-Ishida A, Wu Z, He LJ, Sztainberg Y, Chen W, Tang J, Zoghbi HY, Restoration of Mecp2 expression in GABAergic neurons is sufficient to rescue multiple disease features in a mouse model of Rett syndrome, Elife 5 (2016). [DOI] [PMC free article] [PubMed] [Google Scholar]
- [46].Stojanovic T, Capo I, Aronica E, Adle-Biassette H, Hoger H, Sieghart W, Kovacs GG, Milenkovic I, The alpha1, alpha2, alpha3, and gamma2 subunits of GABAA receptors show characteristic spatial and temporal expression patterns in rhombencephalic structures during normal human brain development, J Comp Neurol 524 (2016) 1805–1824. [DOI] [PubMed] [Google Scholar]
- [47].Ben-Ari Y, Khalilov I, Kahle KT, Cherubini E, The GABA excitatory/inhibitory shift in brain maturation and neurological disorders, Neuroscientist 18 (2012) 467–486. [DOI] [PubMed] [Google Scholar]
- [48].Tang X, Kim J, Zhou L, Wengert E, Zhang L, Wu Z, Carromeu C, Muotri AR, Marchetto MC, Gage FH, Chen G, KCC2 rescues functional deficits in human neurons derived from patients with Rett syndrome, Proc Natl Acad Sci U S A 113 (2016) 751–756. [DOI] [PMC free article] [PubMed] [Google Scholar]
- [49].Cellot G, Cherubini E, GABAergic signaling as therapeutic target for autism spectrum disorders, Front Pediatr 2 (2014) 70. [DOI] [PMC free article] [PubMed] [Google Scholar]
- [50].Shannon M, Albers G, Burkhart K, Liebelt E, Kelley M, McCubbin MM, Hoffman J, Massarella J, Safety and efficacy of flumazenil in the reversal of benzodiazepine-induced conscious sedation. The Flumazenil Pediatric Study Group, J Pediatr 131 (1997) 582–586. [DOI] [PubMed] [Google Scholar]
- [51].Gold WA, Lacina TA, Cantrill LC, Christodoulou J, MeCP2 deficiency is associated with reduced levels of tubulin acetylation and can be restored using HDAC6 inhibitors, J Mol Med (Berl) 93 (2015) 63–72. [DOI] [PubMed] [Google Scholar]
- [52].Simoes-Pires C, Zwick V, Nurisso A, Schenker E, Carrupt PA, Cuendet M, HDAC6 as a target for neurodegenerative diseases: what makes it different from the other HDACs?, Mol Neurodegener 8 (2013) 7. [DOI] [PMC free article] [PubMed] [Google Scholar]
Associated Data
This section collects any data citations, data availability statements, or supplementary materials included in this article.