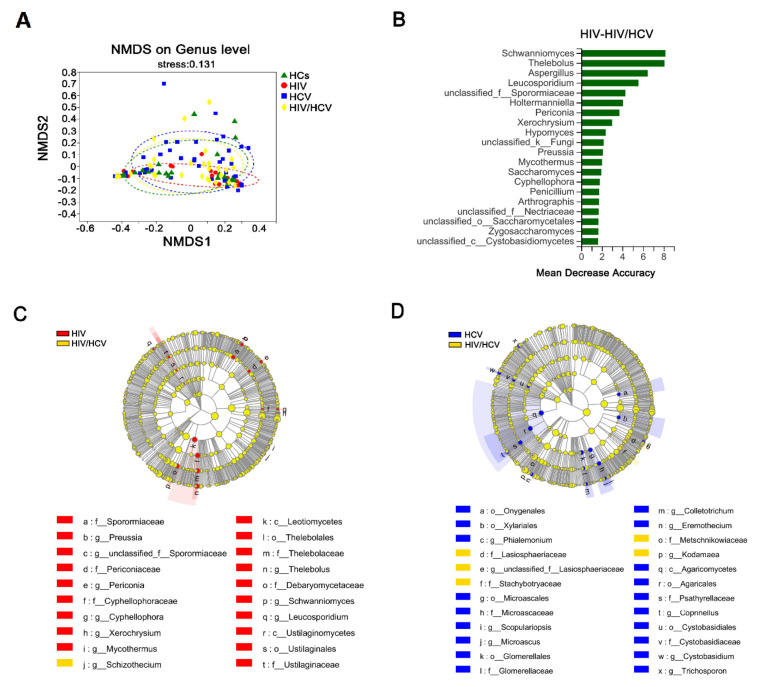
Figure 6.
Differences in the gut mycobiome between mono-infected groups co-infected group. (A) Fungal β-diversity (NMDS-based Bray–Curtis distance matrix) between the four groups at genus level. (B) Random forest graph showing the 20 most predictive fungal genera between HIV mono-infection and HIV/HCV co-infection patients. (C,D) show the LEfSe discriminant cladograms between the HIV or HCV mono-infection and co-infection groups (LDA= 2.5).

