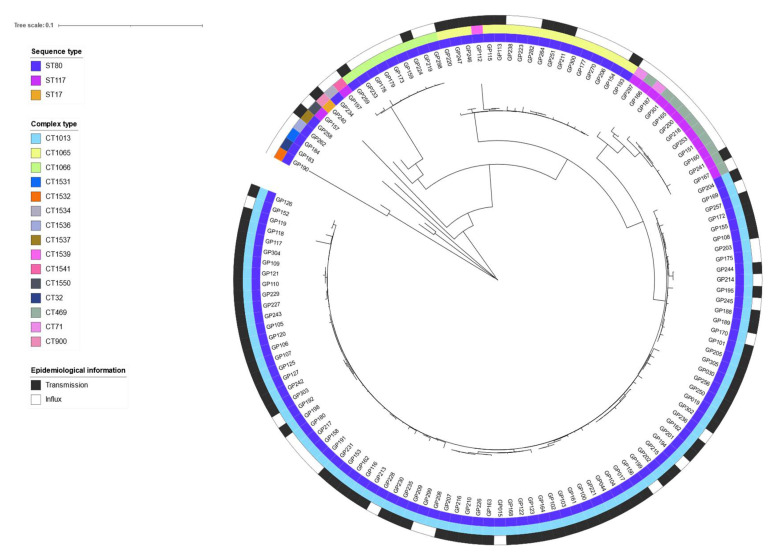
Figure 3.
Differentiation between nosocomial transmission and VRE influx in an outbreak in two interconnected hospitals in Southern Germany, October 2015–November 2019. The neighbor joining tree based on Nei’s DA distance depicts the genetic relatedness of 134 isolates for which information on hospital-acquisition or VRE-positivity upon admission was available. The inner ring represents the sequence type (ST), the middle ring represents the complex type (CT), and the outer ring represents the epidemiological information on VRE transmission (black) and VRE influx (white). Tree visualization was realized by using the free online tool iTol v6 (https://itol.embl.de/, accessed on 30 June 2022).

