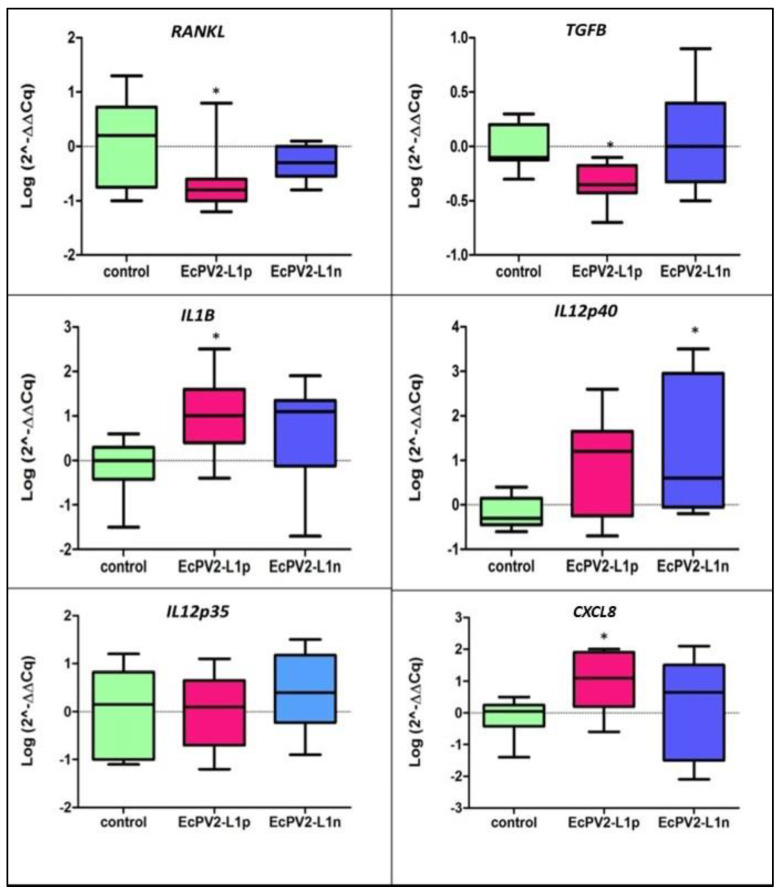
Figure 4.
Horse gene expression results. Data are represented as box-and-whisker plots displaying median and interquartile ranges (boxes) and minimum and maximum values (whiskers). Differences (control vs. EcPV2-L1p; control vs. EcPV2-L1n) were evaluated through ANOVA followed by Dunnett’s multiple comparison test or a Kruskal–Wallis test followed by Dunn’s multiple comparison test; * p < 0.05.

