

Abstract
Rodent and in vitro studies suggest that thiazolidinediones promote adipogenesis but there are few studies in humans to corroborate these findings. The purpose of this study was to determine whether pioglitazone stimulates adipogenesis in vivo and whether this process relates to improved insulin sensitivity. To test this hypothesis, 12 overweight/obese nondiabetic, insulin-resistant individuals underwent biopsy of abdominal subcutaneous adipose tissue at baseline and after 12 weeks of pioglitazone treatment. Cell size distribution was determined via the Multisizer technique. Insulin sensitivity was quantified at baseline and postpioglitazone by the modified insulin suppression test. Regional fat depots were quantified by computed tomography (CT). Insulin resistance (steady-state plasma insulin and glucose (SSPG)) decreased following pioglitazone (P < 0.001). There was an increase in the ratio of small-to-large cells (1.16 ± 0.44 vs. 1.52 ± 0.66, P = 0.03), as well as a 25% increase in the absolute number of small cells (P = 0.03). The distribution of large cell diameters widened (P = 0.009), but diameter did not increase in the case of small cells. The increase in proportion of small cells was associated with the degree to which insulin resistance improved (r = −0.72, P = 0.012). Visceral abdominal fat decreased (P = 0.04), and subcutaneous abdominal (P = 0.03) and femoral fat (P = 0.004) increased significantly. Changes in fat volume were not associated with SSPG change. These findings demonstrate a clear effect of pioglitazone on human subcutaneous adipose cells, suggestive of adipogenesis in abdominal subcutaneous adipose tissue, as well as redistribution of fat from visceral to subcutaneous depots, highlighting a potential mechanism of action for thiazolidinediones. These findings support the hypothesis that defects in subcutaneous fat storage may underlie obesity-associated insulin resistance.
INTRODUCTION
It has been postulated that a defect in adipogenesis and/or the capacity to store fat in subcutaneous adipose tissue may underlie insulin resistance and type 2 diabetes mellitus via increased circulating and ectopic fat deposition (1,2). Peroxisome proliferator-activated receptor γ-agonists dramatically enhance insulin sensitivity in vivo (3). The underlying mechanism for this effect is unclear, but decreases in circulating (4) and ectopic (5) fat have been demonstrated, suggesting that perhaps fat storage in adipose tissue is enhanced. In vitro, culture of ST 13 mouse preadipocytes or 3T3-L1 preadipocytes with peroxisome proliferator-activated receptor γ-stimulating thiazolidinedione compounds, promotes cell differentiation and lipid accumulation (6,7). Thus, the ability of these drugs to enhance insulin sensitivity in humans may be related to their capacity either to recruit newly differentiated fat cells, or to enlarge existing fat cells, thereby increasing lipid storage capacity in subcutaneous adipose tissue. Data in humans, however, is scant, and the mechanism of improved insulin sensitivity resulting from thiazolidinedione treatment remains unclear. In one published study in type 2 diabetic subjects, pioglitazone was reported to increase the proportion of small cells (8), but insulin sensitivity was not measured. In one study, troglitazone but not pioglitazone was reported to increase mean fat cell size (9), whereas in another, no change in fat cell size was seen (10). The complexity of these observations led us to readdress this question by quantifying insulin sensitivity and cell size characteristics of adipocytes before and after pioglitazone treatment in overweight/obese, nondiabetic individuals, classified as previously (11–13).
METHODS AND PROCEDURES
Healthy overweight or moderately obese subjects were recruited via newspaper advertisement in the cities surrounding Stanford University. Subjects were required to be 35–65 years of age, have a BMI 27.0–35.0 kg/m2 and stable weight for 3 months, be free of major organ disease, nondiabetic as defined by fasting plasma glucose concentration <7.0 mmol/l, and not taking lipid-lowering, diabetogenic, or weight loss medications. Subjects with a history of eating disorder, bariatric surgery, or liposuction were excluded, as were pregnant or lactating subjects. Subjects were required to be insulin resistant (see below). The study was approved by the Stanford University Human Subjects Committee and all subjects gave written, informed consent.
Insulin-mediated glucose disposal was quantified by a modification (14) of the insulin suppression test as originally described and validated (15,16). Briefly, subjects were infused for 240 min with octreotide (0.27 μg/m2·min) to suppress endogenous insulin secretion, insulin (25 mU/m2·min), and glucose (240 mg/m2·min). Blood was drawn at 10-min intervals from 210 to 240 min of the infusion to obtain the steady-state plasma insulin and glucose (SSPG) concentrations for each individual. As steady-state plasma insulin concentrations are similar in all subjects, the SSPG concentration provides a direct measure of the ability of insulin to mediate disposal of an infused glucose load: the higher the SSPG concentration, the more insulin resistant the individual. Insulin resistance was defined as SSPG concentration in the top 40th percentile of the SSPG distribution in 449 healthy individuals (11) as this group is at increased risk for diabetes and cardiovascular disease (12,13). Only insulin-resistant individuals were eligible to proceed with the pioglitazone intervention.
Clinical measurements obtained in the General Clinical Research Center after overnight fasting included lipid/lipoprotein concentrations; height and weight in light clothing; waist circumference measured at end-expiration, midway between the iliac crest and lower costal margin; race/ethnicity; and blood pressure (average of six). The volume of subcutaneous and visceral abdominal fat was quantified with computed tomography (CT) scans (California Advanced Imaging, Atherton, CA) done at L4–5. Using a Siemens Sensation 4 CT Scanner, with scan variables set to 120 kV, effective mass of 165, and a 40 cm field of view, 10 slices (1 cm thick area) of the abdomen through L4–5 were obtained. Femoral fat was quantified midway between the greater trochanter and patella of the right leg.
Subcutaneous abdominal fat biopsy was performed on a separate day, after an overnight fast. Under local anesthetic and sterile conditions, biopsy was performed via scalpel incision inferior to the umbilicus. Thirty milligram of adipose tissue was immediately fixed in osmium tetroxide and incubated in a water bath at 37 °C for 48 h as previously described (17), after which adipose cell size was determined via a Beckman Coulter (Miami, FL) Multisizer III with a 400-μm aperture. The effective cell-size range using this aperture is 20–240 μm. The instrument was set to count 6,000 particles and the fixed-cell suspension was diluted so that coincident counting was <10%. After collection of pulse sizes, the data were expressed as particle diameters and displayed as histograms of counts against diameter using linear bins and a linear scale for the x-axis. Cell size distribution was described via a mathematical model in which a formula with seven cell-size parameters was fit to the cell size distribution, as previously described (1). The small cells were represented by a double exponential, and the large cells by a Gaussian curve:
where x = cell diameter, and x0 = the smallest diameter; h1 and w1 = height and width of the first exponential; h2 and w2 = height and width of the second exponential; and hp, cp, and wp = height, center, and width-squared of the Gaussian curve. From these fitted curves the percentage of small cells (percent below the nadir) and the ratio of small-to-large cells (below and above nadir) were calculated. These as well as the peak diameter (diameter at which there was the greatest number of large cells in the Gaussian portion of the cell size curve) of the large cells, referred to as “peak center,” were the primary endpoints for statistical analyses. Because prior studies have referred to “mean diameter” of adipose cells, this variable was also evaluated, and was defined as the diameter corresponding to each linear bin in the Multisizer-generated histogram × relative frequency of that bin.
A secondary endpoint, the number of fat cells, was estimated by the following formula: cell number (N) = volume of subcutaneous abdominal adipose tissue/weighted volume/cell. Volume of adipose tissue was obtained from CT scans pre- and postpioglitazone, and average volume per cell was the weighted volume based on the relative number of cells per each given volume bin as represented by a cell volume histogram (generated by Multisizer software), as described by the following formula: average volume/cell (that is, the sum of the volumes corresponding to each bin × the relative frequency (p) of that bin (i)) (18). The number of small cells was then calculated by applying the percentage of small cells to the total number of cells, and the number of large cells was the difference between total and small cell number.
Pioglitazone was administered to eligible subjects at a dose of 30 mg daily for the first 4 weeks, followed by 45 mg daily for the final 8 weeks, after which metabolic testing and fat biopsy were repeated.
Statistical analysis was conducted with Systat 10.2 (SPSS, Cary, NC). Comparisons of pre- vs. postpioglitazone values utilized paired Student’s t-tests for normally-distributed variables and the Wilcoxon signed rank test for non-normally distributed data (trigyceride, peak width, and ratio of small-to-large cells). Simple linear regression was used to determine association between change in insulin sensitivity and change in cell size indices. Data are presented as mean ± s.d. P < 0.05 was considered statistically significant.
RESULTS
The study population consisted of three women and nine men, primarily of white (n = 5) or Asian (n = 4) ancestry, with a mean ± s.d. age of 55 ± 8 years, and BMI of 31.0 ± 2.9 kg/m2. The effects of pioglitazone on clinical and metabolic variables are shown in Table 1. Pioglitazone administration was associated with a significant decrease in SSPG concentration from 12.50 ± 1.78 mg/dl to 8.89 ± 1.94 mg/dl (P < 0.001). Fasting plasma glucose concentration declined (P = 0.04), but none of the other metabolic variables measured changed significantly. It is of note that pioglitazone treatment was associated with a small, but statistically significant increase in weight (92.8 ± 11.0–94.7 ± 11.6 kg, P = 0.002), but not waist circumference (104 ± 8 to 105 ± 9 cm, P = 0.39).
Table 1.
Clinical, laboratory, and cell size characteristics before and after pioglitazone in 12 insulin-resistant subjects (mean ± s.d.)
| Variable | Before | After | P value |
|---|---|---|---|
| Clinical characteristics | |||
| Weight (kg) | 92.8 + 11 | 94.7 + 11.6 | 0.002 |
| BMI (kg/m2) | 31.2 + 2.9 | 31.8 + 3.0 | 0.002 |
| Laboratory characteristics | |||
| SSPG (mmol/l) | 12.50 + 1.78 | 8.89 + 1.94 | <0.0001 |
| Fasting glucose (mmol/l) | 5.72 + 0.61 | 5.22 + 0.44 | 0.04 |
| Cholesterol (mmol/l) | 4.94 + 1.00 | 4.99 + 0.75 | 0.93 |
| Triglycerides (mmol/l) | 1.35 + 0.96 | 1.15 + 0.72 | 0.23a |
| LDL-C (mmol/l) | 3.28 + 0.96 | 3.34 + 0.65 | 0.97 |
| HDL-C (mmol/l) | 1.06 + 0.18 | 1.14 + 0.23 | 0.25 |
| Systolic blood pressure (mm Hg) | 134 + 12 | 133 + 10 | 0.81 |
| Diastolic blood pressure (mm Hg) | 80 + 6 | 78 + 6 | 0.34 |
| Cell size characteristics | |||
| Mean diameter (μm) | 74 + 8 | 70 + 7 | 0.13 |
| Nadir (μm) | 74.5 + 11.5 | 76.9 + 6.5 | 0.35 |
| % small cells | 51.9 + 9.5 | 58.1 + 9.6 | 0.03a |
| Ratio small/large cells | 1.16 + 0.44 | 1.52 + 0.66 | 0.03a |
| Small cell number | 1.66 × 10⁸ + 4.47 × 10⁷ | 2.08 × 10⁸ + 5.36 × 10⁷ | 0.03 |
| Large cell number | 1.55 × 10⁸ + 6.27 × 10⁷ | 1.52 × 10⁸ + 6.31 × 10⁷ | 0.80 |
| Peak center (μm) | 113 + 13 | 115 + 9 | 0.45 |
| Height at peak center (μm−1) | 0.007 + 0.002 | 0.005 + 0.002 | 0.004 |
| Peak width (μm2) | 686 + 157 | 977 + 397 | 0.009 |
Wilcoxon signed rank test.
Comparison of the CT-determined regional fat depots, shown in Figure 1, reveals an increase in the volume of subcutaneous abdominal fat (129 ± 41 to 142 ± 49 cm3, P < 0.04) and femoral fat (42 ± 17 to 52 ± 21 cm3, P = 0.004), with a reciprocal decrease in the volume of visceral abdominal fat (60 ± 29 to 53 ± 29 cm3, P = 0.04) following pioglitazone administration. Changes in fat volume did not correlate with change in SSPG.
Figure 1.
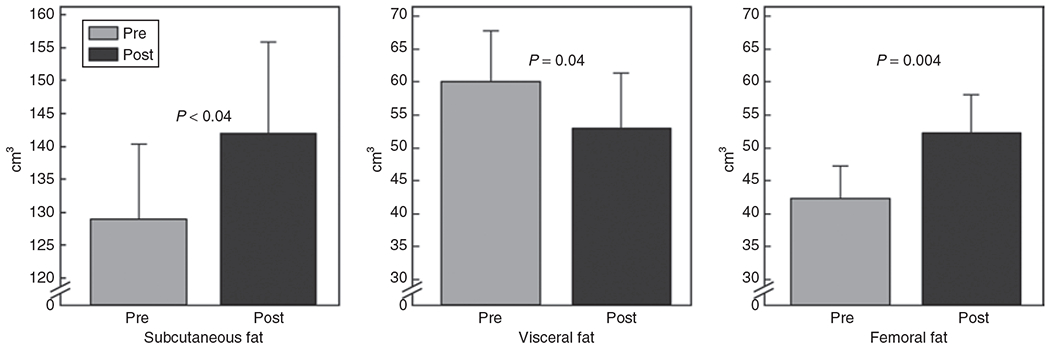
Change in abdominal and femoral fat distribution as a result of pioglitazone treatment (mean ± s.e.m.).
Adipose cell size distribution after pioglitazone, as compared with baseline (Table 1), demonstrated a statistically significantly increased proportion of small cells, quantified as the percentage of cells below the nadir or the ratio of small-to-large cells. Peak center did not change significantly, but the width-squared of the Gaussian increased significantly, and the height of the Gaussian decreased significantly, consistent with more variability in diameter of the large cell population. These changes in the cell size distribution are illustrated in Figure 2, which depicts both the raw data (from an individual subject) from which Multisizer curves are generated, and the Multisizer fitted curves averaged for all 12 subjects before and after pioglitazone. The absolute number of small cells increased by 25% after pioglitazone treatment (P = 0.03), whereas the number of large cells did not change significantly.
Figure 2.
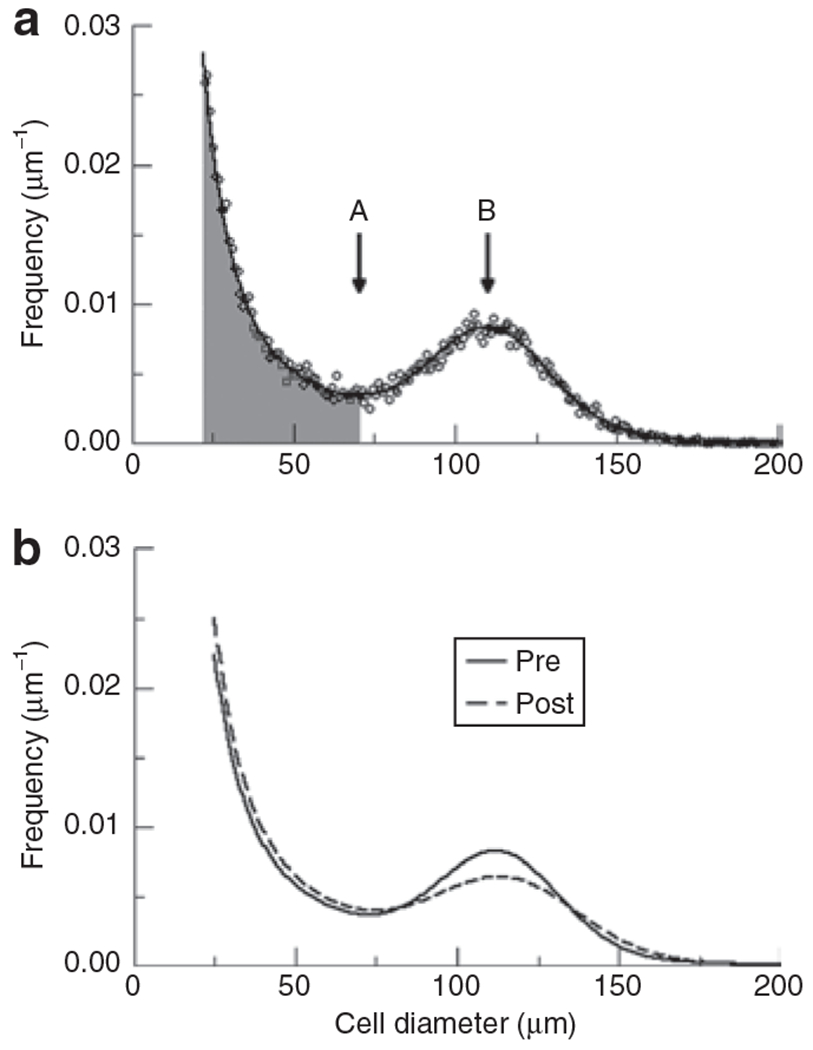
Adipose cell size distribution. (a) Individual datapoints for one individual showing cell size distribution as depicted by Multisizer III: A represents nadir and B represents peak diameter of large cells. Cells in shaded area represent the small cell fraction and those in unshaded represent large cell fraction. (b) Fitted curves generated by Multisizer software using average parameters for the 12 subjects pre- and postpioglitazone. Thick line represents average cell size distribution pre-pioglitazone, and thin line represents average cell size distribution postpioglitazone.
The results in Figure 3a indicate that there was a statistically significant inverse relationship between the increase in ratio of small-to-large adipose cells following pioglitazone treatment and the change in SSPG concentration (r = −0.72, P = 0.012), demonstrating that the greater the increase in the ratio of small-to-large cells, the greater the reduction in insulin resistance. There was no correlation between change in peak center and change in SSPG, as shown in Figure 3b.
Figure 3.
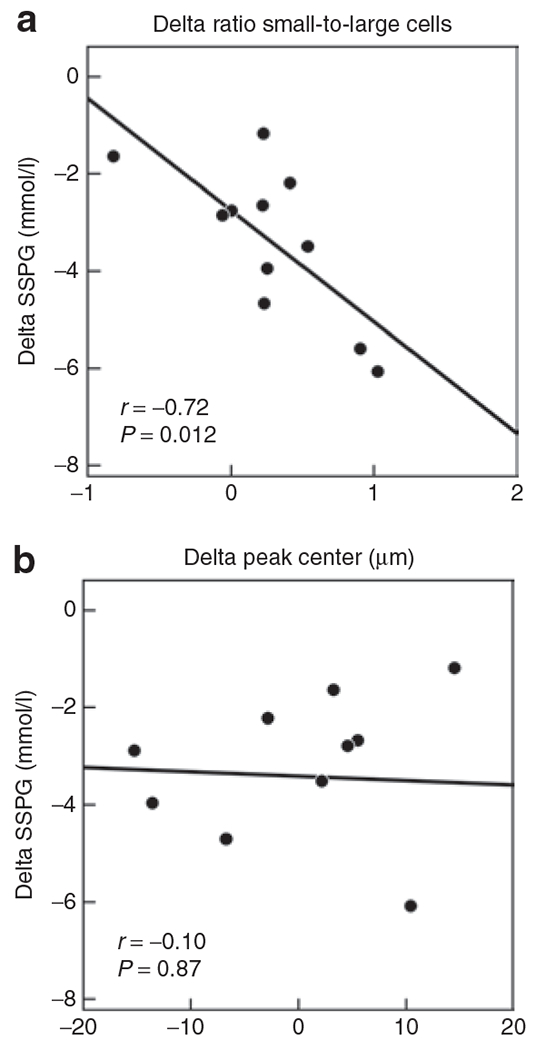
Correlation between change in cell size distribution parameters and change in SSPG during 12 weeks of pioglitazone. (a) Correlation between change in ratio of small-to-large adipose cells (delta = post–pre-pioglitazone: thus positive number indicates increase in ratio) and change in SSPG (delta = post–pre-pioglitazone: thus negative number indicates decrease in SSPG and improved insulin sensitivity). (b) Correlation between change in peak diameter (delta = post–pre-pioglitazone) of the large cells and change in SSPG (delta = post–pre-pioglitazone).
DISCUSSION
The main finding of this study is that pioglitazone administration in insulin-resistant, moderately obese humans is associated with an increase in the population of small adipose cells. The number of small cells increased but there was no significant change in the number of large cells, suggesting that this change in cell size distribution was likely due to an increase in differentiation of preadipocytes to adipocytes rather than decrease in size of existing large cells. Our data support the results of studies showing that that in Zucker (fa/fa) rats, pioglitazone administration increased the proportion of small adipose cells; resulted in visible new clusters of small cells; increased DNA content per mg tissue, consistent with more cells; and upregulated lipogenic enzymes (e.g., fatty acid synthase) (19). Gene expression studies in humans have shown peroxisome proliferator-activated receptor γ agonists to increase expression of genes related to fat storage (20,21) and adipose cell differentiation (22), and incubation of preadipocytes from human subcutaneous and omental fat with thiazolidinediones increased activity of glycerol 3-phosphate dehydrogenase and increased lipid accumulation three- to fourfold in subcutaneous, but not omental adipose tissue (23). Our results also support those of a single previous report in humans of increased proportion of small adipose cells after pioglitazone treatment (8). In the context of the well-established ability of peroxisome proliferator-activated receptor γ agonists to stimulate differentiation of 3T3-L1 preadipocytes (6,7) and the studies mentioned above, the results of the current study support the notion that pioglitazone stimulates adipogenesis in humans.
A second important finding of this study is the strong correlation between the degree to which the proportion of small cells increased and the degree to which insulin sensitivity improved. Although it is well-established that thiazolidinediones enhance insulin-mediated glucose uptake in skeletal muscle, the mechanism by which this occurs continues to be less than clear, particularly as these compounds primarily bind nuclear receptors in adipose cells. One possibility consistent with our results and prior studies is that by increasing transcription of genes related to adipose cell differentiation and fat storage, circulating and ectopic fat is decreased. Indeed, it is plausible that insulin resistance associated with common obesity is due to a relative deficit in fat storage capacity of subcutaneous fat, and pioglitazone reduces insulin resistance by expanding the fat storage reservoir, so that triglyceride need not circulate to be deposited in non-adipose tissues. As such, although we cannot prove causality, our results lend support to the possibility that subcutaneous adipose cell differentiation is one mechanism by which the thiazolidinedione class of drugs improves insulin sensitivity.
The results of this study are not incompatible with prior reports of increased (9) or unchanged (10) mean cell size, as the latter measure does not distinguish between effects on small vs. large cells in a bimodal distribution. The broadening and flattening of our peak of large cells suggests that thiazolidinediones lead to remodeling of mature cells as well as stimulating adipogenesis. Rat studies have shown that pioglitazone led to remodeling of the large and intermediate-sized subpopulations of adipose cells (19), with apparent merging of a new peak of small cells with the large cells in sequential time points from the ovarian depot. Smith et al. showed a decrease in percentage of large cells, but increased percentage of very large cells (8) in diabetic humans. What exactly our widened Gaussian curve represents is unclear but it is possible that it includes small cells that are merging with the large cell population and some large cells that enlarged further as compared with baseline. Alternatively, there could be both enlargement and shrinkage of mature cells, but this is not discernable from the current study.
In the current study, pioglitazone administration was associated with an increase in subcutaneous abdominal and femoral fat, and a concurrent decrease in visceral fat. Other reports have yielded mixed results (24–31), with some showing decreases visceral and increased subcutaneous fat volume (24,25), and one showing increased femoral fat (31). It is possible that the lipogenic effects of thiazolidinediones differ according to fat depot. Indeed, the fat storage response to pioglitazone was previously shown to be significantly greater in subcutaneous abdominal than in omental adipose tissue (23). Whether or not the increase in small cells in subcutaneous adipose tissue in our study was responsible for the decrease in visceral compartment is unclear, as is the effect of pioglitazone administration on the cell size distribution of omental adipose cells.
Our study is limited by having sampled tissue from only the abdominal subcutaneous adipose depot, and thus the results presented may not pertain to other fat depots. Additionally, we did not randomize control subjects to placebo or nontreatment. It is unlikely, however, that the changes seen in our subjects occurred simply as a result of having performed a second biopsy, as they were directional, and we have previously observed no change in the ratio of small-to-large cells following dietary weight loss (T. McLaughlin, G.M. Reaven, S.W. Cushman, and A. Sherman, unpublished data). Furthermore, the correlation between change in small cells and insulin sensitivity suggests that both of these effects were related to the pioglitazone intervention.
The results presented raise important new questions about the significance of changes in small vs. large cells following thiazolidinedione treatment. Indeed, our previous cross-sectional study (1) found a higher proportion of small cells in insulin-resistant, not insulin-sensitive, subjects. Are the small cells in untreated, insulin-resistant subjects deficient in lipid storage potential, whereas small cells recruited by drug treatment are able to grow up to become large cells, as suggested by rat studies (19)? Increased size of large adipose cells would be more effective in increasing fat storage capacity, but an increased population of subcutaneous small cells may be adequate to receive fat redistributed from the smaller visceral compartment, and/or may be in the process of enlarging to mature lipid-storing cells. Further studies to examine the quality, as well as the quantity, of both small and large cells after treatment are needed.
In conclusion, we have demonstrated that pioglitazone treatment in nondiabetic obese humans is associated with an increase in the relative and total number of small adipose cells, as well as increased variability in the size of the large adipose cells. Furthermore, the increase in proportion of small cells is highly and significantly associated with improvement in insulin sensitivity, suggesting a link between changes in adipose cells and insulin-mediated glucose uptake in skeletal muscle. Finally, pioglitazone significantly increased two depots of subcutaneous fat but decreased visceral abdominal fat, which is not inconsistent with the cell size changes, although we did not sample visceral fat for comparison. Overall, these findings are consistent with the paradigm proposed by us (1) and others (2,32) that insulin-resistant obese individuals have a decrease in fat storage capacity in their subcutaneous adipose tissue, likely due to impaired differentiation of adipose cells in the setting of increased storage demands. Given this formulation, it is plausible that the improvement in insulin sensitivity following pioglitazone treatment is related to its ability to promote adipogenesis and fat storage capacity in subcutaneous adipose tissue.
ACKNOWLEDGMENTS
This work was supported by study grants: NIH/NIDDK 1 R01 DK071309-01, 5K23 RR16071, 1RO1 DK071333, NIH RR 000070, the NIDDK Intramural Research Program, and Takeda Pharmaceuticals.
DISCLOSURE
G.M.R. has received research funding from Takeda Pharmaceuticals. Other authors declared no conflict of interest.
REFERENCES
- 1.McLaughlin T, Sherman A, Tsao P et al. Enhanced proportion of small adipose cells in insulin-resistant vs insulin-sensitive obese individuals implicates impaired adipogenesis. Diabetologia 2007;50:1707–1715. [DOI] [PubMed] [Google Scholar]
- 2.Danforth E Jr. Failure of adipocyte differentiation causes type II diabetes mellitus? Nat Genet 2000;26:13. [DOI] [PubMed] [Google Scholar]
- 3.Saltiel AR, Olefsky JM. Thiazolidinediones in the treatment of insulin resistance and type II diabetes. Diabetes 1996;45:1661–1669. [DOI] [PubMed] [Google Scholar]
- 4.Boden G, Cheung P, Mozzoli M, Fried SK. Effect of thiazolidinediones on glucose and fatty acid metabolism in patients with type 2 diabetes. Metab Clin Exp 2003;52:753–759. [DOI] [PubMed] [Google Scholar]
- 5.Teranishi T, Ohara T, Maeda K et al. Effects of pioglitazone and metformin on intracellular lipid content in liver and skeletal muscle of individuals with type 2 diabetes mellitus. Metab Clin Exp 2007;56:1418–1424. [DOI] [PubMed] [Google Scholar]
- 6.Hiragun A, Sato M, Mitsui H. Preadipocyte differentiation in vitro: identification of a highly active adipogenic agent. J Cell Physiol 1988;134:124–130. [DOI] [PubMed] [Google Scholar]
- 7.Sandouk T, Reda D, Hofmann C. Antidiabetic agent pioglitazone enhances adipocyte differentiation of 3T3-F442A cells. Am J Physiol 1993;264:C1600–C1608. [DOI] [PubMed] [Google Scholar]
- 8.Smith SR, Xie H, Baghian S, Needham A, McNeil M, Bogacka I, Bray GA: Pioglitazone changes the distribution of adipocyte size in type 2 diabetics. Adipocytes 2006; 2:11–22. [Google Scholar]
- 9.Ciaraldi TP, Kong AP, Chu NV et al. Regulation of glucose transport and insulin signaling by troglitazone or metformin in adipose tissue of type 2 diabetic subjects. Diabetes 2002;51:30–36. [DOI] [PubMed] [Google Scholar]
- 10.Shadid S, Jensen MD: Effects of pioglitazone versus diet and exercise on metabolic health and fat distribution in upper body obesity. Diabetes Care 2003; 11:3148–3152. [DOI] [PubMed] [Google Scholar]
- 11.Yeni-Komshian H, Carantoni M, Abbasi F, Reaven GM. Relationship between several surrogate estimates of insulin resistance and quantification of insulin-mediated glucose disposal in 490 healthy nondiabetic volunteers. Diabetes Care 2000;23:171–175. [DOI] [PubMed] [Google Scholar]
- 12.Yip J, Facchini FS, Reaven GM. Resistance to insulin-mediated glucose disposal as a predictor of cardiovascular disease. J Clin Endocrinol Metab 1998;83:2773–2776. [DOI] [PubMed] [Google Scholar]
- 13.Facchini FS, Hua N, Abbasi F, Reaven GM. Insulin resistance as a predictor of age-related diseases. J Clin Endocrinol Metab 2001;86:3574–3578. [DOI] [PubMed] [Google Scholar]
- 14.Pei D, Jones CN, Bhargava R, Chen YD, Reaven GM. Evaluation of octreotide to assess insulin-mediated glucose disposal by the insulin suppression test. Diabetologia 1994;37:843–845. [DOI] [PubMed] [Google Scholar]
- 15.Shen SW, Reaven GM, Farquhar JW. Comparison of impedance to insulin-mediated glucose uptake in normal subjects and in subjects with latent diabetes. J Clin Invest 1970;49:2151–2160. [DOI] [PMC free article] [PubMed] [Google Scholar]
- 16.Greenfield MS, Doberne L, Kraemer F, Tobey T, Reaven G. Assessment of insulin resistance with the insulin suppression test and the euglycemic clamp. Diabetes 1981;30:387–392. [DOI] [PubMed] [Google Scholar]
- 17.Hirsch J, Knittle JL. Cellularity of obese and nonobese human adipose tissue. Fed Proc 1970;29:1516–1521. [PubMed] [Google Scholar]
- 18.Jo J, Gavrilova O, Pack S, Jou W, Mullen S, Sumner AE, Cushman SW, Periwal V. Hypertrophy and/or hyperplasia: dynamics of adipose tissue growth. PLoS Comput Biol 2009, 5:1–11. [DOI] [PMC free article] [PubMed] [Google Scholar]
- 19.de Souza CJ, Eckhardt M, Gagen K et al. Effects of pioglitazone on adipose tissue remodeling within the setting of obesity and insulin resistance. Diabetes 2001;50:1863–1871. [DOI] [PubMed] [Google Scholar]
- 20.Kolak M, Yki-Järvinen H, Kannisto K et al. Effects of chronic rosiglitazone therapy on gene expression in human adipose tissue in vivo in patients with type 2 diabetes. J Clin Endocrinol Metab 2007;92:720–724. [DOI] [PubMed] [Google Scholar]
- 21.Bogacka I, Xie H, Bray GA, Smith SR. The effect of pioglitazone on peroxisome proliferator-activated receptor-gamma target genes related to lipid storage in vivo. Diabetes Care 2004;27:1660–1667. [DOI] [PubMed] [Google Scholar]
- 22.Hammarstedt A, Sopasakis VR, Gogg S, Jansson PA, Smith U. Improved insulin sensitivity and adipose tissue dysregulation after short-term treatment with pioglitazone in non-diabetic, insulin-resistant subjects. Diabetologia 2005;48:96–104. [DOI] [PubMed] [Google Scholar]
- 23.Adams M, Montague CT, Prins JB et al. Activators of peroxisome proliferator-activated receptor gamma have depot-specific effects on human preadipocyte differentiation. J Clin Invest 1997;100:3149–3153. [DOI] [PMC free article] [PubMed] [Google Scholar]
- 24.Miyazaki Y, Mahankali A, Matsuda M et al. Effect of pioglitazone on abdominal fat distribution and insulin sensitivity in type 2 diabetic patients. J Clin Endocrinol Metab 2002;87:2784–2791. [DOI] [PubMed] [Google Scholar]
- 25.Kelly IE, Han TS, Walsh K, Lean ME. Effects of a thiazolidinedione compound on body fat and fat distribution of patients with type 2 diabetes. Diabetes Care 1999;22:288–293. [DOI] [PubMed] [Google Scholar]
- 26.Mori Y, Murakawa Y, Okada K et al. Effect of troglitazone on body fat distribution in type 2 diabetic patients. Diabetes Care 1999;22:908–912. [DOI] [PubMed] [Google Scholar]
- 27.Kim SK, Hur KY, Kim HJ et al. The increase in abdominal subcutaneous fat depot is an independent factor to determine the glycemic control after rosiglitazone treatment. Eur J Endocrinol 2007;157:167–174. [DOI] [PubMed] [Google Scholar]
- 28.Thomas EL, Potter E, Tosi I et al. Pioglitazone added to conventional lipid-lowering treatment in familial combined hyperlipidaemia improves parameters of metabolic control: relation to liver, muscle and regional body fat content. Atherosclerosis 2007;195:e181–e190. [DOI] [PubMed] [Google Scholar]
- 29.Basu A, Jensen MD, McCann F et al. Effects of pioglitazone versus glipizide on body fat distribution, body water content, and hemodynamics in type 2 diabetes. Diabetes Care 2006;29:510–514. [DOI] [PubMed] [Google Scholar]
- 30.Smith SR, De Jonge L, Volaufova J et al. Effect of pioglitazone on body composition and energy expenditure: a randomized controlled trial. Metab Clin Exp 2005;54:24–32. [DOI] [PubMed] [Google Scholar]
- 31.Shadid S, Jensen MD. Effects of pioglitazone versus diet and exercise on metabolic health and fat distribution in upper body obesity. Diabetes Care 2003;26:3148–3152. [DOI] [PubMed] [Google Scholar]
- 32.Heilbronn L, Smith SR, Ravussin E. Failure of fat cell proliferation, mitochondrial function and fat oxidation results in ectopic fat storage, insulin resistance and type II diabetes mellitus. Int J Obes Relat Metab Disord 2004;28(Suppl 4):S12–S21. [DOI] [PubMed] [Google Scholar]