Abstract
The focus of this research was to understand the effects of formulation and processing variables on the very-rapidly dissolving printlets of isoniazid (INH) manufactured by the selective laser sintering (SLS) three-dimensional (3D) printing method, and to characterize their physicochemical properties, stability, and pharmacokinetics. Fifteen printlet formulations were manufactured by varying the laser scanning speed (400−500 mm/s, X1), surface temperature (100−110 °C, X2), and croscarmellose sodium (CCS, %, X3), and the responses measured were weight (Y1), hardness (Y2), disintegration time (DT, Y3), and dissolution (Y4). Laser scanning was the most important processing factor affecting the responses. DT was very rapid (≥3 s), and dissolution (>99%) was completed within 3 min. The root-mean-square error in the studied responses was low and analysis of variance (ANOVA) was statistically significant (p < 0.05). X-ray micro-computed tomography (micro-CT) images showed very porous structures with 24.6−34.4% porosity. X-ray powder diffraction and differential scanning calorimetry data indicated partial conversion of the crystalline drug into an amorphous form. The printlets were stable at 40 °C/75% RH with no significant changes in assay and dissolution. Pharmacokinetic profiles of the printlets and compressed tablets were superimposable. In conclusion, the rapidly dissolving printlets of the INH were stable, and oral bioavailability was similar to that of compositionally identical compressed tablets.
Keywords: isoniazid, printlets, selective laser sintering, recyclability, stability, pharmacokinetics
Graphical Abstract
INTRODUCTION
Globally, tuberculosis (TB) is the leading cause of death by infectious diseases.1 A total of 1.4 million deaths were reported from TB in 2019. An estimated 10 million new TB infections were reported in 2019, which includes 1.2 million children.2 The rate of TB infection is 2.7/100,000 and an estimated 13 million people are living with latent TB in USA alone.3 Tuberculosis (TB) is caused by the bacterium, Mycobacterium tuberculosis. The organism mostly attacks the lung, but it can attack any part of the body, such as the kidney, spine, and brain. Not everyone infected with TB develops the disease. In latent TB infection, the bacteria remain inactive for a lifetime without causing the disease.4−6 Treatment of TB disease involves administration of three or four drugs for 3−12 months.7 Latent TB is treated with single or two anti-TB drugs.8 The therapeutic regimen of TB disease typically includes isoniazid (INH) as one of the drugs.7,8
INH is a first-line anti-TB drug and forms the core of the treatment regimen for both TB disease and latent TB. Chances to develop resistance to INH are very high when it is used alone. Hence, it is administered with other first-line TB drugs such as ethambutol, rifampin, or pyrazinamide.9,10 It was discovered in 1912 and FDA approved it as a drug in 1952.11,12 It is approved for clinical use in both children and adults. Pediatric dose of INH is 10−20 mg/kg with maximum dose limit of 300 mg.8 Its oral bioavailability is almost complete but is affected by food. The oral bioavailability is 93 and 78% in fasted and fed state, respectively.13,14 FDA-approved dosage forms of INH include tablet, syrup, and injection.15 However, all of the dosage forms of INH are discontinued in the US market due to commercial reasons. Healthcare professionals in USA are entirely dependent on the pharmacy to fill prescriptions of INH with extemporanous preparation. However, NIH, FDA, and healthcare professionals raised concern about the quality, safety, and efficacy of compounded medicines.16 The National Institutes of Health listed a priority need for pediatric formulations of INH in 2020−2021 due to its acute need in USA.17
Pediatric patients need dose-flexible delivery systems due to the evolving physiology of children where fixed dosage forms will not work. An ideal pediatric drug delivery system should have the ability to titrate the doses (dose flexibility) so that a wide age group (0−17 years) of children can be covered by a single product.18,19 In general, solid-dosage forms can be used to deliver unit dosage forms. Unlike the liquid-dosage forms, solid-dosage forms are more stable and easier to handle with less probability of microbial contamination. However, dose adjustment/flexibility is difficult to achieve in solid-dosage forms, as each dose strength has to be manufactured separately, which is not a cost-effective business model. The other option would be to manufacture each strength at the point of dispensing, which is not feasible in pharmacy settings. Newer manufacturing methods such as three-dimensional (3D) printing can be used for dose-tailored or flexible solid-dosage forms, and can be manufactured in a clinical hospital environment, where resources may be limited.20,21
Three-dimensional printed pediatric dosage forms offer many advantages. The dosage forms can be designed to be highly porous so that they can melt/dissolve over the tongue or can be dispersed in a liquid just before administration to the children.22,23 The three-dimensional printed technologies reported for pharmaceutical applications are fused deposition modeling (FDM), stereolithography (SLA), binder jetting (BJ), and selective laser sintering (SLS).20,23 FDM and SLS are most widely explored for pharmaceutical use.24−27 The less-explored techniques are BJ and SLS.20,28−30 Each technology has its own requirement in terms of the physical form of the raw material and stability. For SLS and FDM, the drug and excipients should be thermally stable. FDM and SLS require filament and powder form of the drug and excipients, respectively. Similar to SLS and FDM, BJ needs the powder form of the excipients and drug, but also need a liquid as a binding agent. The liquid may be water, organic, or organic−water mixture with or without a low-molecular-weight/viscosity polymer. However, this technique is not suitable for drugs/excipients that degrade in the presence of solvent/water. Pharmaceutically approved, generally recognized as safe (GRAS)-category excipients can be used in FDM, SLS, and BJ methods. SLA needs a UV-polymerizable liquid oligomer in which the drug should be soluble or dispersed in colloidal particle size range. Furthermore, the drug and oligomer/excipients should be photostable. Oligomers are low-molecular-weight thermoplastic polymers consisting of monomers, dimers, trimers, or their mixture. The explored oligomers for the SLA printing process are, e.g., poly(ethylene glycol diacrylate), polycaprolactone dimethylacrylate, poly(2-hydroxyethyl methacrylate), poly(ethylene glycol) dimethacrylate, and poly(propylene fumarate)/diethyl fumarate. Similarly, the initiators reported in literature are diphenyl(2,4,6-trimethylbenzoyl) phosphine oxide, 1-[4-(2-hydroxyethoxy)-phenyl]-2-hydroxy-2-methyl-1-propane-1-one (Irgacure 2959), 2-hydroxy-4′-(2-hydroxyethoxy)-2-methylpropiophenone (Darcure 2959), etc.20 However, none of the explored oligomers is listed in the pharmaceutically approved GRAS category. Both BJ and SLA require post-printing steps such as UV curing or solvent removal by heating in an oven.20−23 The SLS process has not been extensively explored for pharmaceutical applications.20,23 The objective of this research was to develop dose-flexible very-rapidly disintegrating and dissolving printlets of INH with the SLS method and characterize their physicochemical, stability, and pharmacokinetic attributes.
MATERIALS AND METHODS
Materials.
INH was obtained from Alfa Aesar, Haverhill, MA; croscarmellose sodium from CCS, Spectrum, NJ; Candurin NXT Ruby Red from Merck, Darmstadt, Germany; and Kollicoat IR from BASF, Ludwigshafen, Germany. Methanol (MeOH), glacial acetic acid, acetonitrile (ACN), acepromazine, and formic acid were purchased from Fisher Scientific, Asheville, NC. Deuterated INH (INH-d4) was obtained from Toronto Research Chemicals, Ontario, Canada. Heparinized rabbit plasma was purchased from BioChemed Services, Winchester, VA. All reagents were of analytical grade and used as received.
Methods.
Box−Behnken Design of Experiments.
Initial trials were performed to determine the range of formulation and processes variables to understand their interplay. The selected independent variables were laser scanning speed (X1) 400−500 mm/s, CCS (X2) 0−15%, and surface temperature (X3) 100−110 °C. The Box−Behnken experimental design matrix was created to understand the effect of independent variables on the dependent variables. The dependent variables selected were weight (Y1), hardness (Y2), disintegration time (DT) (Y3), and dissolution (Y4). Fifteen runs were generated using JMP 15 software (SAS, Cary, NC) with three center points to assess the reproductivity of the experiment (Table 1).
Table 1.
Box−Behnken Experimental Design Matrix
| level | |||
|---|---|---|---|
| parameters | low | medium | high |
| laser speed (X1, mm/s) | 400 | 450 | 500 |
| croscarmellose sodium (X2, %) | 0 | 5 | 10 |
| chamber temperature (X3, °C) | 100 | 105 | 110 |
| formulations | X1 (mm/s) | X2 (%) | X3, (°C) |
|---|---|---|---|
| F1 | 500 | 10 | 105 |
| F2 | 450 | 5 | 105 |
| F3 | 450 | 0 | 100 |
| F4 | 450 | 10 | 100 |
| F5 | 400 | 10 | 105 |
| F6 | 400 | 0 | 105 |
| F7 | 450 | 0 | 110 |
| F8 | 400 | 5 | 110 |
| F9 | 500 | 0 | 105 |
| F10 | 500 | 5 | 100 |
| F11 | 400 | 5 | 100 |
| F12 | 450 | 5 | 105 |
| F13 | 500 | 5 | 110 |
| F14 | 450 | 10 | 110 |
| F15 | 450 | 5 | 105 |
Printlet Manufacturing.
The printlet composition was INH—50%, Candurin NXT Ruby Red—3%, CCS—0−10%, and Kollicoat IR—37−47%. The components were passed through a 150 μm pore sieve (ASTM sieve #100) to eliminate the effect of particle size. Powder mixtures were blended in V-blender, Model VH-2 for 5 min. A batch of 63 (9 × 7) printlets of 4.5 mm diameter × 3 mm height was prepared using the process parameters surface temperatures, chamber temperature, laser scanning speed, powder layering thickness, whose values were set as 100−110 °C, 100 °C, 400−500 mm/s, and 0.15 mm, respectively. The powder was sintered using 2.3 W blue laser (445 nm). The printlets were allowed to cool down, and then removed from the powder bed. The printlets were characterized for weight, diameter, and thickness by a vernier caliper. The disintegration time (DT) of six printlets was determined in water at 37 °C using a USP disintegration apparatus (Vankel Varian VK-100, NC).
Hardness.
Tablet hardness was characterized by a texture analyzer (TA.XT Plus, Stable Micro Systems, Surrey, U.K.). The equipment was fitted with a 50-kg load cell. The texture analyzer hardness test conditions were radial direction (tablet), compression mode, 4 mm compression distance, 2 mm/s pretest speed, 1 mm/s test speed, 10 mm/s post-test speed, 2 cm target mode distance, auto-trigger, and 1 N trigger force. The measurements were done in six replicates.
Assay.
The INH contents in the printlets were determined by the content uniformity method. The printlet was placed in a 100 mL volumetric flask. A 50 mL volume of methanol was added to the volumetric flasks and sonicated for 30 min. The volume was made up to 100 mL with water, filtered through 0.45 μm filters (Thermo Scientific), and diluted with mobile phase. The experiment was performed in five replicates. Samples were analyzed by a validated high-performance liquid chromatography (HPLC) method.
Dissolution.
Dissolution of the printlets was performed by two methods, namely USP apparatus 2 and bottle shaking method. Dissolution of the printlets was performed using the USP apparatus 2 (model 708-DS with an 850-DS autosampler, Agilent Technologies, CA) in 500 mL of water at 100 rpm and 37 °C. Water was used as the dissolution medium as INH is highly soluble in water (14% at 25 °C).31 A 1 mL volume of the sample was collected at 1, 2, 3, 4, and 5 min during the dissolution test. In the bottle shaking method, dissolution was performed in 100 mL of water at 50 rpm of a horizontal shaker maintained at 37 °C. Samples were withdrawn at 2 and 5 min. The disintegration time was also monitored during dissolution testing in the shaking method. The percentage of INH dissolved from the printlets was determined using the HPLC method.
Scanning Electron Microscopy.
The surface morphologies of the printlets and powder blends before and after printing were captured with a scanning electron microscope (SEM, JSM7500F, JEOL, Tokyo, Japan). Briefly, the samples were coated with a 5 nm thick carbon layer with a sputter coater under high vacuum (argon gas pressure 0.01 mbar) and high voltage (40 mV). The morphology of the printlets was captured at 15 mm working distance, 5 KV accelerated voltage, and 20 μA emission current.
X-ray Micro-computed Tomography.
The internal structure and porosity were measured with an X-ray micro-computed tomography scanner (X-ray Micro-CT, Sky-Scan1172, Bruker-microCT, Belgium). The image collection parameters were a resolution of 2000 × 1048 pixels and 180° rotation with a step size of 0.4°. NRecon software (version1.7.0.4, Bruker-microCT) was used for image reconstruction. Three-dimensional model rendering and viewing were performed using the associate program CT-Volume (CTVol version 2.3.2.0) software. The data was analyzed using the software CT Analyzer (CTan version 1.16.4.1). Closed- and open-porosity values were calculated using the 3D analysis in the morphometry preview.
X-ray Powder Diffraction.
The X-ray powder diffraction (XRPD) patterns of the samples were collected using a Bruker D2 Phaser SSD 160 Diffractometer (Bruker AXS, Madison, WI). Briefly, a powder sample equivalent to 400 mg was used to evenly fill the cavity of the sample holder and pressed to minimize the preferential crystals’ orientation. Samples were scanned over the 2θ range of 5−40° with a step size of 0.0202° at 1 s per step (3000 total steps). The samples were rotated at 15 rpm/min to get the average diffractogram of the sample. The XRPD data collection and analysis were performed using Diffrac.EVA Suite version V4.2.1, and processed using File Exchange 5.0 (Bruker AXS, Madison, WI).
Differential Scanning Calorimetry.
Differential scanning calorimetry (DSC) of INH, placebo, and printlet formulations was performed using Q2000 instruments (TA Instruments Co., New Castle, DE). Approximately 2.5 mg of the samples was sealed into aluminum pans. The temperature-scanning rate was 10 °C/min and scanning was done up to 250 °C for the DSC measurement. Nitrogen gas was purged at a pressure of 20 psi and a flow rate of 50 mL/min to provide an inert atmosphere during the measurement.
Fourier-Transform Infrared Spectroscopy.
Chemical changes in the printlets, pre- and post-printing powder blend, INH, and placebo mixture INH were monitored by Fourier-transform infrared (FTIR) spectroscopy. Spectra were collected using a modular Nicolet iS 50 system (Thermo Fisher Scientific, Austin, TX) in absorbance mode over a wavelength range of 400−4000 cm−1 with a data resolution of 4 cm−1 and 100 scans. A small amount of powder was placed on the diamond crystal and pressed with the attached arm to avoid air entrapment in the sample. OMNIC software, version 9.0 (Thermo Fisher Scientific, Austin, TX) was used to capture and analyze the spectra.
Stability Study.
The short-term in-use stability of the printlets was determined by packaging in pharmacy vials and storing at 40 °C/75% RH for a month. The printlets were monitored for DT, hardness, assay, dissolution, and physicochemical characteristics (XRPD, DSC, and FTIR).
Pharmacokinetic Study.
The printlet formulation F2 and compositionally identical compressed tablet (control) were used in the pharmacokinetic study. The composition of the compressed tablet was identical to the F2 printlet formulation. F2 and the compressed tablet of 10 mg strength were manufactured. The study was performed in albino New Zealand white rabbits (n = 4, male/female 1:1) weighing 2− 4 kg. Ad libitum food and water were available to the animals during the study, and they were monitored for any adverse events and weight loss during the study. The study was performed as per the protocol #IACUC 2020–0046 approved by Texas A&M’s Institutional Animal Care and Use Committees. The animals were administered 40 mg (administered four printlets or tablets) by pill popper (Emoly pet pill disperser), followed by administration of 10 mL of water. Blood (1 mL) was collected in a sodium heparin-coated centrifuge tube at 0, 0.5, 1, 2, 3, 4, 6, 8, 12, 24, 36, 48, and 72 h through the central or marginal ear vein. The animals were administered a single dose of acepromazine 0.1−1 mg/kg intramuscular prior to blood collection. The acepromazine dose of 0.1−1 mg/kg is commonly used as a vasodilator in pharmacokinetics studies.32 Furthermore, a higher dose of the drug in combination with narcotics is used for sedative effect.33 Blood samples were centrifuged at 13 300 rpm to separate the plasma. The plasma was stored at −80 °C before processing by ultra-performance liquid chromatography-mass spectrometry (UPLC-MS) analysis.
Plasma samples were extracted by the double protein precipitation method by adding an equal volume of 50% MeOH/water to the plasma sample. The samples were vortexed for 1 min, stored at −20 °C for 1 h, and centrifuged at 13 300 rpm at 4 °C for 15 min. A volume of 250 μL of the supernatant was transferred to another Eppendorf tube that contained 625 μL of ACN and 50 μL of the internal standard (IS) (INH-d4, 5 μg/mL), vortexed for 1 min, and centrifuged at 13 300 rpm at 4 °C for 15 min. Then, 100 μL of the supernatant was diluted to 1 mL with water, vortexed for 30 s, and the INH was determined by the developed UPLC-MS method.
High-Performance Liquid Chromatography.
The assay and dissolution samples were analyzed by HPLC. The HPLC system (HP 1260 series, Agilent Technologies, Wilmington, DE) was equipped with a quaternary pump, autosampler, and UV/vis detector. The mobile phase consisted of 0.05% glacial acetic acid and acetonitrile (98:2 v/v) pumped at a flow rate of 1.0 mL/min through a Luna 5 μm C8 column 150 × 4.6 mm2 (Phenomenex, Torrance, CA). The volume of the sample injection was 20 μL. The eluent was detected at a wavelength of 260 nm and the retention time of INH was 5.2 min. Data were collected and analyzed using OpenLab software (Agilent Technologies, Wilmington, DE).
Ultra-Performance Liquid Chromatography-Mass Spectrometry.
Quantification of INH and INH-d4 in the plasma samples was performed using an Acquity UPLC system (Waters Corporation, Milford, MA) equipped with a quaternary pump, and PDA and QDa detectors. Separation of the processed plasma samples was performed using Poroshell 120 EC-C18 (4.6 × 50 mm2, 2.7 μm) (Agilent, Santa Clara, CA) maintained at 35 °C in the column oven. The mobile phase consisted of a mixture of 10 mM ammonium acetate and acetonitrile (95:5, v/v) flowing at 0.5 mL/min. The sample volume of 10 μL was injected and the run time was 3 min. The retention time of INH and INH-d4 was 1.499 and 1.501 min, respectively. The mass spectrometry parameters were electrospray positive ionization (ESI+) mode with 0.8 kV capillary voltage and 15 V collision energy. The masses of INH and INH-d4 were monitored by a QDa detector at 138.14 and 142.14, respectively. The calibration range of INH was 0.25−10 μg/mL.
RESULTS AND DISCUSSION
Preliminary Data.
Formulation and process variables were selected based on the preliminary data and published work. Based on our previous published work, Candurin NXT Ruby Red 3% was selected as the laser-absorbing agent, which facilitated the sintering process.28−30,34 A laser speed of 400−500 mm/s was selected as printing below 400 mm/s caused burning of the printlets, while printing above 500 mm/s did not provide enough mechanical strength. This was due to the over- and under-sintering at <400 and >500 mm/s laser scanning speed, respectively. Printing at <100 °C chamber temperature produced printlets with stair effect and poor mechanical strength. This was due to the poor stability of the powder bed during the printing process. To provide stability to the powder bed, the printing was performed at 100−110 °C. CCS was incorporated to shorten the disintegration time.28−30
Weight and Assay.
The weight of the printlets varied from 10.4 ± 0.3 (F8) to 14.4 ± 0.4 mg (F5). Furthermore, assay of the printlets varied from 98.8 ± 2.0 to 102.0 ± 2.0%. None of the studied independent variables and interaction terms had any statistically significant (p > 0.05) effect on the weight of the printlets.
Hardness.
Mechanical strength was measured using a texture analyzer as a traditional tablet hardness tester could not measure the hardness of the printlets. The hardness of the printlets varied from 1.9 ± 1.0 (F13) to 11.1 ± 2.8 (F6) N (Figure 1A). Hardness can be expressed by the following polynomial equation
Figure 1.
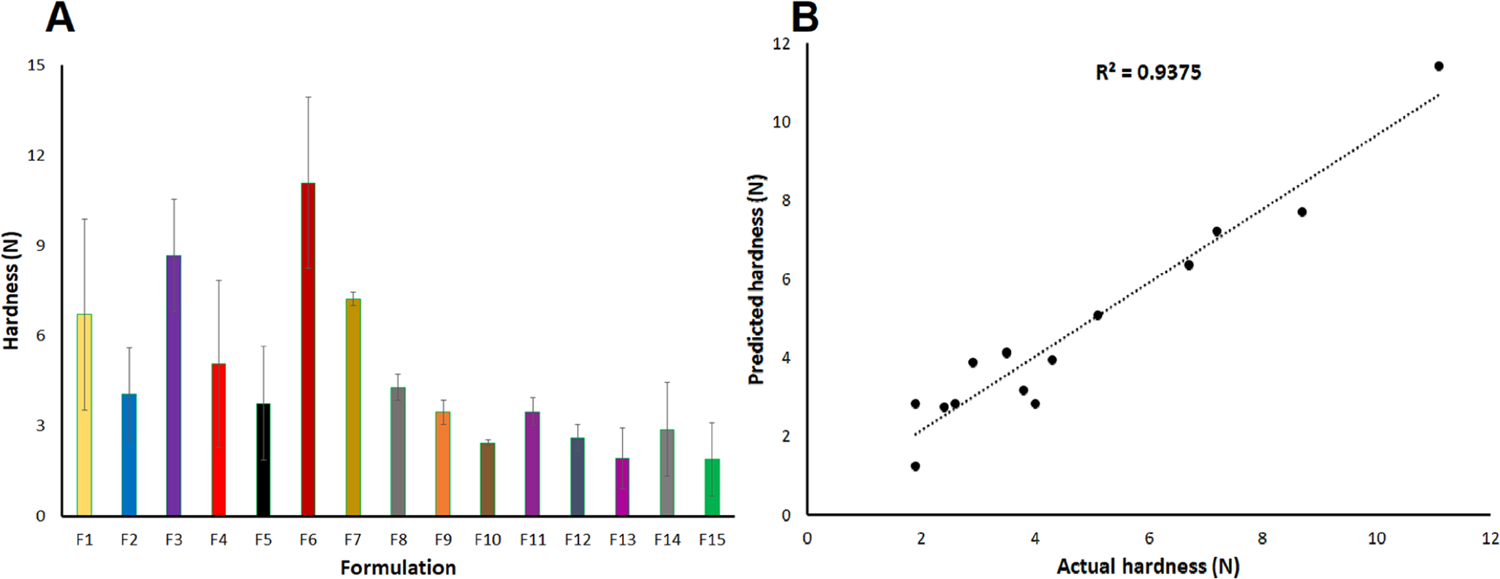
(A) Hardness data and (B) actual and model predicted values of the hardness of the printlet formulations.
The positive and negative signs of an independent variable in the polynomial equation indicate increase and decrease in the value of the dependent variable, respectively.30 The R value of 0.968 was obtained between the actual and model predicted values of the hardness (Figure 1B). The model can explain 93.7% of the variability in the data, as indicated by the determination coefficient (R2) value of 0.937. None of the independent variables had any statistically significant (p > 0.05) effect on Y2. However, interaction terms X1X and had a statistically significant (p < 0.05) effect on Y2. Moreover, X1 and X2 had negative impacts on the hardness. Faster laser scanning resulted in less softening, melting, and fusion of Kollicoat and a decrease in density of the printlets. Melting and fusion were caused by the interaction between the laser and Kollicoat polymer. CCS does not melt but decomposes at >205 °C.29 The increasing percentage of CCS in the formulation resulted in a decrease in the mechanical strength of the printlets. For example, printlets F6 and F9 were printed at 400 and 500 mm/s laser scanning speed, respectively, while keeping the CCS percentage and surface temperature constant for both formulations. The hardness was 11.1 and 3.5 N for F6 and F9, respectively. Similarly, the printlet F5 and F6 formulations contained 10 and 0% CCS, respectively, when printed at 400 mm/s laser scanning speed and 105 °C surface temperature. The hardness was 3.8 and 11.1 N, respectively.
Disintegration Time.
Orally disintegrating tablets have a DT of less than 30 s as per the FDA guidance document using the USP disintegration test.3 DT was determined by both USP and bottle shaking methods to increase the discrimination between the formulations. The DT varied from 3.0 ± 0.0 to 63.3 ± 5.8 s and 7.1 ± 0.6 (F1) to 36.7 ± 5.3 (F6) s by USP and bottle shaking methods, respectively (Figure 2A), and can be explained by the following polynomial equation for both methods.
Figure 2.
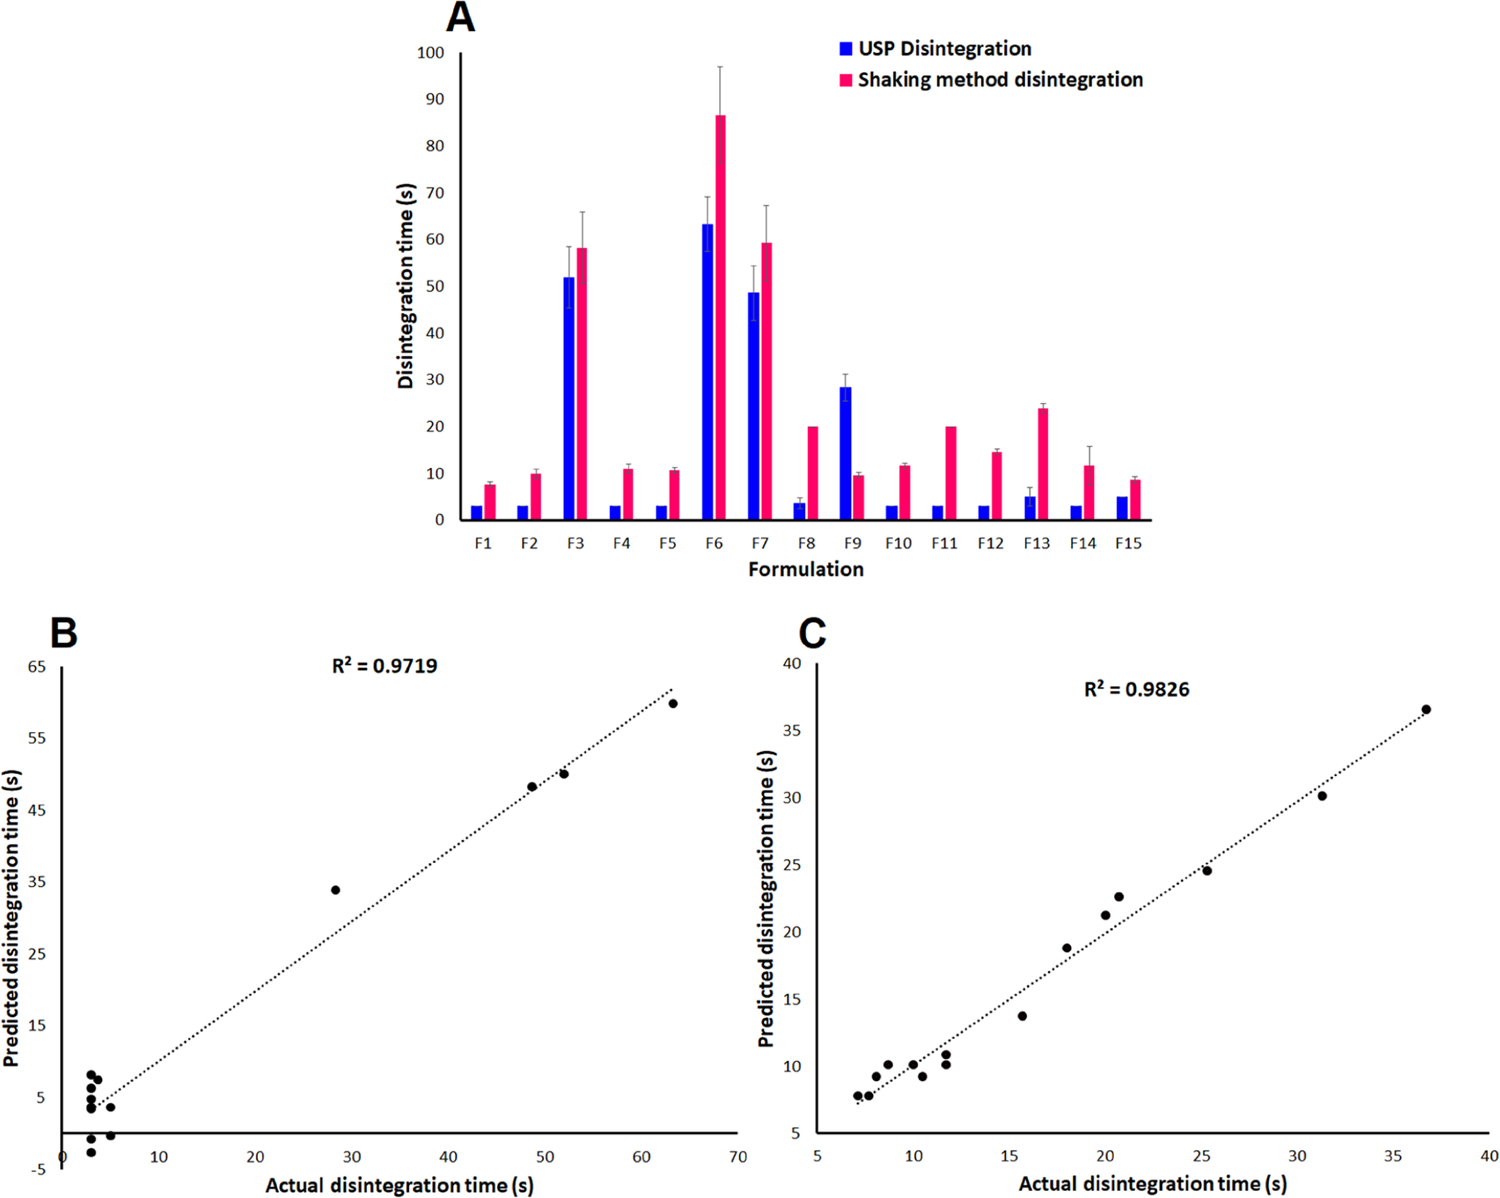
(A) Disintegration time data, and actual and model predicted values of the disintegration time of the printlets by (B) the USP disintegrator tester and (C) bottle shaking method.
USP Method.
Bottle Shaking Method.
The polynomial equation for Y3 for both methods showed a similar trend in terms of the effect of independent variables on the studied responses. A good correlation of 0.986 and 0.991 is obtained between the experimental and model predicted values for USP and bottle shaking methods, respectively (Figure 2B,C). The polynomial equation can explain 97.2 and 98.3% of the variability in the Y3 data by USP and bottle methods, respectively. The studied independent variables had a statistically insignificant (p > 0.05) effect on Y2 by the USP method. Moreover, the laser scanning speed and CCS amount had a statistically significant (p < 0.05) effect on Y2 by the bottle shaking method. This indicates that increasing the laser scanning speed and CCS amount in the formulation resulted in a faster disintegration. This was related to the impact of these variables on the mechanical strength (Y2). The hardness and DT of F1 and F6 were 6.7 and 11.1 N, and 7.7 and 36.7 s, respectively. Similar to hardness, interaction terms X1X2 and , and and had a statistically significant (p < 0.05) effect on Y3, respectively.
Dissolution.
The dissolution specification of the INH tablet is 85% in 45 min using 900 mL of 0.01 N HCl as the dissolution medium.35 Dissolution was conducted in 500 and 100 mL of water using USP apparatus 2 and bottle shaking methods, respectively. Only F1, F2, and F6 dissolution were performed using USP apparatus 2. Dissolution was almost complete in 3 min from F1, F2, and F6 printlets by the USP 2 method. The values were 103.2 ± 2.6, 101.4 ± 2.5, and 99.82.5% from F1, F2 and F6, respectively (Figure 3A). These printlets can be considered to rapidly dissolving formulations as per the FDA guidance document. The very-rapidly dissolving formulation dissolved ≥85% in 15 min.36 The bottle shaking method was used to perform the dissolution in 100 mL to further increase the discrimination among the formulations. Dissolution by the bottle shaking method varied from 66.4 ± 5.8 (F6) to 98.2 ± 2.6 (F15) % in 2 min. Dissolution was complete in 5 min.
Figure 3.
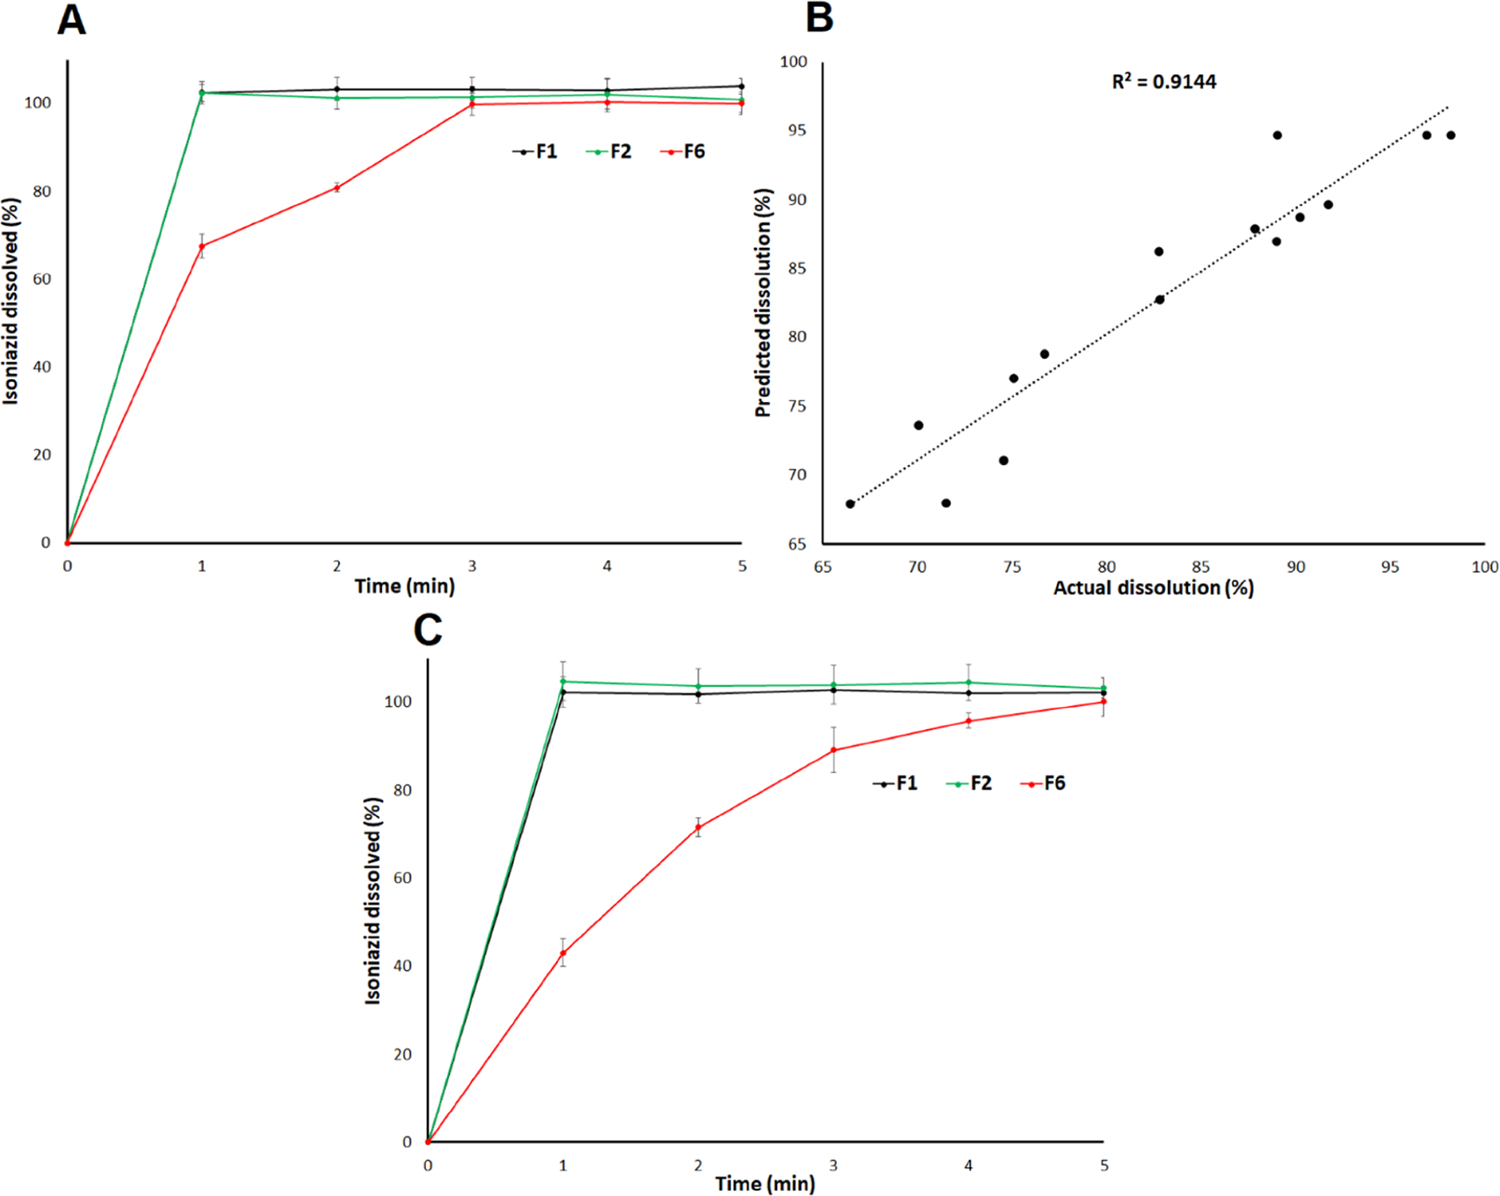
(A) dissolution profiles, (B) actual and model predicted values of the dissolution in 2 min, and (C) dissolution profiles after storage of the printlet formulations at 40 °C/75% RH for a month.
The correlation coefficient was good, as indicated by the R value of 0.956 between the actual and model predicted values (Figure 3B). The variability of 91.4% in the data can be explained by the mathematical model. Among the studied variables, laser scanning speed had a statistically significant (p < 0.05) effect on the dissolution, which was related to effect of X1 on the hardness and DT. For instance, F7 and F13 were printed at 400 and 500 mm/s while keeping CCS and surface temperature constant for both formulations. The dissolution was 71.5 ± 1.8 and 89.0 ± 5.01% for F7 and F13, respectively. Surface temperature and CCS had a statistically insignificant (p > 0.05) effect on the dissolution. However, surface temperature and CCS decreased and increased the dissolution, respectively, which was again related to their effect on Y2 and Y3, respectively. Among the interaction terms, and had a statistically significant (p < 0.05) effect on the Y4.
Accuracy and Analysis of Variance (ANOVA).
The accuracy of the model was measured by the root-mean-square error (RMSP) and residual between actual and predicted values. Accuracy was better for Y1, Y2, and Y3 by the bottle shaking method compared to Y3 by the USP method and Y4, as indicated by the RMSP and residual values. The models had an RMSP of 1.16, 1.12, 6.04, 2.01, and 4.9 for Y1, Y2, Y3 by the USP method, Y3 by the bottle shaking method, and Y4, respectively. Similarly, residual values for Y1, Y2, Y3 by the USP method, Y3 by the bottle shaking method, and Y4 varied from −1.0 to 1.1, −1.0 to 1.2, −5.7 to 5.7, −2.0 to 2.0, and −5.7 to 3.6, respectively. ANOVA analysis at 95% confidence was statistically significant (p < 0.05) for Y2, Y3, and Y3 responses. Furthermore, the lack of fit test was statistically insignificant (p > 0.05) for all of the studied responses.
Surface Morphology and Porosity.
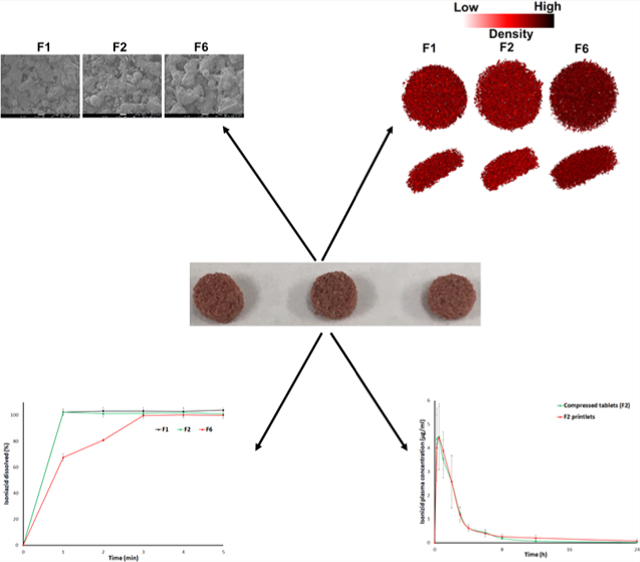
INH showed rectangular or columnar crystals, while Kollicoat IR’s shape was spherical, of varying size. Candurin NXT Ruby Red showed flaky plats (Figure 4A). The printlet formulations’ surface morphology showed individual components with some deformations. Crystals of the INH melted, were covered with the melted Kollicoat, and/or dissolved in the polymer. However, Candurin NXT Ruby Red morphology did not change in the printed formulation. Furthermore, the degree of melting of the drug and polymer or dissolution was correlated with the manufacturing parameters. A slower laser scanning speed resulted in an increase in softening/melting of the component and hence greater deformation of the morphology and a decrease in porosity. For example, formulation F1 exhibited a low degree of melting and dissolution of components with high porosity compared to less porosity for formulations F2 and F6. F1 was scanned at a laser scanning speed of 500 mm/s while F6 was scanned at 400 mm/s. Furthermore, the laser scanning speed correlated well with the empirical porosity values. The effect of scanning speed on the porosity was significant at 400 and 500 mm/s versus 450 and 500 mm/s. X-ray micro-CT images showed a higher porous structure in F1 compared to F6. The porosities of F1, F2, and F6 were 34.4, 32.3, and 24.6%, respectively, which correlate with the laser scanning speed of the printing process (Figure 4B).
Figure 4.
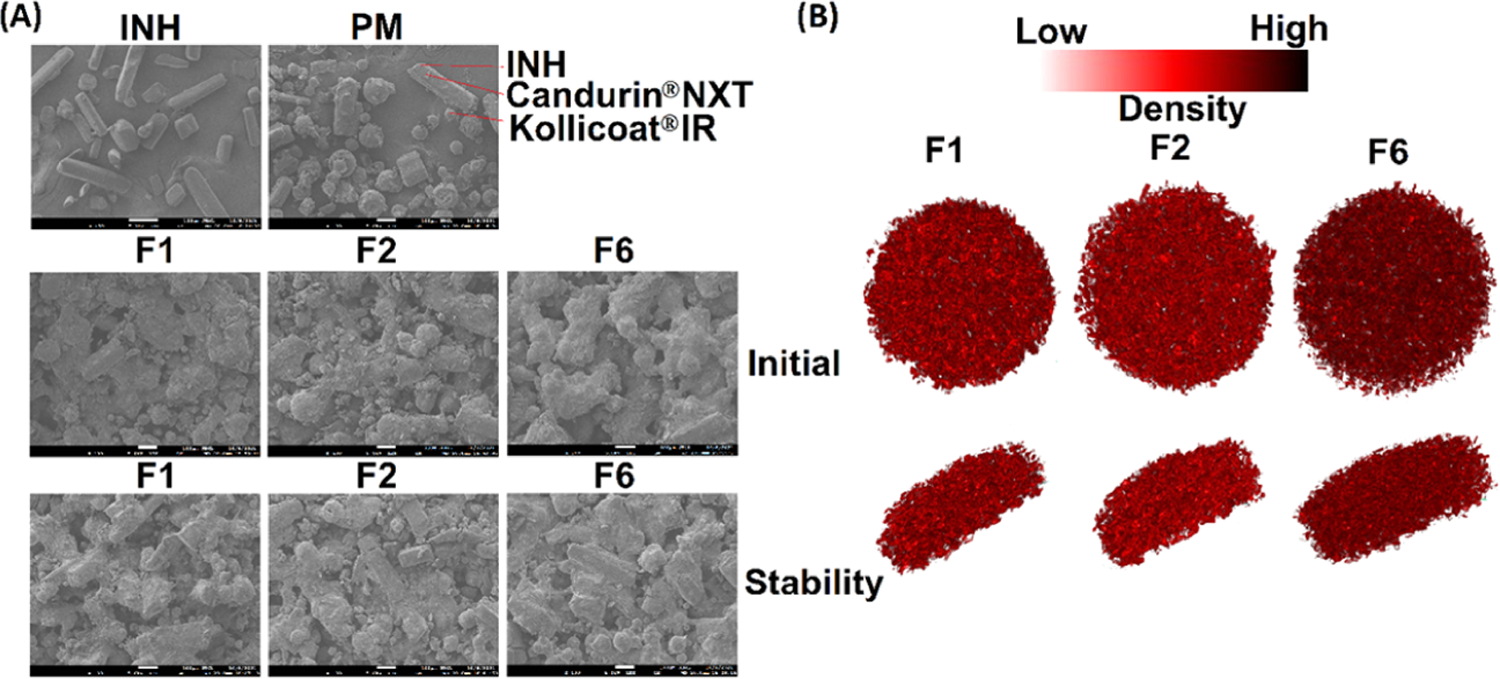
(A) Scanning electron microscopy image of the INH, placebo, and printlets before and after exposure to the stability condition, and (B) micro-X-ray CT images of the printlets.
X-ray Powder Diffraction.
The diffractogram of INH showed sharp reflection peaks, which was indicative of its crystalline nature. The drug showed characteristic major reflection peaks at 11.7, 13.9, 15.3, 16.4, 19.5, 23.6, 25.0,25.8, and 27.1°. The physical mixture (PM) of Kollicoat, Candurin, and CCS showed a characteristic broad peak at 2θ of 19.5°, indicating its crystalline form (Figures 5 and 6). This peak is characteristic of Kollicoat as CCS is amorphous, while the Candurin proportion was negligible compared to other components.29 The physical mixture (PM) of the powder showed all the major peaks of INH, except the peak at 19.1° that was interfered by the Kollicoat peak (Figure 6). The printlet formulations showed significant differences in diffraction patterns compared to PMs. The printlets showed peaks at 11.7, 13.9, 15.3, 16.4, 19.5, 23.6, 25.0, 25.8, and 27.1°, with some shift in peak by 0.1−0.2°. The sharpness and broadness of the major peaks of the drug decreased and increased, respectively. Some of the peaks appeared as doublets or split at the apex. Furthermore, there was significant reduction in the intensity of the peaks. A decrease in peak intensity indicated partial conversion of the crystalline drug into amorphous phase in the formulation. The amorphous transformation can be explained by softening, melting, and solubilization phenomena. Kollicoat IR is a thermoplastic polymer with a glass transition temperature of 37.4−41.6 °C.37−39 The printing process parameters might have caused softening and melting of the polymer that acted as a solvent to dissolve the drug. The energy for softening and melting was provided by the surface temperature (100−110 °C) and laser scanning (400−500 mm/s). Furthermore, laser scanning caused an increase in temperature of the scanned region of the powder bed, which resulted in softening and melting of the polymer. The softening and melting hypothesis was further supported by the SEM images (Figure 4A). The intensity of peak reduction was higher in the formulation sintered at a slower laser printing speed compared to the one sintered at a faster laser speed. For example, the reflection peaks’ intensity reduction was more in F6 compared to F1, albeit insignificant.An estimate of the conversion from crystalline to amorphous form was done by calculating the peak areas at 11.7, 13.9, 15.3, and 16.4° and compared with the physical mixture of the respective formulation before printing. Decrease in crystallinity was proportional to the laser scanning speed. A reduction of 60.1, 74.4, and 78.7% in crystallinity was observed in F1, F2, and F6 when compared to the corresponding PM, respectively.
Figure 5.
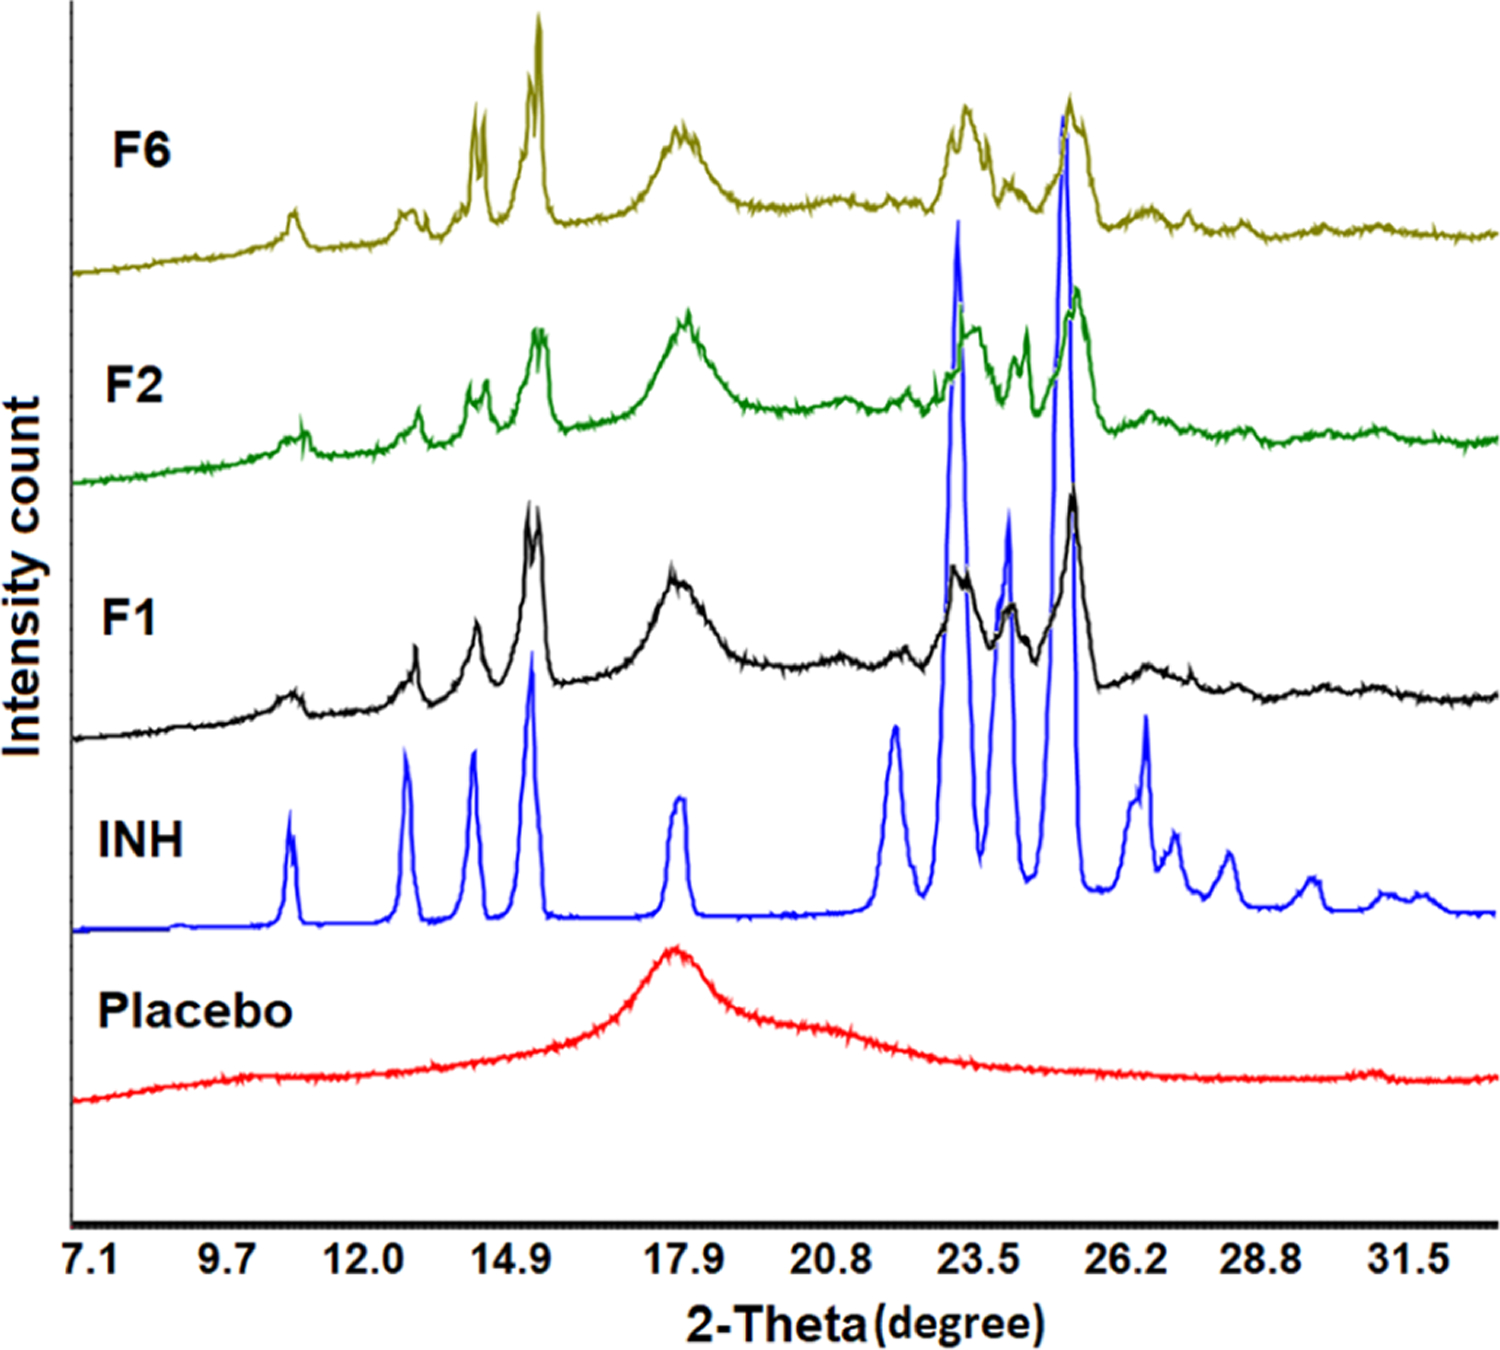
X-ray powder diffractograms of INH, placebo, and printlets.
Figure 6.
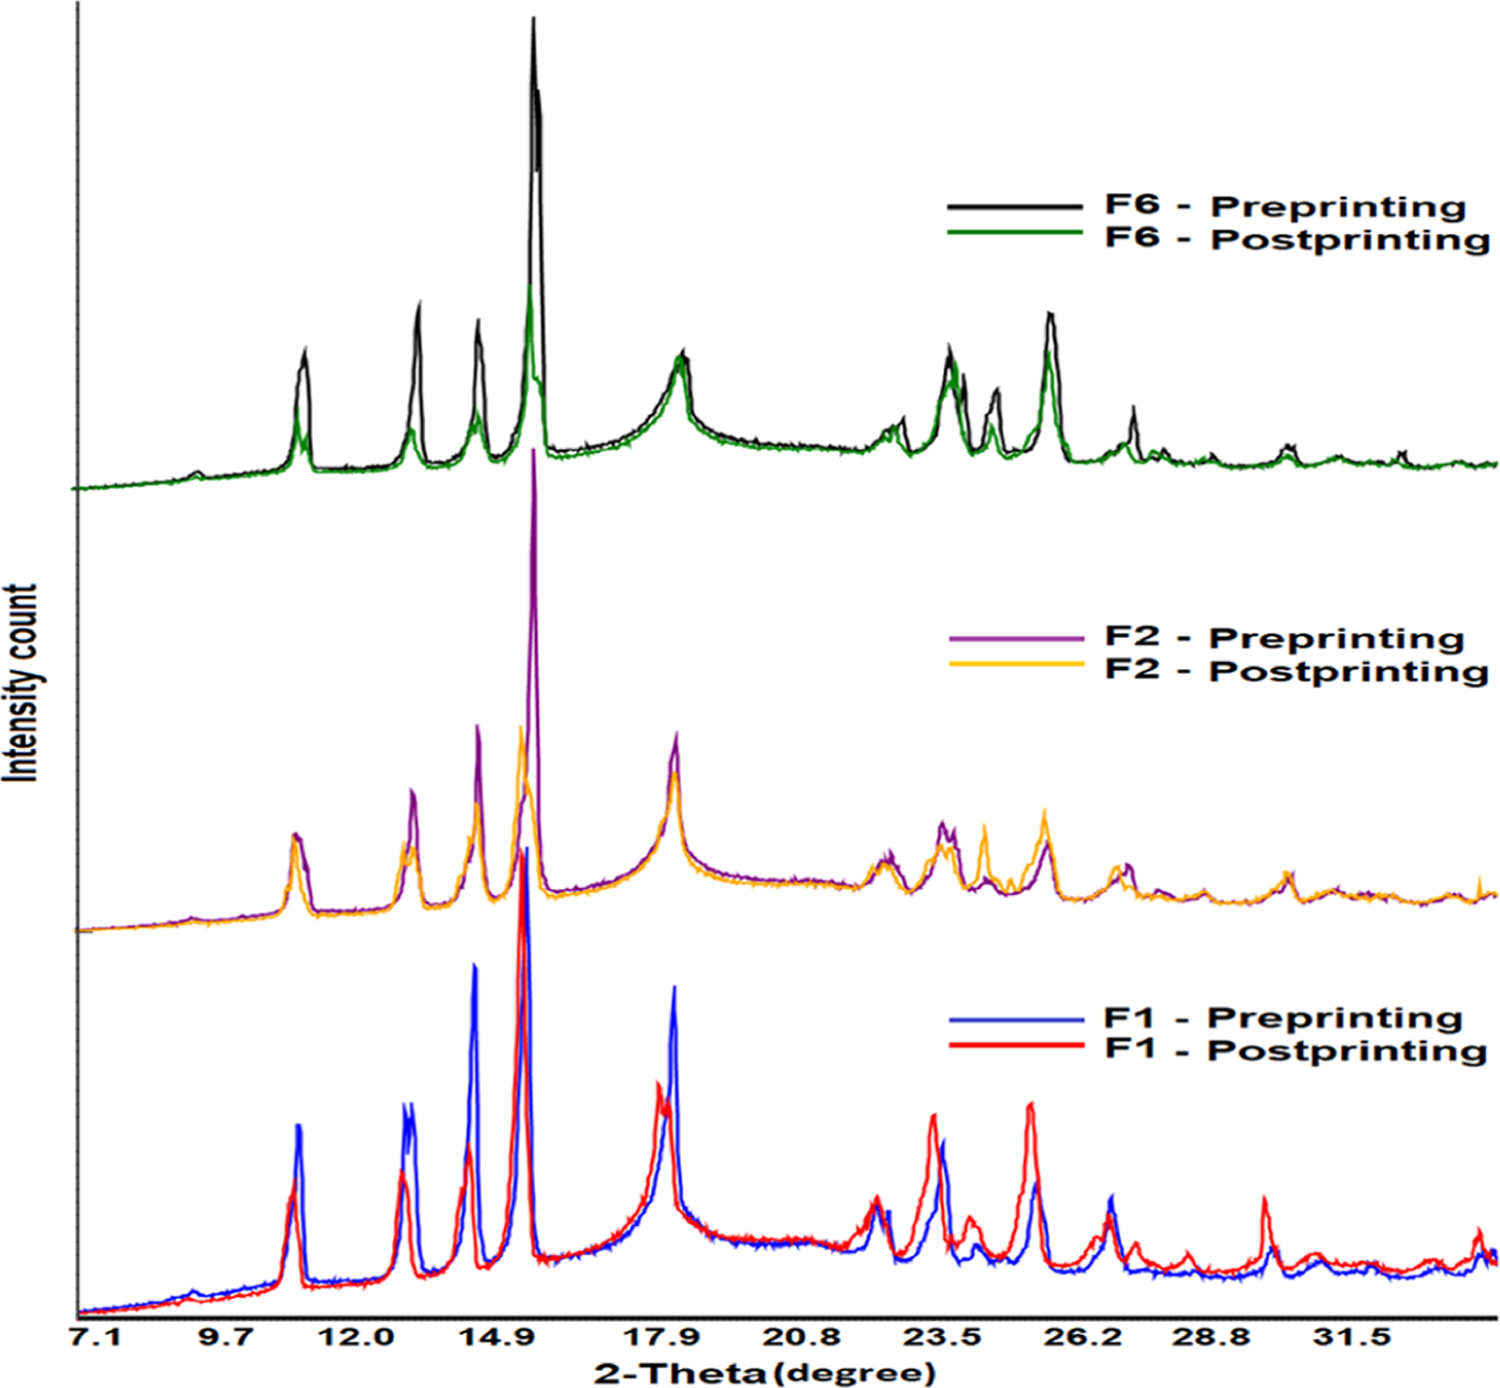
X-ray powder diffractograms of the printlet formulation powder before and after the printing process.
Differential Scanning Calorimetry.
INH showed a sharp melting peak at 174.8 °C, which indicated its crystalline nature and thus concurred with the XRPD data. The placebo exhibited a very broad endothermic peak at 213.9 °C, which was due to the melting of Kollicoat (Figure 7A). Kollicoat was the major component in the formulation, and literature has reported its melting point as >200 °C.40 Additionally, placebo showed a shallow peak starting at 50 °C and ending at 120 °C. This may be due to the physically adsorbed water in the placebo formulation. The printlet formulations showed the melting peak of the drug at 168.30−168.90 °C. The drifting of the drug melting peak from 174.8 to 168.30−168.90 °C could be due to the excipients that acted as the impurities. We made a similar observation with the physical mixture (Figure 7B). However, the enthalpy of fusion was higher in the PMs (preprinting mixtures) compared to their corresponding printlets, which further indicated that some of the drug transformed from crystalline to amorphous in the formulations. For instance, the enthalpy of fusion in the PM of F1 and the corresponding printlet formulation was 124.8 and 80.4 J/g, respectively.
Figure 7.
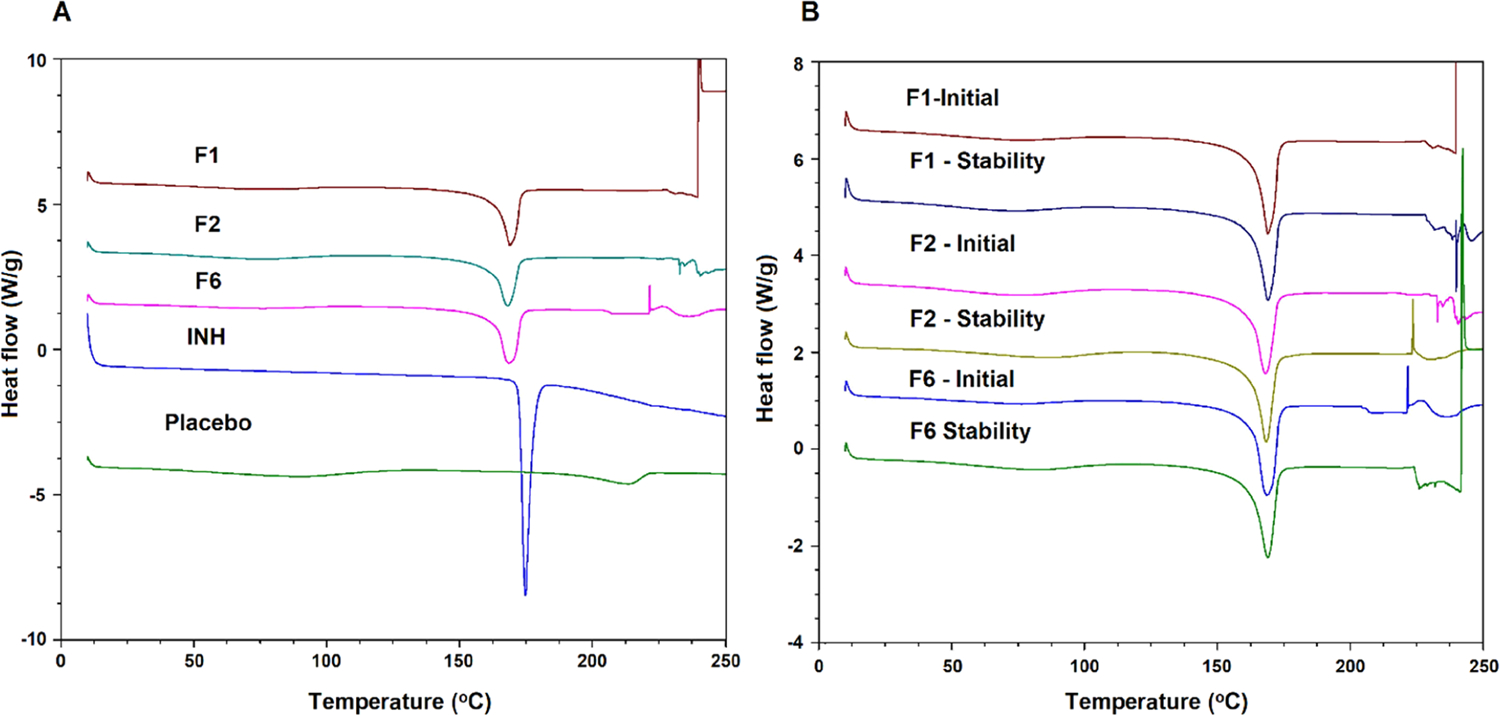
Differential scanning calorimetry profiles of (A) INH, placebo, and printlets, and (B) stability of the exposed printlet formulations.
Fourier Transformed Infrared.
The FTIR spectrum of INH showed characteristic absorption bands. C=C symmetric and asymmetric stretching vibrations were exhibited at 1410, and 1448, and 1603 cm−1 bands, respectively. The bands at 2855 and 3004 cm−1 appeared due to C−H symmetric and asymmetric vibrations, respectively.
The symmetric and asymmetric stretching vibrations of the C=N of the ring showed strong bands at 1552 and 1634 cm−1. Bands of C−N, carbonyl, and N−H vibration appeared at 1329, 1661, and 3300 cm−1, respectively.41 PMs of the formulations (preprinting) showed additive spectra encompassing the peaks of drugs and excipients. This indicated no physical and chemical interactions between the drugs and the formulation components. In contrast to XRPD that showed significant differences in the spectra of PMs and the formulations due to partial drug form conversion, the printlet spectra were similar to those of PMs (Figure 8). The characteristic peaks of INH did not change either position or shape at low and high printing surface temperature or laser scanning speed.
Figure 8.
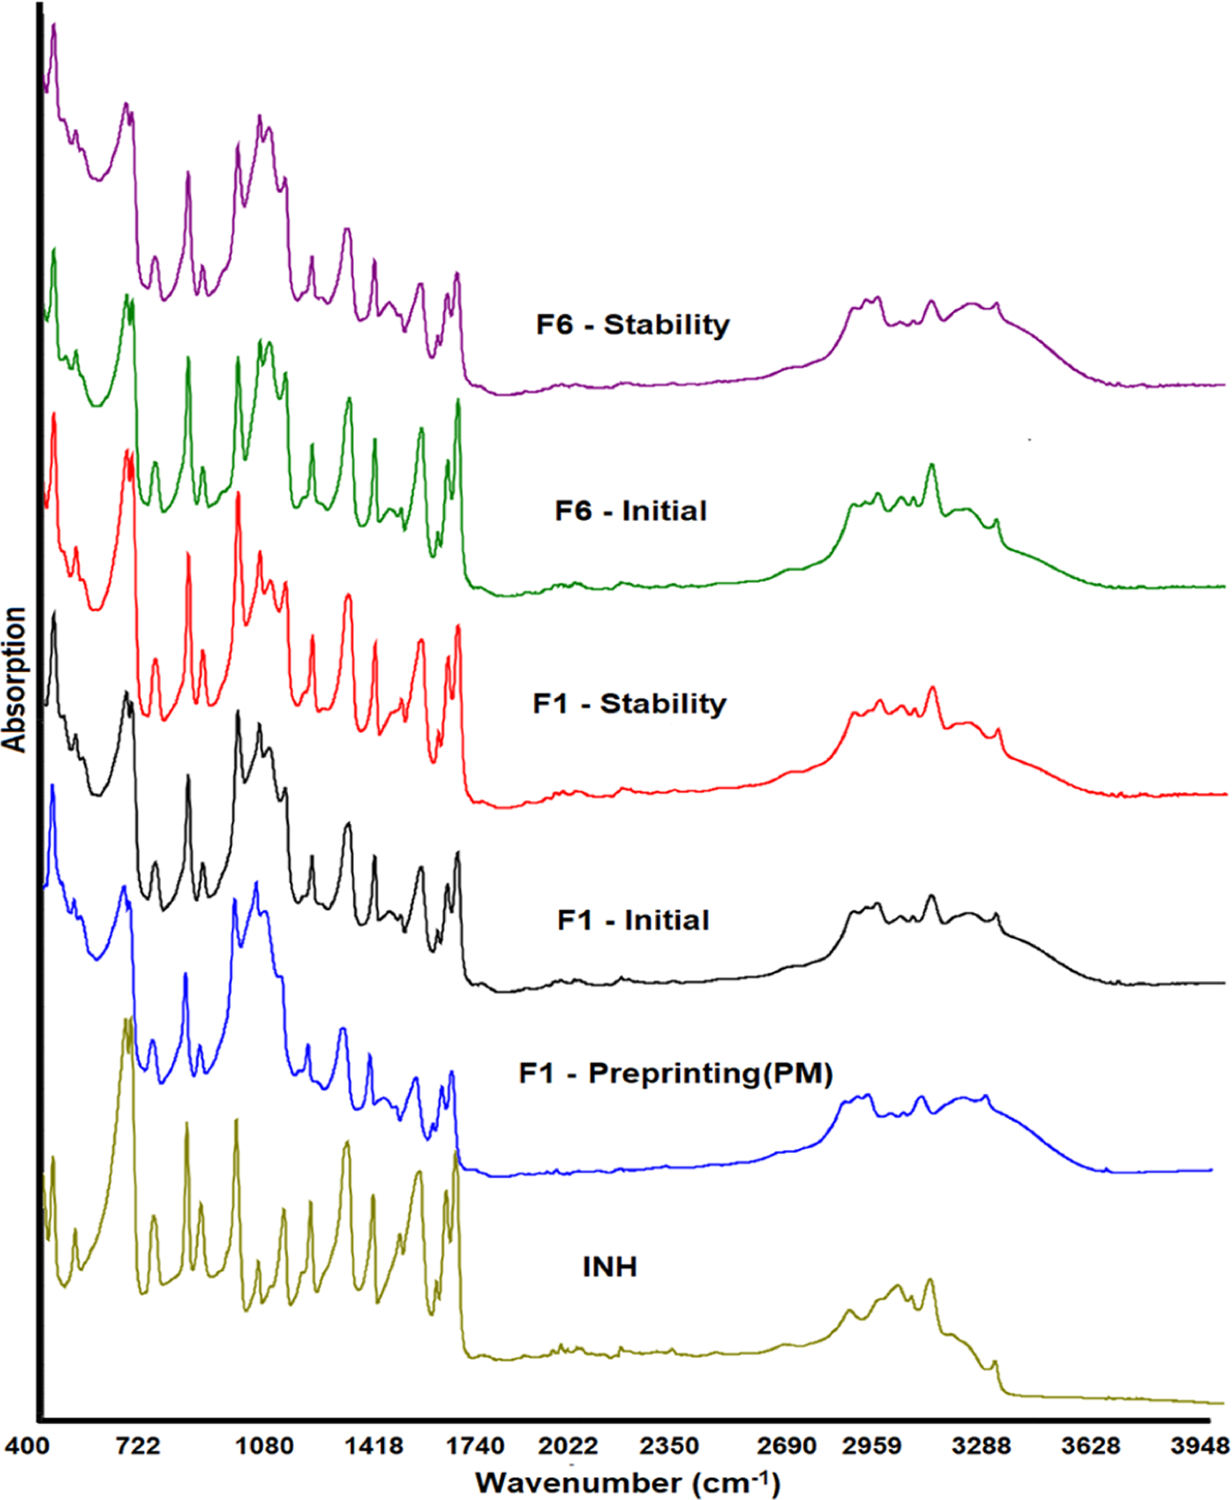
FTIR spectra of INH, placebo, and printlets before and after exposure to stability condition.
Recyclability of the Powder.
Not all the powder is printed into the printlets in the SLS method. Only a selected region of the powder bed is sintered to form the printlets, and the unprinted powder provides support to the printlets. The unprinted powder can be recycled provided that no change occurs in the physical and chemical properties. Changes in physical and chemical attributes may affect the processability and critical quality attributes of the printlets. This study was conducted to investigate the impact on the properties before and after exposing the powder to the printing process. There was no change in reflection peaks’ position in the diffractograms. However, a significant reduction in peak intensity was observed in the powder after exposure to printing parameters (Figure 6). The reduction in peak intensity is correlated with the laser scanning speed. For example, formulations F1, F2, and F6 were printed at 105 °C surface temperature and 500, 450, and 400 mm/s laser scanning speed, respectively. The probable reason for the reduction in reflection peak intensity of the drug was the stray laser light that caused surface sintering to some degree of the unprinted powder. The reduction in peak intensity was higher in those formulations printed at a slower laser scanning speed (F6) compared to the ones printed at a faster laser scanning speed (F1). The estimated loss in crystallinity was 20, 25.9, and 50.6% in F1, F2, and F6, respectively, which correlated with the laser scanning speed of the printing. Unlike XRPD, FTIR indicated no significant changes in powder chemical characteristics, as indicated by the spectra of the powder before and after the printing process (Figure 9).
Figure 9.
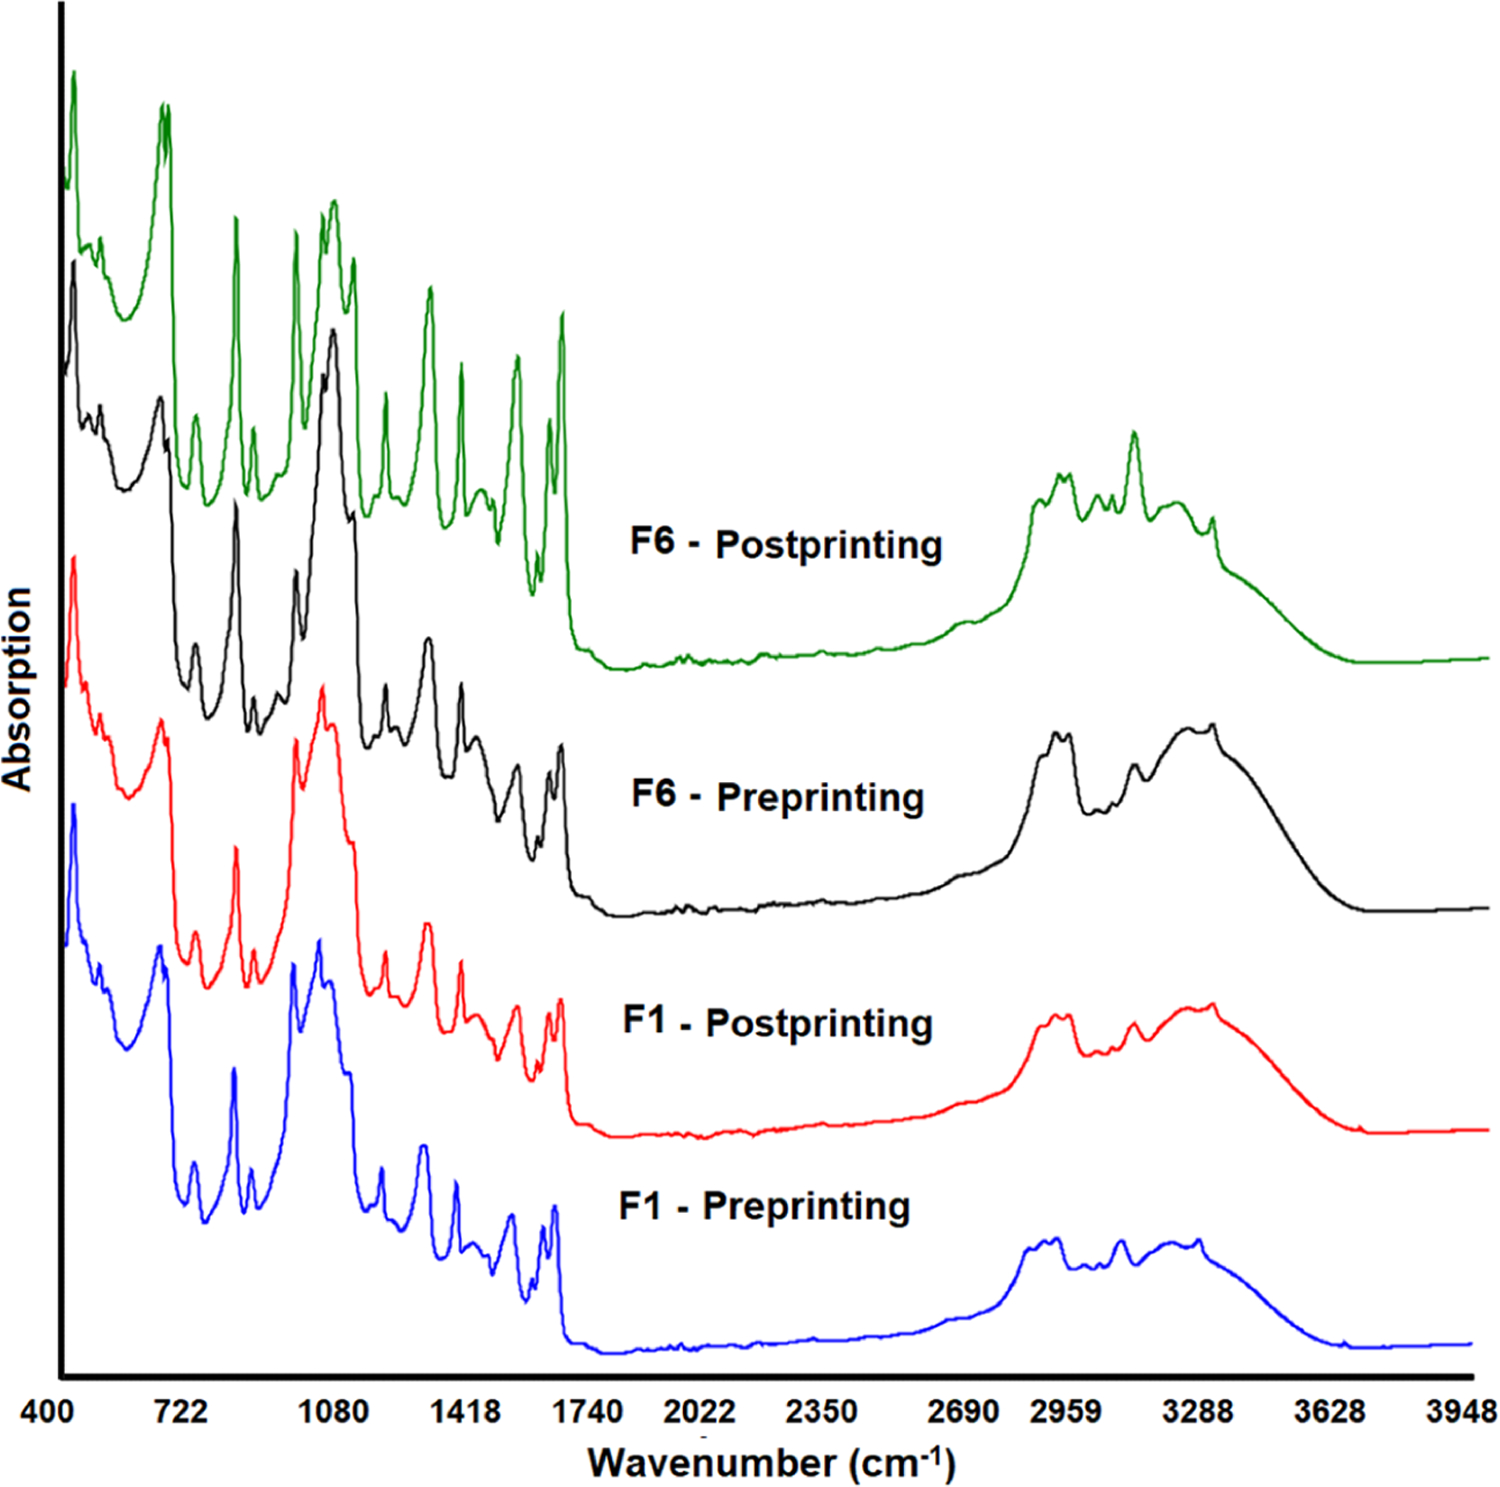
FTIR spectra of the printlet formulation powder before and after the printing process.
Stability of Printlets.
The purpose of this study was to determine the physicochemical stability of the printlets. The diffraction pattern was compared between the printlets before and after exposure to stability conditions. No significant changes in the surface morphology of the printlets were observed after exposure to stability conditions (Figure 4A). The peak intensity of the drug at 11.4, 13.7, 15.0, 16.1, 24.5, 25.6, and 26.6° was further reduced on exposure to 40 °C/75% RH compared to the initial printlets (Figure 10). Typically, the crystallinity increased on exposure to high humidity and temperature due to the increase in molecular mobility. However, in this case, the solubility of the drug plays a major role in determining the reduction in peak intensity. The drug solubility in water is 14% at 25 °C.31 The reduction in crystalline peak intensity could possibly be explained by the solubilization of the drug and stabilization by the polymer on exposure to 40 °C/75%. The estimated loss in crystallinity was 78.5, 35.4, and 53.0% after exposure to stability condition compared to before exposure.
Figure 10.
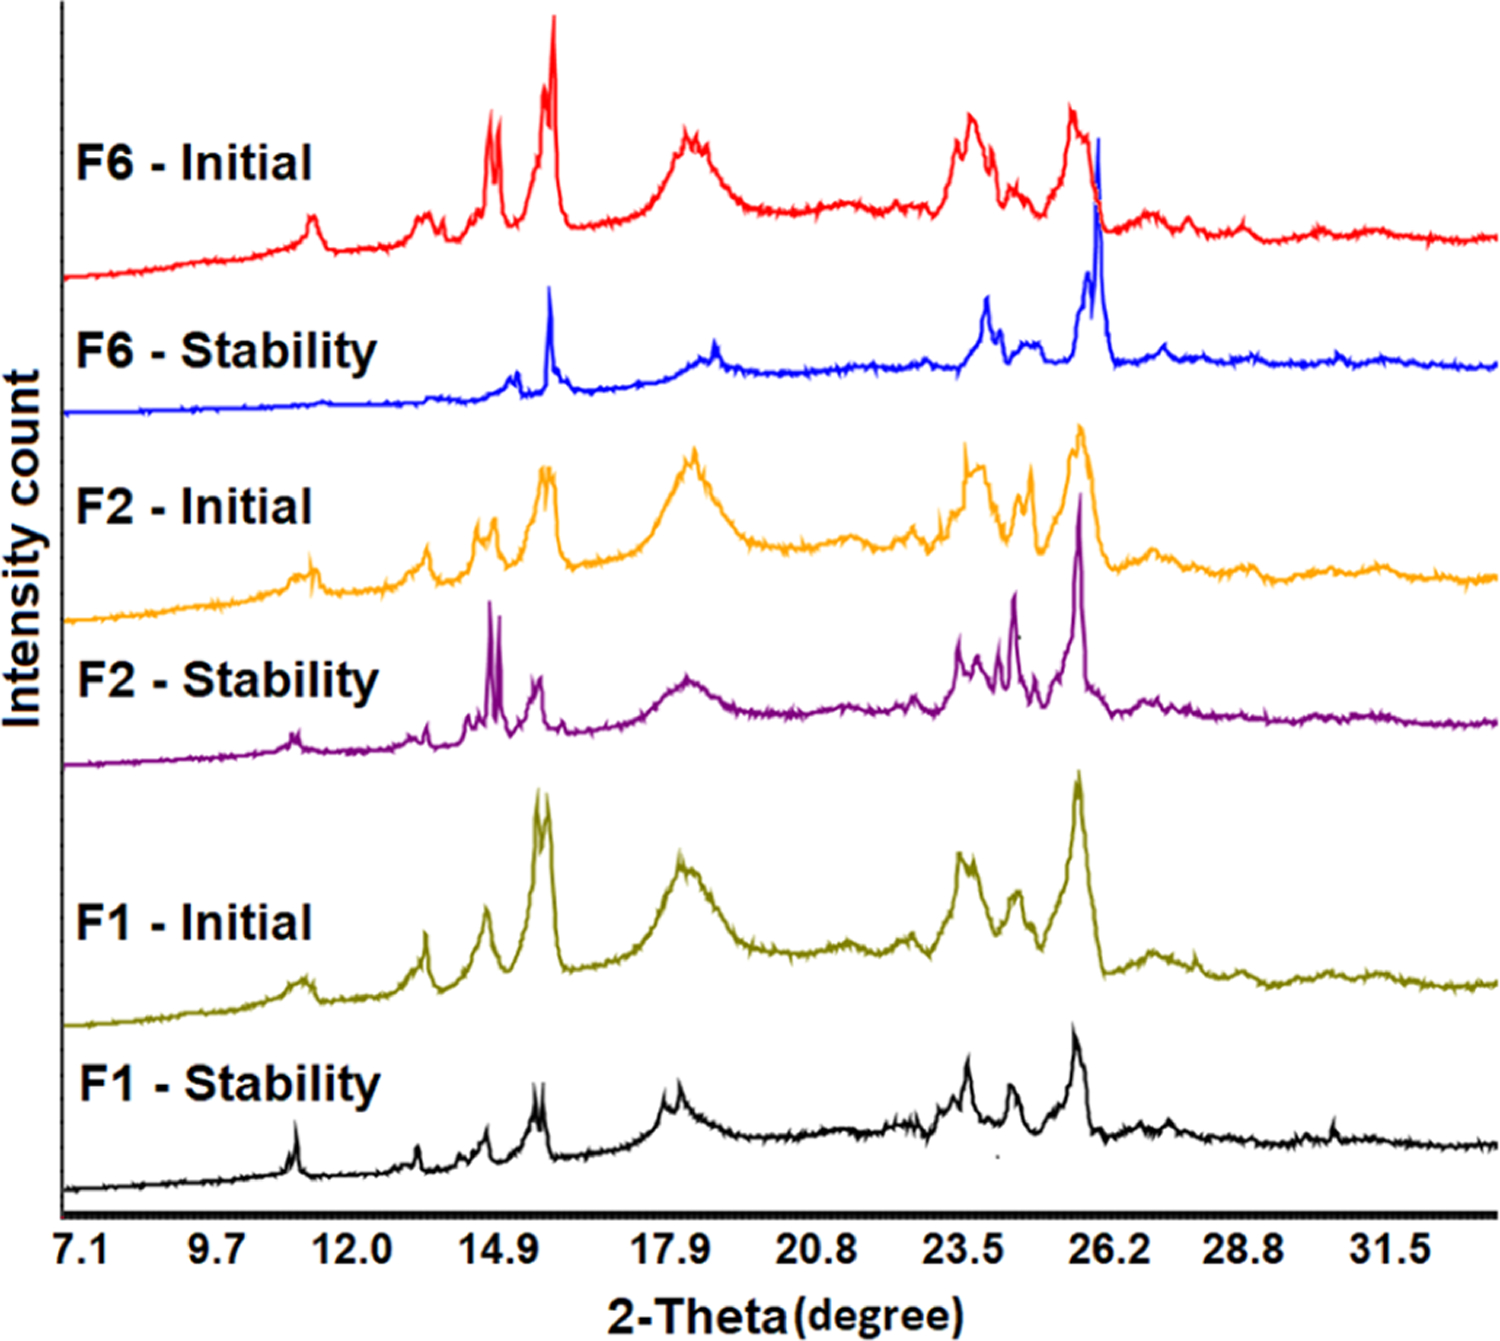
X-ray powder diffractograms of the printlet formulations after exposure to 40 °C/75% RH for a month.
Similar to XRPD, DSC did not show any change in the melting endothermic peak of the drug after exposure to stability condition (Figure 7B). However, there was a drop in the enthalpy of fusion due to dissolution of the drug on exposure to high humidity. This concurred with the XRPD data. For example, the enthalpy of fusion varied from 80.4 to 96.0 J/g before exposure and dropped to 77.8−88.1 J/g after exposure to stability condition. Similarly, FTIR data indicated no significant change in the spectra before and after exposure to stability condition. No change in the drug peak position or shape was observed (Figure 9). These data indicated no chemical changes in the printlets before and after exposure to stability condition.
Dissolution of the printlets after exposure did not show any significant changes in the case of F1 and F2 unlike F6. The dissolution profiles of F1 and F2 before and after exposure to stability condition overlap. The dissolution of F1 and F2 in the 2 min before and after exposure to stability conditions was 103.2 ± 2.6 and 101.2 ± 0.5%, and 101.4 ± 2.5 and 103.7 ± 3.9%, respectively. The F6 printlet showed a decrease in dissolution from 99.8 ± 2.5 to 89.2 ± 5.2% in 3 min. The decrease in the dissolution rate in F6 was possibly due to the drug dissolution in the polymer matrix during exposure to stability conditions, which was correlated with the slight increase in the DT from 63.3 ± 5.8 to 72.5 ± 7.9 s. However, no change in DT was observed for F1 and F2.
Pharmacokinetics Study.
The pharmacokinetic profiles of the F2 printlet and its compressed tablets were determined in the rabbit animal model. The INH therapeutic level should range from 1 to 2 mg/L at 3 h post-dose to be efficacious and to reduce the neurotoxic adverse events.42 In the clinical study, the plasma concentration of INH is 2.1 mg/L (2.1 μg/mL) (range 0.5−12.1 mg/L, 0.5−12.1 μg/mL).43 Furthermore, the oral bioavailability of INH in fasted and fed human subjects is 93 and 78%, respectively.44,45 A comparative pharmacokinetic study of printlets and compressed tablets/capsules has not been reported. It is expected that the oral bioavailability and therapeutic efficacy of the 3D printed delivery system would be similar to those of compressed tablets for water-soluble drugs. The plasma concentration−time profiles of the two formulations were superimposable (Figure 11). The statistical differences in pharmacokinetic parameters of the two formulations were insignificant (p > 0.05). The Tmax, Cmax, and AUC0−∞ of the tablets and the printlets were 0.38 and 0.63 h, 4.50 ± 1.58 and 4.54 ± 1.38 μg/mL, and 12.36 ± 3.54 and 15.50 ± 4.57 μgh/mL, respectively. The Tmax was achieved faster in the printlets compared to the tablets, although the difference was statistically insignificant (p > 0.05). This was probably due to the presence of amorphous fractions of the drug in the printlets and faster disintegration and dissolution. Furthermore, a statistically insignificant effect of gender was observed on the parameters (p > 0.05). The Tmax, Cmax, and AUC0−∞ were higher in male rabbits compared to female rabbits. This may be due to the slow acetylation of INH in male rabbits.46,47 Similarly, the plasma concentration of INH at 3 h post dosing was 1.24 ± 0.26 and 1.18 ± 0.32 μg/mL, respectively, which meets the therapeutic concentration of the drug.
Figure 11.
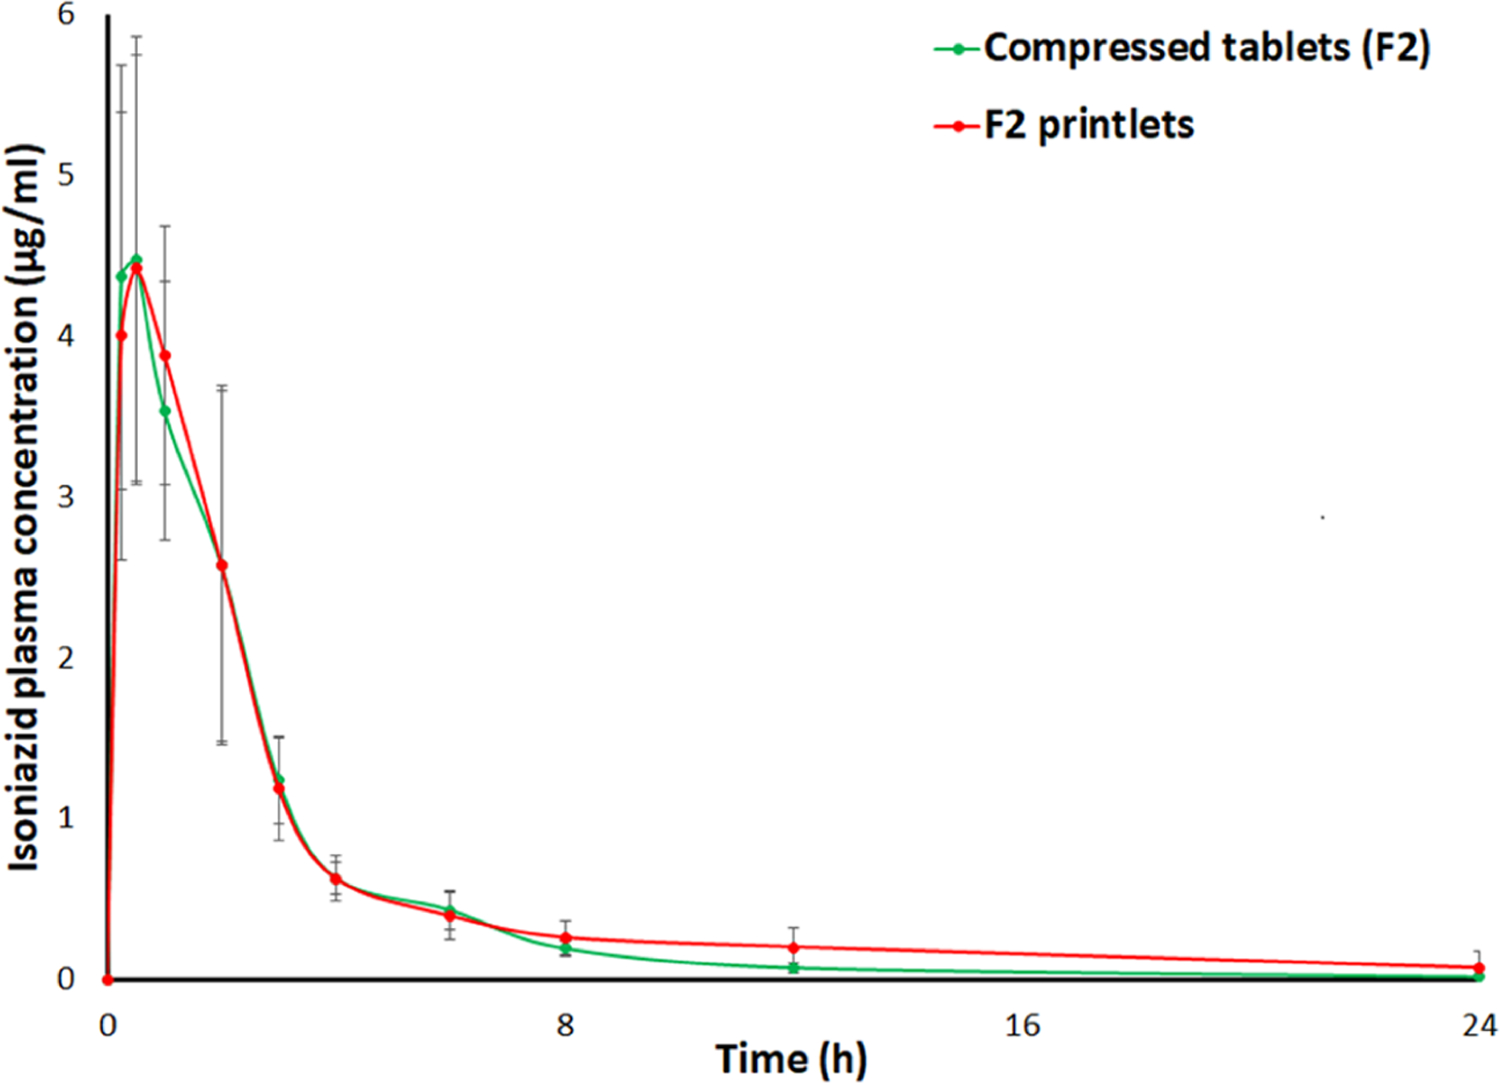
Pharmacokinetic profiles of the printlets and compressed tablets in rabbits.
CONCLUSIONS
Very-rapidly dissolving printlets of INH were developed with the SLS method. The formulation and process variables had statistically insignificant (p > 0.05) effects on the weight and hardness of the printlets. However, the laser scanning speed had a statistically significant effect (p < 0.05) on the DT and dissolution. The printlets disintegrate in 3 s and dissolution was complete in 2 min. The rapid disintegration and dissolution of the printlets was due to the high porosity imparted by the process and the presence of partial amorphous phases. Laser sintering of the drug caused transformation of the drug from crystalline to amorphous phase, as suggested by XRPD and DSC data. This was due to the softening, melting, and dissolution of drug and polymer by the laser. There was no change in the physicochemical attributes of the printlets after exposure to high temperature and humidity except for a slight decrease in the crystalline content. This was due to the drug solubilization by the high humidity of the stability condition. There was a significant change in the powder characteristics before and after printing, which may impact the recyclability of the powder. The in vivo performance of the printlets was comparable to the compressed tablets, which indicates the therapeutic equivalence between the two formulations.
ACKNOWLEDGMENTS
This work was partly supported by National Institute of Health R56 grant #1R56HD106612-01.
Footnotes
Complete contact information is available at: https://pubs.acs.org/10.1021/acs.molpharmaceut.2c00306
The authors declare no competing financial interest.
Contributor Information
Tahir Khuroo, Irma Lerma Rangel College of Pharmacy, Texas A&M Health Science Center, Texas A&M University, College Station, Texas 77843-1114, United States.
Eman M. Mohamed, Irma Lerma Rangel College of Pharmacy, Texas A&M Health Science Center, Texas A&M University, College Station, Texas 77843-1114, United States Department of Pharmaceutics, Faculty of Pharmacy, Beni-Suef University, Beni-Suef 62514, Egypt.
Sathish Dharani, Irma Lerma Rangel College of Pharmacy, Texas A&M Health Science Center, Texas A&M University, College Station, Texas 77843-1114, United States.
Canberk Kayalar, Irma Lerma Rangel College of Pharmacy, Texas A&M Health Science Center, Texas A&M University, College Station, Texas 77843-1114, United States.
Tanil Ozkan, Dover Precision Components, Woodlands, Texas 77380, United States.
Mathew A. Kuttolamadom, Department of Engineering Technology & Industrial Distribution, College of Engineering, Texas A&M University, College Station, Texas 77843, United States
Ziyaur Rahman, Irma Lerma Rangel College of Pharmacy, Texas A&M Health Science Center, Texas A&M University, College Station, Texas 77843-1114, United States.
Mansoor A. Khan, Irma Lerma Rangel College of Pharmacy, Texas A&M Health Science Center, Texas A&M University, College Station, Texas 77843-1114, United States.
REFERENCES
- (1).WHO—The Top 10 Causes of Death, 2020. https://www.who.int/news-room/fact-sheets/detail/the-top-10-causes-of-death (accessed Dec 26, 2021).
- (2).WHO—Tuberculosis, 2021. https://www.who.int/news-room/fact-sheets/detail/tuberculosis (accessed Dec 26, 2021).
- (3).CDC—Tuberculosis Data and Statistics. https://www.cdc.gov/tb/statistics/default.htm (accessed Dec 26, 2021).
- (4).Ilievska-Poposka B; Metodieva M; Zakoska M; Vragoterova C; Trajkov D Latent Tuberculosis Infection - Diagnosis and Treatment. Open Access Maced. J. Med. Sci 2018, 6, 651–655. [DOI] [PMC free article] [PubMed] [Google Scholar]
- (5).Kiazyk S; Ball TB Latent tuberculosis infection: An overview. Can. Commun. Dis. Rep 2017, 43, 62–66. [DOI] [PMC free article] [PubMed] [Google Scholar]
- (6).Lee SH Tuberculosis Infection and Latent Tuberculosis. Tuberc. Respir. Dis 2016, 79, 201–206. [DOI] [PMC free article] [PubMed] [Google Scholar]
- (7).CDC—Treatment of TB Disease. https://www.cdc.gov/tb/topic/treatment/tbdisease.htm (accessed Dec 26, 2021).
- (8).CDC—Treatment Regimen for Latent TB Infection. https://www.cdc.gov/tb/topic/treatment/ltbi.htm (accessed Dec 26, 2021).
- (9).Jhun BW; Koh WJ Treatment of Isoniazid-Resistant Pulmonary Tuberculosis. Tuberc. Respir. Dis 2020, 83, 20–30. [DOI] [PMC free article] [PubMed] [Google Scholar]
- (10).Mieras L; Anthony R; van Brakel W; Bratschi MW; van den Broek J; Cambau E; Cavaliero A; Kasang C; Perera G; Reichman L; Richardus JH; Saunderson P; Steinmann P; Yew WW Negligible risk of inducing resistance in Mycobacterium tuberculosis with single-dose rifampicin as post-exposure prophylaxis for leprosy. Infect. Dis. Poverty 2016, 5, No. 46. [DOI] [PMC free article] [PubMed] [Google Scholar]
- (11).Chakraborty S; Rhee KY Tuberculosis Drug Development: History and Evolution of the Mechanism-Based Paradigm. Cold Spring Harbor Perspect. Med 2015, 5, No. a021147. [DOI] [PMC free article] [PubMed] [Google Scholar]
- (12).FDA-Approved Drugs. Drugs@FDA: Nydrazid. https://www.accessdata.fda.gov/scripts/cder/daf/index.cfm?event=overview.process&ApplNo=008662 (accessed Dec 26, 2021). [Google Scholar]
- (13).Saktiawati AMI; Sturkenboom MG; Stienstra Y; Subronto YW; Sumardi; Kosterink JG; van der Werf TS; Alffenaar JW Impact of food on the pharmacokinetics of first-line anti-TB drugs in treatment-naive TB patients: a randomized crossover trial. J. Antimicrob. Chemother 2016, 71, 703–710. [DOI] [PubMed] [Google Scholar]
- (14).Xu J; Jin H; Zhu H; Zheng M; Wang B; Liu C; Chen M; Zhou L; Zhao W; Fu L; Lu Y Oral bioavailability of rifampicin, isoniazid, ethambutol, and pyrazinamide in a 4-drug fixed-dose combination compared with the separate formulations in healthy Chinese male volunteers. Clin. Ther 2013, 35, 161–168. [DOI] [PubMed] [Google Scholar]
- (15).https://www.accessdata.fda.gov/scripts/cder/daf/index.cfm?event=BasicSearch.process Drugs@FDA: FDA-Approved Drugs—Isoniazid (accessed Dec 26, 2021).
- (16).Gudeman J; Jozwiakowski M; Chollet J; Randell M Potential risks of pharmacy compounding. Drugs R&D 2013, 13, 1–8. [DOI] [PMC free article] [PubMed] [Google Scholar]
- (17).NIH 2020—Best Pharmaceuticals for Children Act (BPCA) Priority List of Needs in Pediatric Therapeutics. https://www.nichd.nih.gov/sites/default/files/inline-files/2020PriorityListFeb20.pdf (accessed Dec 26, 2021).
- (18).Khan MA Some Challenges in the Development of Pediatric Formulations; FDA Pediatric Advisory Committee, 2012. http://www.fda.gov/downloads/AdvisoryCommittees/CommitteesMeetingMaterials/PediatricAdvisoryCommittee/UCM289938.pdf (accessed Dec 27, 2021). [Google Scholar]
- (19).Ivanovska V; Rademaker CMA; van Dijk L; Mantel-Teeuwisse AK Pediatric drug formulations: A review of challenges and progress. Pediatrics 2014, 134, 361. [DOI] [PubMed] [Google Scholar]
- (20).Rahman Z; Barakh Ali SF; Ozkan T; Charoo NA; Reddy IK; Khan MA Additive Manufacturing with 3D Printing: Progress from Bench to Bedside. AAPS J. 2018, 20, No. 101. [DOI] [PubMed] [Google Scholar]
- (21).Karavasili C; Gkaragkounis A; Moschakis T; Ritzoulis C; Fatouros DG Pediatric-friendly chocolate-based dosage forms for the oral administration of both hydrophilic and lipophilic drugs fabricated with extrusion-based 3D printing. Eur. J. Pharm. Sci 2020, 147, No. 105291. [DOI] [PubMed] [Google Scholar]
- (22).Scoutaris N; Ross SA; Douroumis D 3D Printed ″Starmix″ Drug Loaded Dosage Forms for Paediatric Applications. Pharm. Res 2018, 35, No. 34. [DOI] [PubMed] [Google Scholar]
- (23).Charoo NA; Barakh Ali SF; Mohamed EM; Kuttolamadom MA; Ozkan T; Khan MA; Rahman Z Selective laser sintering 3D printing - an overview of the technology and pharmaceutical applications. Drug Dev. Ind. Pharm 2020, 46, 869–877. [DOI] [PubMed] [Google Scholar]
- (24).Melocchi A; Uboldi M; Maroni A; Foppoli A; Palugan L; Zema L; Gazzaniga A 3D printing by fused deposition modeling of single- and multi-compartment hollow systems for oral delivery - A review. Int. J. Pharm 2020, 579, No. 119155. [DOI] [PubMed] [Google Scholar]
- (25).Feuerbach T; Kock S; Thommes M Characterisation of fused deposition modeling 3D printers for pharmaceutical and medical applications. Pharm. Dev. Technol 2018, 23, 1136–1145. [DOI] [PubMed] [Google Scholar]
- (26).Karakurt I; Aydoğdu A;Çıkrıkcı S; Orozco J; Lin L Stereolithography (SLA) 3D printing of ascorbic acid loaded hydrogels: A controlled release study. Int. J. Pharm 2020, 584, No. 119428. [DOI] [PubMed] [Google Scholar]
- (27).Xu X; Awad A; Robles-Martinez P; Gaisford S; Goyanes A; Basit AW Vat photopolymerization 3D printing for advanced drug delivery and medical device applications. J. Controlled Release 2021, 329, 743–757. [DOI] [PubMed] [Google Scholar]
- (28).Mohamed EM; Barakh Ali SF; Rahman Z; Dharani S; Ozkan T; Kuttolamadom MA; Khan MA Formulation Optimization of Selective Laser Sintering 3D-Printed Tablets of Clindamycin Palmitate Hydrochloride by Response Surface Methodology. AAPS PharmSciTech 2020, 21, No. 232. [DOI] [PubMed] [Google Scholar]
- (29).Hamed R; Mohamed EM; Rahman Z; Khan MA 3D-printing of lopinavir printlets by selective laser sintering and quantification of crystalline fraction by XRPD-chemometric models. Int. J. Pharm 2021, 592, No. 120059. [DOI] [PubMed] [Google Scholar]
- (30).Barakh Ali SF; Mohamed EM; Ozkan T; Kuttolamadom MA; Khan MA; Asadi A; Rahman Z Understanding the effects of formulation and process variables on the printlets quality manufactured by selective laser sintering 3D printing. Int. J. Pharm 2019, 570, No. 118651. [DOI] [PubMed] [Google Scholar]
- (31).Isoniazid. Tuberculosis 2008, 88, 112 116. DOI: 10.1016/S1472-9792(08)70011-8. [DOI] [PubMed] [Google Scholar]
- (32).Ott Joslin J Blood collection techniques in exotic small mammals. J. Exot. Pet Med 2009, 18, 117–139. [Google Scholar]
- (33).Harcourt-Brown F Anesthesia and Analgesia. Textbook of Rabbit Medicine; Elsevier, 2002; Chapter 5, pp 121–139. [Google Scholar]
- (34).Awad A; Yao A; Trenfield SJ; Goyanes A; Gaisford S;Basit AW 3D printed tablets (printlets) with braille and moon patterns for visually impaired patients. Pharmaceutics 2020, 12, No. 172. [DOI] [PMC free article] [PubMed] [Google Scholar]
- (35).USP43-NF38. Isoniazid Tablets Monograph, 2021, p 2426.
- (36).FDA Guidance for Industry. M9 Biopharmaceutics Classification System Based Biowaivers, 2021.
- (37).Janssens S; de Armas HN; Remon JP; Van den Mooter G The use of a new hydrophilic polymer, Kollicoat IR, in the formulation of solid dispersions of Itraconazole. Eur. J. Pharm. Sci 2007, 30, 288–294. [DOI] [PubMed] [Google Scholar]
- (38).Development and Characterization of Poly(vinyl acetate) BasedOral Dosage Forms. Dissertation, Martin Luther University: Halle-Wittenberg, Germany, 2008. (accessed April 12, 2022). [Google Scholar]
- (39).Padhye N; Vallabh A Deformation-induced bonding of polymer films below the glass transition temperature. J. Appl. Polym. Sci 2021, 138, No. 50934. [Google Scholar]
- (40).Kollicoat Grades—Functional Polymers for the Pharmaceutical Industry; BASF. https://www.pharmaexcipients.com/wp-content/uploads/2020/11/Kollicoat-Grades-Functional-Polymers-for-the-Pharmaceutical-Industry.pdf (accessed Dec 19, 2021). [Google Scholar]
- (41).Gunasekaran S; Sailatha E; Seshadri S; Kumaresan S FTIR,FT Raman spectra and molecular structural confirmation of isoniazid. Indian J. Pure Appl. Phys 2009, 47, 12–18. [Google Scholar]
- (42).Aït Moussa L; El Bouazzi O; Serragui S; Soussi Tanani D; Soulaymani A; Soulaymani R Rifampicin and isoniazid plasma concentrations in relation to adverse reactions in tuberculosis patients: a retrospective analysis. Ther. Adv. Drug Saf 2016, 7, 239–247. [DOI] [PMC free article] [PubMed] [Google Scholar]
- (43).Prahl JB; Johansen IS; Cohen AS; Frimodt-Møller N; Andersen AB Clinical significance of 2 h plasma concentrations of first-line anti-tuberculosis drugs: a prospective observational study. J. Antimicrob. Chemother 2014, 69, 2841–2847. [DOI] [PubMed] [Google Scholar]
- (44).Saktiawati AMI; Sturkenboom MG; Stienstra Y; Subronto YW; Sumardi; Kosterink JG; van der Werf TS; Alffenaar JW Impact of food on the pharmacokinetics of first-line anti-TB drugs in treatment-naive TB patients: a randomized crossover trial. J. Antimicrob. Chemother 2016, 71, 703–710. [DOI] [PubMed] [Google Scholar]
- (45).Xu J; Jin H; Zhu H; Zheng M; Wang B; Liu C; Chen M; Zhou L; Zhao W; Fu L; Lu Y Oral bioavailability of rifampicin, isoniazid, ethambutol, and pyrazinamide in a 4-drug fixed-dose combination compared with the separate formulations in healthy Chinese male volunteers. Clin. Ther 2013, 35, 161–168. [DOI] [PubMed] [Google Scholar]
- (46).Thomas BH; Wong LT; Zeitz W; Solomonraj G Isoniazid metabolism in the rabbit, and the effect of rifampin pretreatment. Res. Commun. Chem. Pathol. Pharmacol 1981, 33, 235–247. [PubMed] [Google Scholar]
- (47).Kjellsson MC; Via LE; Goh A; Weiner D; Low KM; Kern S; Pillai G; Barry CE 3rd; Dartois V Pharmacokinetic evaluation of the penetration of antituberculosis agents in rabbit pulmonary lesions. Antimicrob. Agents Chemother 2012, 56, 446–457. [DOI] [PMC free article] [PubMed] [Google Scholar]


