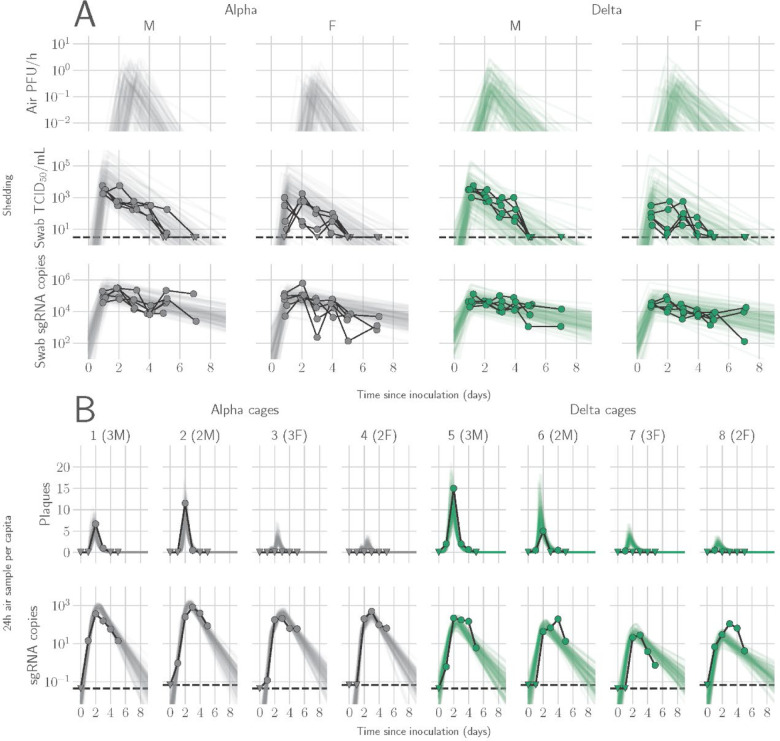
Figure 1. Alpha and Delta variant shedding profiles in oral swabs and air samples.
Syrian hamsters were inoculated with 103 TCID50 via the intranasal route with Alpha or Delta. A. Comparison of swab viral load and virus shedding into the air. Inferred profile of air shedding in PFU/h compared to sgRNA levels and infectious virus titers (TCID50/mL) in oropharyngeal swabs collected 1, 2, 3, 4, 5, and 7 DPI. Semitransparent lines are 100 random draws from the inferred posterior distribution of hamster within-host kinetics for each of the metrics. Joined points are individual measured timeseries for experimentally infected hamsters; each set of joined points is one individual. Measurements and inferences shown grouped by variant and animal sex. Measurement points are randomly jittered slightly along the x (time) axis to avoid overplotting. B. Viral sgRNA and infectious virus (PFU) recovered from cage air sample filters over a 24 h period starting at 0, 1, 2, 3, 4, and 5 DPI. Points are measured values, normalized by the number of hamsters in the cage (2 or 3) to give per-capita values. Downward-pointing arrows represent virus below the limit of detection (0 observed plaques or estimated copy number corresponding to Ct ≥ 40). Semitransparent lines are posterior predictions for the sample that would have been collected if sampling started at that timepoint; these reflect the inferred underlying concentrations of sgRNA and infectious virus in the cage air at each timepoint and are calculated from the inferred infection kinetics for each of the hamsters housed within the cage. 100 random posterior draws shown for each cage. Cages housed 2 or 3 hamsters; all hamsters within a cage were of the same sex and infected with the same variant. Column titles show cage number and variant, with number of and sex of individuals in parentheses. Dotted lines limit of detection. Grey = Alpha, teal = Delta, p-values are indicated where significant. Abbreviations: sg, subgenomic; TCID, Tissue Culture Infectious Dose; PFU, plaque forming unit; F, female; M, male; DPI, days post inoculation.

