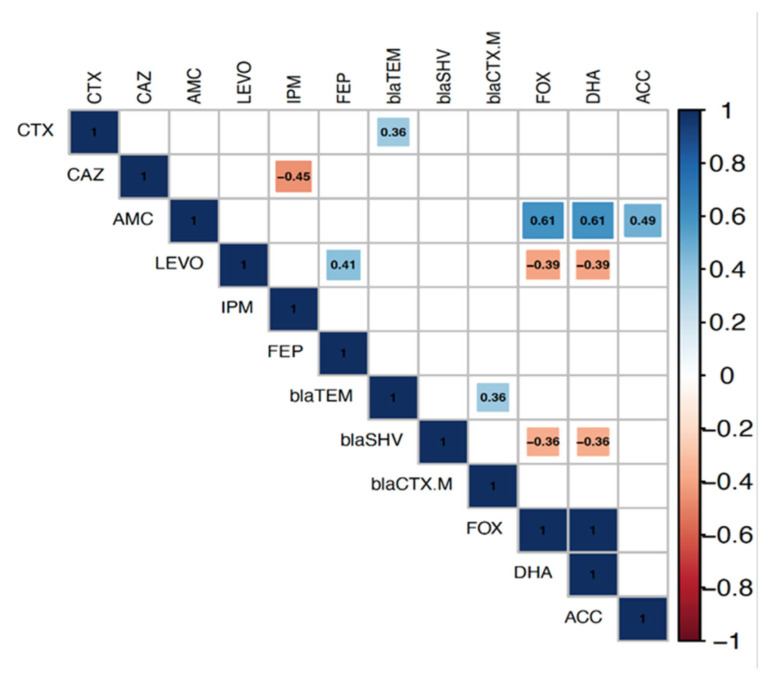
Figure 2.
Correlation analysis determines the associations between resistance genes and antimicrobial resistance phenotypes among Escherichia coli and Klebsiella isolates from humans, cattle, and poultry. The blue and red colors of the boxes indicate positive and negative correlations, respectively. The strength of the color corresponds to the numerical value of the correlation coefficient (r). Significance was calculated at p < 0.05, and boxes with non-significant correlations were left blank.

