Abstract
Optical clearing of the lung tissue aims to make it more transparent to light by minimizing light scattering, thus allowing reconstruction of the three-dimensional structure of the tissue with a much better resolution. This is of great importance for monitoring of viral infection impact on the alveolar structure of the tissue and oxygen transport. Optical clearing agents (OCAs) can provide not only lesser light scattering of tissue components but also may influence the molecular transport function of the alveolar membrane. Air-filled lungs present significant challenges for optical imaging including optical coherence tomography (OCT), confocal and two-photon microscopy, and Raman spectroscopy, because of the large refractive-index mismatch between alveoli walls and the enclosed air-filled region. During OCT imaging, the light is strongly backscattered at each air–tissue interface, such that image reconstruction is typically limited to a single alveolus. At the same time, the filling of these cavities with an OCA, to which water (physiological solution) can also be attributed since its refractive index is much higher than that of air will lead to much better tissue optical transmittance. This review presents general principles and advances in the field of tissue optical clearing (TOC) technology, OCA delivery mechanisms in lung tissue, studies of the impact of microbial and viral infections on tissue response, and antimicrobial and antiviral photodynamic therapies using methylene blue (MB) and indocyanine green (ICG) dyes as photosensitizers.
Keywords: Optical clearing, Lung tissue, Optical coherence tomography, Optical clearing agents, Antimicrobial/antiviral PDT
Introduction
The respiratory system consists of airways and lung parenchyma. The airways are represented by the bronchus, which bifurcates off the trachea and divides into bronchioles and then further into alveoli. The lung parenchyma is covered by a pleura and it performs the function of gas exchange and includes the alveoli, alveolar ducts, and bronchioles. Lungs have a spongy texture and they are anatomically described as having an apex, three borders, and three surfaces. Further, they subdivide into lobes and segments (Tucker et al. 2021; Burlew et al. 2021; Donley et al. 2021).
The trachea divides into the left and right primary bronchus, which then enters the left and right lung respectively. Once inside the lungs, the bronchi divide into narrower tubes called bronchioles, while this again branch into terminal bronchioles, the smallest respiratory tubes in human lungs. This intricate structure in each lung is called the bronchial tree. Both bronchi and bronchioles are encircled with hyaline cartilage rings to help them maintain their shape (https://www.innerbody.com/anatomy/respiratory/lungs).
Tiny air-filled sacs, alveoli are the primary functioning units of the lungs, the actual site of gas exchange. A healthy person has 300 to 700 million alveoli (480 million in average), meaning there are around 150 to 350 million alveoli in each lung (Ochs et al. 2004). The inner walls of the alveoli are lined with a thin layer of water and surfactant, known as the pulmonary surfactant, a protein–lipid mixture secreted by type II alveolar cells (Veldhuizen and Haagsman 2000; Knudsen and Ochs 2018). It plays a crucial role in reducing the surface tension of the alveoli to prevent them from collapsing during gas exchange. This, in turn, helps the lungs to maintain their shape (Seadler et al. 2022).
Optical clearing of the lung tissue aims to make it more transparent to light by minimizing light scattering, thus allowing reconstruction of the three-dimensional structure of the tissue with a much better resolution (Quirk et al. 2014; Tuchin 2015; Bashkatov et al. 2018; Oliveira and Tuchin 2019; Yu et al. 2021; Tuchina et al. 2021).
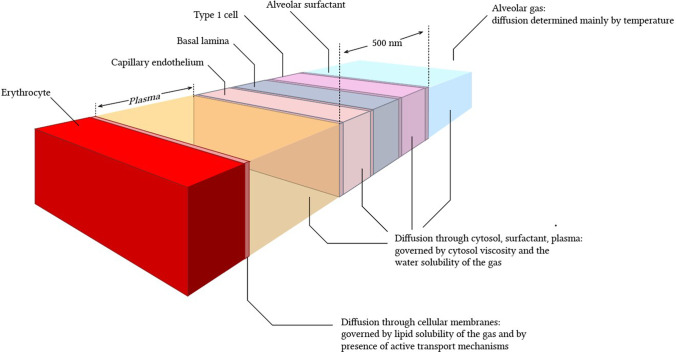
This is of great importance for monitoring of viral infection impact on the alveolar structure of the tissue and oxygen transport. Optical clearing agents (OCAs) can provide not only lesser light scattering of tissue components but also may influence the molecular transport function of the alveolar membrane (see Fig. 1).
Fig. 1.
Schematics of gas diffusion through a complex structure of the alveolar membrane. Reprinted from (Yartsev 2020) under the terms of the CC BY license
The lung’s internal structure within the respiratory parenchyma shows a gas exchange surface that is divided into a large number of small subunits (alveoli) connected to a branched conducting airway system. The mean alveolar number in humans is 274–790 million with the mean size of a single alveolus of 4.2 × 106 μm3 or approximately 200 μm in diameter (Ochs et al. 2004). Air-filled lungs present significant challenges for optical imaging including optical coherence tomography (OCT) (Quirk et al. 2014; Ding et al. 2021), confocal and two-photon microscopy, and Raman spectroscopy, because of the large refractive-index mismatch between alveoli walls and the enclosed air-filled region, major challenges are associated with the improvement of imaging resolution even further to the subcellular level (Yu et al. 2021; Lin et al. 2020; Yanina et al. 2020; Jaafar et al. 2021; Genina 2022).
Air-filled lungs represent a serious problem in obtaining optical images, including for optical coherence tomography (OCT), due to strong light scattering at tissue–air interfaces due to a significant difference between the refractive indices of the walls of the alveoli and the air filling them (Quirk et al. 2014; Yuan et al. 2022). When an OCT image is acquired, the light scatters strongly back at each tissue–air interface, so image reconstruction is usually limited to observing a single alveolus. Temporary and local filling of the alveoli with an OCA, which in this case can also include saline, since its refractive index is much higher than that of air, contributes to a much better optical transmission and the quality of the optical image of the lung tissue, which was first shown on freshly dissected intact sheep lungs using an optofluidic needle OCT probe during saline perfusion (Quirk et al. 2014; Listewnik et al. 2021).
Tissue optical clearing is performed by immersing tissues in optical clearing agents to reduce scattering and makes the tissues transparent. Existing methods of tissue optical clearing (TOC) can be divided into two categories, namely ex vivo and in vivo methods of TOC. The different principles of TOC are used: hydrophobic clearing methods, hydrophilic clearing methods, and hydrogel-based clearing methods (Ueda et al. 2020a). In combination with efficient fluorescence labeling and advanced optical tomography, TOC allows one to achieve high-throughput acquisition of biological structures within intact tissues/organs and even whole organisms; thus, it is widely used in many biomedical studies (Ueda et al. 2020b).
In this review, we present several optical technologies that are effective in the application of TOC technologies and allow the testing of lung tissue using inhaled aerosols in the context of monitoring the effects of viral infections. During the past decade, there has been an explosive growth in the development of new optical techniques in biomedical research and clinical applications. Enormous progress has been made in optical imaging and detection to provide essential biological information for disease diagnosis and in-depth understanding of biological processes (Xi et al. 2022).
OCT as a noninvasive imaging technology shows high cross-sectional image resolution similar to morphological examination. The TOC helps to minimize light scattering during imaging, which makes it possible to study lung tissues of larger volumes. TOC can be achieved by using physicochemical methods based on tissue reversible transformation protocols at application solutions providing refractive index matching and/or changing scatterer size. Studies on inhalation of propylene glycol (PG) and glycerol (Gly)-based e-cigarette liquids as OCAs and potential diagnostic tests to examine pathological changes in lung tissue in vivo are of great importance and will be discussed.
Experimental data on Raman spectroscopy, high-resolution optical microscopy, and integrating sphere spectrometry used to study the properties of lung tissue and whole blood in rats after OCA exposure in the form of inhalation aerosols of PG/Gly mixture. It was found that an increase in the Raman spectroscopy signals of PG/Gly in blood and a change in the size of red blood cells indicated the accumulation of components of e-liquid in the blood (Dyachenko et al. 2021).
Prospects of combined PDT and TOC, which is beneficial due to enhancement of absorption properties of the monomeric form of dyes (MB and ICG) in OCA solutions containing polyatomic alcohol, like Gly and PG, and decrease in tissue scattering within the target area, providing better light delivery to the deep tissue layers colonized by pathogens, are overviewed (Tuchina et al. 2021). For such OCA as Gly, its antimicrobial properties allow for getting a synergetic effect when applied in combination with UV light (Carneiro et al. 2021), or in combination with PDT photosensitizers and light with appropriate wavelength and power density.
For in vivo application of TOC, impact of OCAs on the mucosa of respiratory system organs that are involved in breathing, the nose, throat, larynx, trachea, bronchi, and lungs, is of specific interest because of toxicity and testing of viral-induced lesion issues, thus studies of OCA diffusivity and impact on tissue components (temporal dehydration, rehydration, interactions of proteins and lipids with OCAs), as well as diffusivity and staining efficiency by MB and ICG of lung tissues and phantoms are presented.
Prospects of multimodality and multifunctionality provided by TOC and advanced image data analysis like machine learning for a combination of optical imaging technologies (OCT, photoacoustic, Raman, FLIM, SHG, two-photon fluorescence) with the US, CT, and MRI techniques on the basis of unique properties of US coupling gel ((Novoselova et al. 2020), CT and MRI contrast agents (Tuchina et al. 2020, 2021) used as OCAs are demonstrated.
Optical clearing methods for lung tissue imaging
In vitro TOC of lungs
Understanding the architecture of a lung as a whole, using cellular resolution, and the study of changes in tissue and nerve structure during lung diseases are important problems in biology and medicine. The enhancement of lung transparency allows combination the benefits of maintaining organ integrity with the advantages of fluorescence microscopy, label-free multiphoton microscopy (MPM), second harmonic generation (SHG) microscopy, and other techniques of optical diagnostics to visualize fine cellular/subcellular structures. These TOC techniques are achieved by the reduction of light scattering of fixed organs due to the diluting/removing substances that induce light scattering (such as membrane lipids), swelling or shrinkage of tissues to alter the structure extracellular matrix, or by reducing the RI differences between scatterers and extracellular matrix. Immersion of lung into solvents during from few hours to few days allowed imaging lung structures by confocal, MPM, SHG microscopy or 3D Fourier domain optical coherence tomography (3-D FDOCT) imaging in several studies.
Meissner et al. (2009) developed a method to perform 3D imaging of whole enclosed alveoli by using TOC after perfusion fixation with glutaraldehyde (GA) in isolated rabbit lungs. Authors filled the fixed lungs with ethanol by perfusing with gradually increasing concentrations. Thus, no air bubbles remained in the alveolar structures, and therefore, the resolution and penetration depth of 3-D FDOCT imaging was drastically improved (Meissner et al. 2009).
Scott et al. (2014) fist demonstrated TOC-assisted whole lung nerve imaging and 3D structure of the mouse lung (airway, pleura, vascular, and airway branch generations). For TOC, authors used dehydration of lung tissue in methanol and refraction index (RI) matching in a 1:2 vol/vol mixture of benzyl alcohol and benzyl benzoate (BABB) (Scott et al. 2014). Monitoring of lung fibrosis using optimized BABB was presented in work of Ochoa et al. (2018) where combined TOC with MPM and SHG microscopies were used to reveal the complete network of fibrillar collagen in whole murine lungs (Ochoa et al. 2018). In Ref (Mzinza et al. 2018), full lung fluorescence light sheet microscopy imaging with immersion in tetrahydrofuran and dibenzyl ether (DBE) was demonstrated.
Kim et al. (2018) developed active clarity technique (ACT) for TOC including lungs. ACT process was divided into 5 steps: 1) fixation and polymerization, 2) RI-matching, 3) electrophoretic lipid-extraction, 4) washing, and 5) final RI-matching. Final lung transparency after 24-h procedure reached 90%.
The TOC technique named CLARITY combines electrophoretic removal of lipids with immersion in OCAs. It was used to render the lung transparency in Refs. (Oren et al. 2018; Lee et al. 2014). This procedure took 13–17 days and led to tissue swelling with considerable expansion of organ volume (Lee et al. 2014).
Ex vivo and in vivo TOC of lungs
In study by Selifonov et al. (2022), ex vivo clearing effect of vape mixture for the porcine gingival mucosa was assessed by combining the immersion technique with UV-spectroscopy, it was noted that the optical clearing efficiency is much higher in the deep-UV than in the visible-NIR range, the specific features of tissue optics with the formation of three dynamic optical windows in the UV were revealed. These results prove that RI mismatch in tissues is strong in the UV wavelength range, which causes a strong light scattering. Authors concluded that suppression of light scattering of the oral mucosa at the application of smoking liquid can be included in clinical protocols for personalized treatment of dental diseases using photothermal and photodynamic therapy, UV laser treatments, and optical diagnostics.
TOC in vitro and in vivo has significant differences. Firstly, in vivo TOC should be reversible with no tissue damage, therefore immersion should be provided with biocompatible OCAs. Secondly, the homeostatic reaction of a living organism does not allow achieving a high degree of TOC as permitted OCA concentrations and exposure times are limited. OCA diffuse from the treated area into the surrounding tissues, and their local concentration is constantly decreasing. Therefore, IR-matching cannot provide complete tissue transparency as in in vitro and ex vivo investigations.
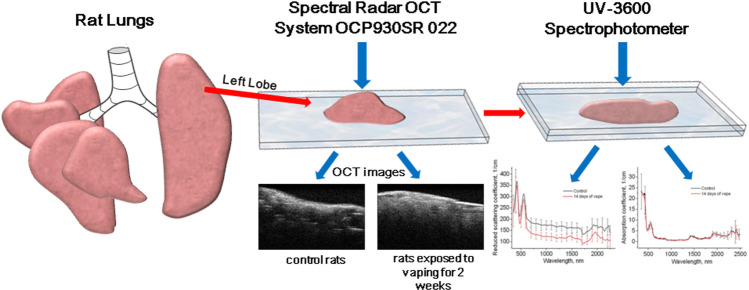
However, in vivo TOC is a very important problem. For example, morphological changes in lung tissue of rats after ex vivo and in vivo exposure to PG/Gly-based e-cigarette liquid for potential use as a diagnostic test were studied by Bucharskaya et al. (2022). At ex vivo exposure lungs of intact male Wistar rats were placed for 1 h in vape liquid containing 60% PG and 40% Gly. At in vivo exposure the rats of experimental group were placed in aerosol administration chamber and exposed to an aerosol of nicotine-free liquid for electronic cigarettes during several sessions of passive “smoking”—5 times in an hour for 10 min, interrupted by 2 min of free breathing outside the chamber (hood). For each session, 1.5 L of vapor from the vape is fed through an additional hose under the hood from a syringe, for a total of 7.5 L of vapor per hour. After the end of “smoking” sessions, the rat is removed from the experiment and lung tissue samples are taken for optical (Fig. 2) and histological examination (Bucharskaya et al. 2022).
Fig. 2.
Illustration of measurement of rat lung optical parameters
Lung tissues were examined ex vivo and in vivo by OCT using the THORLABS Spectral Radar OCT system (930 ± 5 nm, depth resolution in air is 6.2 µm, and the optical scanning depth in air is 1.6 mm). Lung tissue optical properties were studied in the spectral range of 300–2500 nm using a Shimadzu UV-3600 spectrophotometer (Japan) with an integrating sphere. Inverse Monte Carlo method was used to process experimental results and determine optical parameters (Bucharskaya et al. 2022).
After exposure ex vivo lung tissue samples to e-cigarette fluid, they were observed as OCT B-scans, as alveoli were filled with solution scattering was reduced. The structure of the tissue differs from that of the control samples (Fig. 3A, B). For in vivo exposure of rat lungs, sufficiently large and highly contrast voids were observed on the B-scans of lung tissue (Fig. 3C).
Fig. 3.
OCT B-scans of lung tissue: A) intact animal; B) after ex vivo exposure to e-cigarette fluid; C) after in vivo exposure to e-cigarette fluid. Reprinted from (Bucharskaya et al. 2022) under the terms of the CC BY license
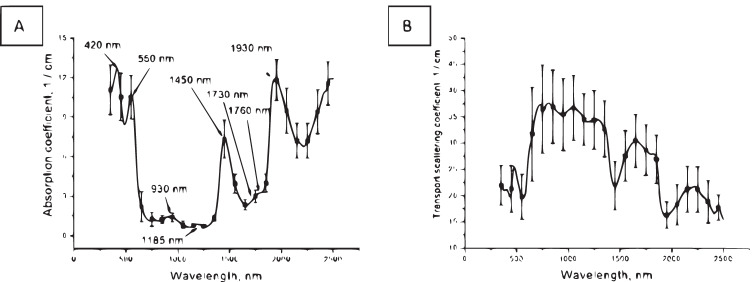
According to spectroscopy data: the absorption spectrum of ex vivo healthy lung tissue (Fig. 4A) is formed by deoxyhemoglobin (absorption bands with maxima at 420 nm and 550 nm), lipids (absorption bands with maxima at 930, 1730, and 1760 nm) and water (absorption bands with maxima at 1185, 1450, and 1930 nm). In the spectrum of the transport scattering coefficient (Fig. 4B) a dip in the region of the absorption band maxima is visible (Bucharskaya et al. 2022).
Fig. 4.
Absorption (A) and transport scattering coefficient (B) spectra of ex vivo healthy lung tissue. Reprinted from (Bucharskaya et al. 2022) under the terms of the CC BY license
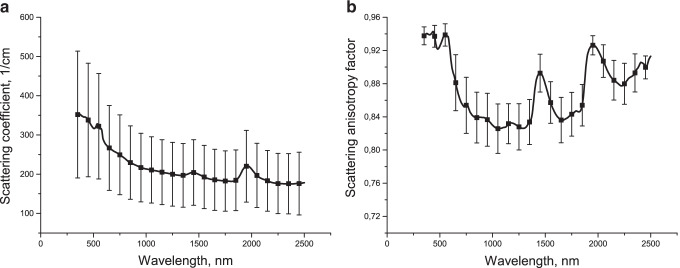
The difference from typical scattering spectra of other tissues is explained by the fact that while collagen fibers are the main type of scatterers for them, for lung tissue the main type of scatterers are air inhomogeneities, which significantly changes the light scattering pattern, which is also confirmed by spectral dependence of scattering anisotropy factor (Fig. 5a, b).
Fig. 5.
Scattering spectrum (a) and spectral dependence of scattering anisotropy factor (b) of ex vivo healthy lung tissue. Reprinted from (Bucharskaya et al. 2022) under the terms of the CC BY license
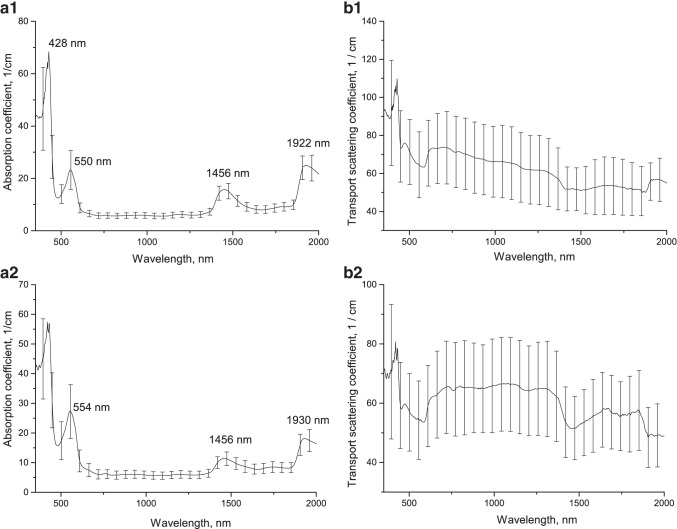
Figure 6 shows the optical parameters of lung tissue samples before and after ex vivo exposure to e-cigarette fluid, averaged over 10 samples. The tissue absorption spectrum before exposure (see Fig. 6a1) is also formed by deoxyhemoglobin (absorption bands with maxima at 430 and 555 nm) and water (absorption bands with maxima at 1450 and 1921 nm). After keeping the samples in the OCA, the absorption bands of deoxyhemoglobin and water were shifted (from 550 to 554 nm, from 1922 to 1930 nm), probably due to tissue dehydration (see Fig. 6a2). The shift of the water absorption band maxima from 1922 to 1930 nm can be explained by changes in the electronic-vibrational structure of water molecules with interstitial matrix proteins and structural components of cell membranes (Bashkatov et al. 2005).
Fig. 6.
Absorption and transport scattering coefficient spectra of lung tissue before (a1, b1) and after (a2, b2) ex vivo exposure to e-cigarette fluid
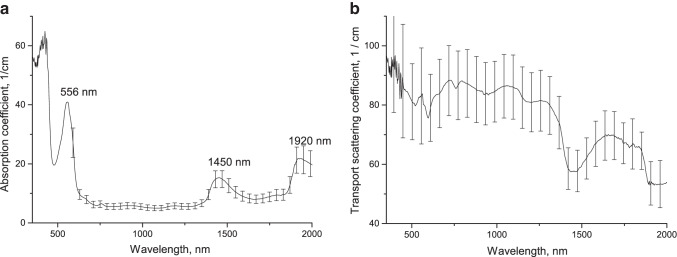
Figure 7 shows the optical parameters of lung tissue samples under in vivo exposure to e-cigarette fluid, averaged over 6 samples. The tissue absorption spectrum after exposure (see Fig. 7a) is also formed by deoxyhemoglobin (absorption band 556 nm) and water (absorption bands with maxima at 1450 and 1920 nm).
Fig. 7.
Absorption (a) and transport scattering coefficient (b) spectra of lung tissue after in vivo exposure to e-cigarette fluid
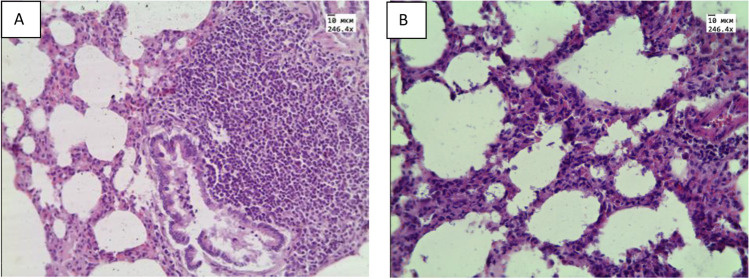
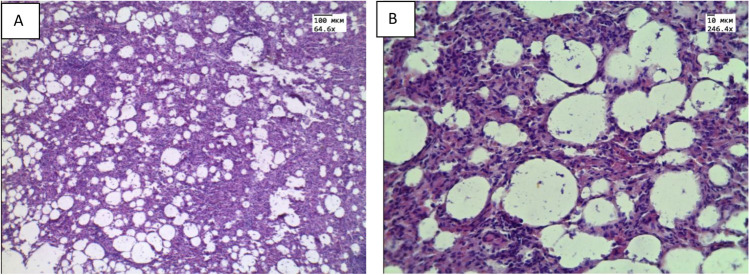
At histological examination of ex vivo specimens, plasma permeation and thickening of the interalveolar septa (Fig. 8B) due to infiltration with cellular elements were observed in the lungs. In the ex vivo samples, pronounced atelectasis was observed. Histological examination of specimens received from animals with in vivo aerosol administration showed areas of emphysematous enlargement of the alveoli, thickening of the alveolar septa and the phenomenon of plasma permeation (Fig. 9A,B).
Fig. 8.
Histological micrograph of lung tissue: A) intact animals; B) after ex vivo exposure of e-cigarette liquid. Magnification 246.4. Reprinted from (Bucharskaya et al. 2022) under the terms of the CC BY license
Fig. 9.
Histological micrograph of lung tissue after in vivo exposure to vape: A) Magnification 64.6; B) Magnification 246.4 Reprinted from (Bucharskaya et al. 2022) under the terms of the CC BY license
According to morphometric data for in vivo and ex vivo studies: the average thickness of the septum was 0.05 ± 0.02 mm and 0.03 ± 0.01 mm, respectively.
Although it is difficult to talk about true morphological changes in lung tissues in ex vivo experiments, since changes occur in tissues and cells even after they are removed from a living organism, both without exposure and under the influence of e-liquid, but the general trends in morphological changes in tissues coincide with ex vivo and in vivo exposure of e-cigarette liquid. Thus, under ex vivo and in vivo conditions, liquid under the influence of osmotic pressure is able to leave the bloodstream and impregnate tissue, which manifests itself in lung tissue in the form of plasma impregnation. Since the process of physiological respiration is absent in the lungs removed from the body, it is possible to develop the processes of decay and compaction of the lung tissue—atelectasis under ex vivo conditions. A decrease in the volume of air in the lung tissue and compaction of its structure can lead to a change in OCT signals, in contrast to intact lung tissue. Also in both cases, we observed a thickening of the interalveolar septa, due to the phenomenon of plasma impregnation in ex vivo conditions and infiltration by cellular elements in vivo conditions. Thus, ex vivo and in vivo exposure to e-liquid consisting of PG/Gly was found to result in optical clearing of lung tissue. During the histological examination of ex vivo and in vivo received samples, the observed morphological changes in the structure of the lung tissue corresponded to the changes recorded using OCT (Bucharskaya et al. 2022). The development of in vivo TOC technology requires additional studies on the safety of exposure to OCAs. Nevertheless, many of the substances that are potential OCAs are widely used in in vivo medical technologies (Becker et al. 2019), as well as for the storage of implantable organs (Oliveira & Tuchin 2019). For example, a low potassium dextran glucose (LPDG) solution was developed and is currently used as the gold standard for lung preservation (Jing et al. 2018).
Prolonged in vivo vaping
Measurements of optical parameters were carried out on ex vivo lung samples taken from rats of control group and vaping group with rats exposed to an aerosol of nicotine-free liquid for electronic cigarettes for 2 weeks in vivo. The animals were taken out of the experiment on the 14th day. Excretion was carried out by decapitation, with the preliminary introduction of a dissociative injectable anesthetic Zoletil100 (Valderham, France). During autopsy, lung tissue was taken. Using surgical scissors, the lung tissue of left lobe was cut into several parts, then the resulting lung samples were washed with saline to remove excess blood from the samples. Samples with an area of approximately 10 × 15 mm2 were used.
From the obtained tissue samples, optical parameters were measured using an optical coherence tomograph Spectral Radar OCT System OCP930SR 022 (Thorlabs Inc., USA) at a wavelength of 930 nm. The spectral band width of the instrument is 100 nm, the output power is 2 mW, the optical scanning depth in air is 1.6 mm, and the depth resolution of the system is 6.2 μm (https://www.thorlabs.com/catalogpages/595.pdf). The recorded tomograms were used to calculate the change in the light attenuation coefficient in the lung tissues of control and vaping groups of rats. The attenuation coefficient was calculated from three areas from each lung tissue sample, then the obtained values were averaged. The light attenuation coefficient µt in the samples at time t is determined by approximating the dependence of the intensity of reflected light I(z) on the depth of the studied area z of the A-scan recorded at time t by the equation:. The light attenuation coefficient µt in the lung tissues of control rats was 154.62 ± 30.26 cm−1, while in rats after two weeks in vivo exposure to e-cigarette fluid, the light attenuation coefficient µt was lower and amounted to 85.14 ± 17.35 cm−1.
After OCT measurements, these samples were prepared for spectral measurements. Each sample was placed between two glass slides, the thickness of each sample was measured at several points of the detected area, and the values were averaged. The average thickness of control and vaped samples was 0.46 ± 0.12 and 0.59 ± 0.13 mm, respectively.
The diffuse reflectance and total transmission spectra of the samples were recorded using a UV-3600 Spectrophotometer (Shimadzu, Japan) with an integrating sphere in the spectral range of 350–2500 nm with a step width of 2 nm. To ensure maximum sensitivity over the entire spectral range, the spectrophotometer uses three detectors: a PMT (in the UV and visible region), an InGaAs photodiode, and a cooled PbS (in the near IR region).
The measured total transmission and diffuse reflectance spectra of samples were used to calculate the spectral dependences of the reduced scattering and absorption coefficients of samples using the algorithm (https://omlc.org/software/iad/index.html) described in (Prahl 1995, 2011), which took into account the contribution to the spectra of glass slides, the values of the refractive index of the samples.
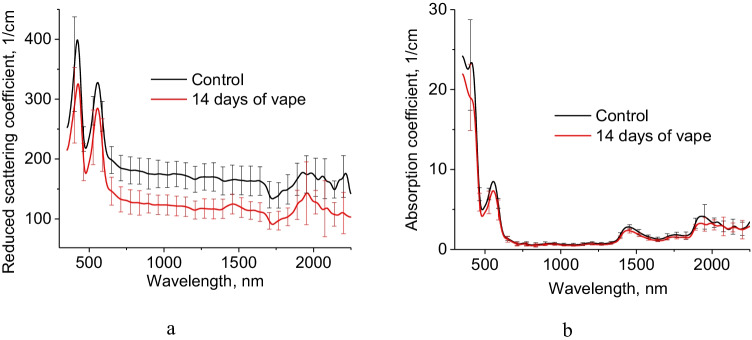
Figure 10 shows obtained spectra of the reduced scattering and absorption coefficients of ex vivo lung samples taken from control and vaping groups of rats. Obtained spectra show the contribution of deoxyhemoglobin at 420 and 550 nm, lipids at 1730 nm, water at 1450 and 1930 nm.
Fig. 10.
Reduced scattering (a) and absorption (b) coefficients of rat lung control group and after 14 days in vivo exposure to e-cigarette aerosol
Decrease of lung reduced scattering coefficient after 14 days in vivo exposure to e-cigarette aerosol was obtained from 600 to 2500 nm. Such reduction should be associated with PG/Gly action on tissue. Decrease of absorption coefficient of lung samples after 14 days in vivo exposure to e-cigarette aerosol at 1450 and 1930 nm demonstrates lung dehydration compare to control group. Absorption and reduced scattering coefficients of in vivo human lung tissue was presented in Ref. (Spliethoff et al. 2016).
Optical properties of in vitro and ex vivo lung tissue were previously summarized in Ref. (Bashkatov et al. 2011) taken from Ref. (Beek et al. 1997; Qu et al. 1994). Absorption spectra has the similar values to those presented in the current study except less absorption of hemoglobin and stronger water absorption.
Refractive index measurements of rat lung ex vivo
RI is one of the key optical properties of tissues, which varies approx. from 1.34 to 1.7 (Tuchin 2015; Lazareva et al. 2022). However, despite an extensive RI database, information for many tissues is still unavailable and little studied especially in a wide spectral range. Lung tissues are also poorly studied. All available data (Bolin et al. 1989; Pawley 2006) are summarized in Table 1 and Fig. 11. Due to lack of data, we were able to measured RI of lung tissue samples taken from rats of control and vaped animal groups using a multi-wavelength Abbe DR-M2/1550 refractometer (Atago, Japan) in the wavelength range from 480 to 1550 nm at room temperature 23 °C. The accuracy of the refractometer is 0.0002. These data also presented in Table 1.
Table 1.
Refractive index of lung tissues
| Wavelength, nm | RI | Notes | Ref |
|---|---|---|---|
| 630 | 1.38 | Fiber optic cladding method, dog tissue | Bolin et al. 1989 |
| 589 | 1.342 ± 0.002 | Pig tissue | Pawley 2006 |
|
480 486 546 589 644 656 680 800 930 1100 1300 1550 |
1.3730 ± 0.0080 1.3728 ± 0.0080 1.3697 ± 0.0082 1.3685 ± 0.0080 1.3667 ± 0.0080 1.3664 ± 0.0081 1.3656 ± 0.0081 1.3636 ± 0.0080 1.3609 ± 0.0080 1.3583 ± 0.0080 1.3539 ± 0.0080 1.3495 ± 0.0079 |
Multi-wavelength Abbe refractometer, t = 23 °C, ex vivo rat tissue | This work |
Fig. 11.
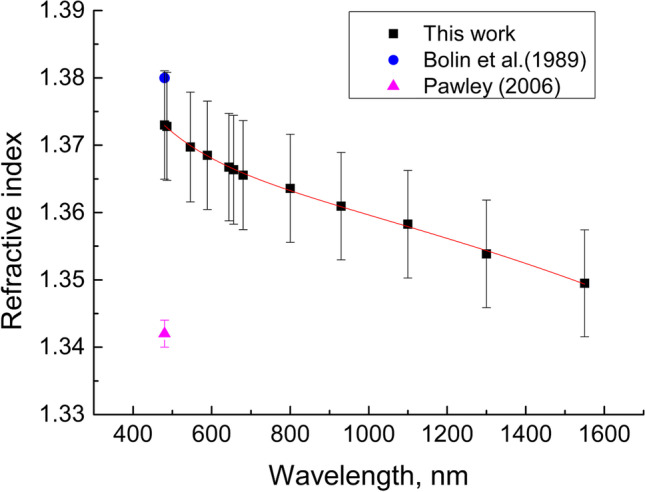
Dispersion dependence of the RI of rat lung tissue
Basing on the experimental data obtained for the spectral range 480–1550 nm, the Sellmeier dispersion formula was received:
The results obtained are more or less in agreement with the data available in the literature for the lung tissue of the other animals (see Table 1). The differences in RI may be associated with used measurement method and tissue conditions.
Table 2 and Fig. 12 show results of a change in the refraction properties of the rat lung ex vivo tissue exposed in vivo to prolonged action of vape.
Table 2.
RI of rat lung ex vivo tissue without vaping (control) and after 14 days of in vivo vaping
| Wavelength, nm | ncontrol | nvape |
|---|---|---|
| 480 | 1.3730 ± 0.0080 | 1.3833 ± 0.0053 |
| 486 | 1.3728 ± 0.0080 | 1.3817 ± 0.0053 |
| 546 | 1.3697 ± 0.0082 | 1.3750 ± 0.0052 |
| 589 | 1.3685 ± 0.0080 | 1.3722 ± 0.0048 |
| 644 | 1.3667 ± 0.0080 | 1.3691 ± 0.0052 |
| 656 | 1.3664 ± 0.0081 | 1.3677 ± 0.0052 |
| 680 | 1.3656 ± 0.0081 | 1.3670 ± 0.0052 |
| 800 | 1.3636 ± 0.0080 | 1.3647 ± 0.0050 |
| 930 | 1.3609 ± 0.0080 | 1.3627 ± 0.0052 |
| 1100 | 1.3583 ± 0.0080 | 1.3598 ± 0.0052 |
| 1300 | 1.3539 ± 0.0080 | 1.3536 ± 0.0053 |
| 1550 | 1.3495 ± 0.0079 | 1.3506 ± 0.0052 |
Fig. 12.
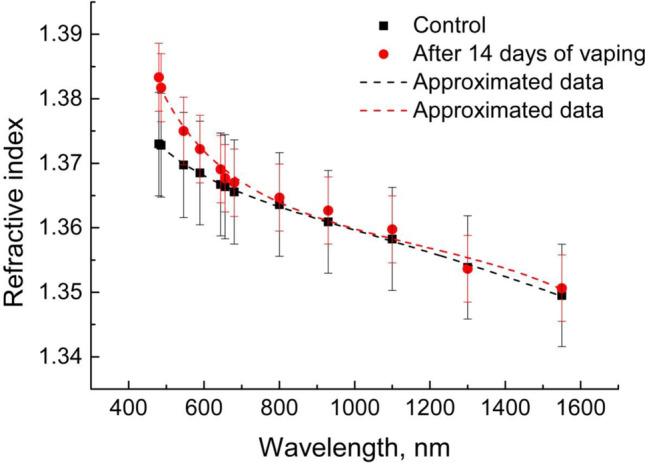
Dispersion dependence of RI of rat lung ex vivo tissues without vaping (control) and after 14 days of in vivo vaping
Basing on the experimental data obtained for the spectral range 480–1550 nm, the Sellmeier dispersion formulas were received for control samples and after in vivo vaping:
It can be noted that in Fig. 12 there is a noticeable increase in RI for the visible region of 480–680 nm. A significant contribution to RI in this region is made by blood components, in particular by hemoglobin which strong anomalous dispersion corresponds to the Soret band at 420 nm (Lazareva and Tuchin 2018). The increase in the RI after prolonged vaping can possibly be explained by changes associated with the additional blood supply to lung tissue and hemoglobin and other proteins binding with PG/Gly.
Raman spectroscopy
Raman spectroscopy (Tuchina et al. 2020) is one of the main methods for quantitative analysis of tissues, which makes it possible to determine the chemical composition and the presence of intermolecular bonds. In Fig. 12 the average Raman spectra of ex vivo rat lung tissue samples are shown. Table 3 demonstrates the main bands of the Raman spectra of the lungs from the available literature and this work for ex vivo rat lung tissue samples without and with prolonged in vivo rat vaping. The spectrum of lung tissue is characterized by the presence of strong frequency bands corresponding to nucleic acids (asymmetric stretching PO2 1217 cm–1 and wagging CH3CH2 1356 cm–1), tryptophan (616, 758, 959, and 1605 cm–1), and phenylalanine (1016 and 1605 cm–1).
Table 3.
The main bands of the Raman spectra of the lung tissues
| Data of this work | Data from literature | |||||
|---|---|---|---|---|---|---|
| Band frequency (cм−1) | Intensity without TOC (a. u.) | Intensity with TOC (a. u.) | [(I-ITOC)/I]*100 (%) |
Band frequency (cм−1) | Component/ Vibrational mode | Reference, comments |
| 556 | 1831 | 1983 | 7.7 | 560 | Amino acids | Mert et al. 2015, human lungs, ex vivo |
| 616 | 2100 | 2252 | 6.7 | 633 | Tryptophan | Oshima et al. 2010, human lung cell lines, ex vivo |
| 643 | 1774 | 1898 | 6.5 | 666 | C─S bond of cysteine | Mert et al. 2015, human lungs, ex vivo |
| 758 | 908 | 987 | 7.9 | 752 | Tryptophan | Oshima et al. 2010, human lung cell lines, ex vivo |
| 836 | 924 | 996 | 7.2 | 830 | Nucleic acids | Oshima et al. 2010, human lung cell lines, ex vivo |
| 937 | 867 | 942 | 8.0 | 936 | Stretching C—C | Oshima et al. 2010, human lung cell lines, ex vivo |
| 959 | 866 | 946 | 8.5 | 975.8 | Tryptophan | Oshima et al. 2010, human lung cell lines, ex vivo |
| 1016 | 1001 | 1095 | 8.6 | 1004 | Phenylalanine | Huang et al. 2003, bronchial tissue, human, ex vivo |
| 1049 | 1075 | 1172 | 8.3 | |||
| 1059 | 1083 | 1181 | 8.2 | 1086 | Nucleic acids | Oshima et al. 2010, human lung cell lines, ex vivo |
| 1081 | 1012 | 1097 | 7.8 | - | ||
| 1099 | 1066 | 1153 | 7.5 | 1100 | CC and CO in glucose | Roy et al. 2019, human serum, ex vivo |
| 1115 | 1061 | 1146 | 7.4 | |||
| 1154 | 1115 | 1203 | 7.3 | 1168 | ν (C-N) adenin | Roy et al. 2019, human serum, ex vivo |
| 1169 | 1142 | 1228 | 7.0 | |||
| 1217 | 885 | 959 | 7.7 | 1223 | PO2 − asymmetric stretching | Huang et al. 2003, bronchial tissue, human, ex vivo |
| 1356 | 502 | 531 | 5.4 | 1335 | DNA/proteins (collagen)/CH3CH2 wagging | Huang et al. 2003, bronchial tissue, human, ex vivo |
| 1605 | 934 | 1024 | 8.8 | 1602 | Phenylalanine | Huang et al. 2003, bronchial tissue, human, ex vivo |
For TOC studies, Fig. 13 presents average Raman spectrum and Table 3 shows the main Raman bands of rat lung ex vivo tissue samples after 14 days of in vivo rat vaping.
Fig. 13.
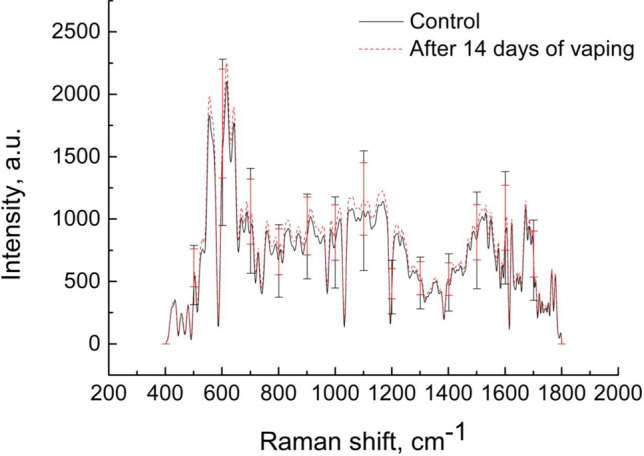
Average Raman spectra of rat lung ex vivo tissue samples without vaping (control) and after 14 days of rat vaping in vivo
Prolonged exposure to OCA aerosol in rats leads to an increase in the intensity of the signal of the Raman spectrum of lung tissues. The greatest increase in intensity is observed in the Raman bands of tryptophan and phenylalanine at 959, 1016, and 1605 cm–1 and amounts to 8.5, 8.6, and 8.8%, respectively. These results suggest that exposure to the OCA mixture causes irreversible metabolic processes in the animal body, in particular, affects the fundamental biochemical properties of lung tissue and its components.
Phototherapy and composition of the respiratory tract microbiome
The respiratory system, including the nasopharynx, trachea, bronchi and lungs, is normally characterized by a low density of symbiotic and transient microorganisms. The normal balance of bacteria, fungi and viruses is shifted in pathological conditions (asthma, chronic obstructive pulmonary disease, infectious processes). The respiratory tract is highly exposed to inhaled antigens and pollutants, which also contributes to the composition of the local microbiome (Sahin-Yilmaz and Naclerio 2011; Dickson et al. 2017; Faner et al. 2017).
In the nasopharynx, actively aerated by oxygen, representatives of the genera Corynebacterium and Propionibacterium persist, Streptococcus predominates in children, replaced in adults by representatives of the genus Staphylococcus, Bacteroidetes and Gammaproteobacteria are found in smaller quantities. The coexistence of dominant species can be maintained by the production of Propionibacterium spp. coproporphyrin III, which promotes the formation of Staphylococcus aureus biofilm (Kumpitsch et al. 2019; Santacroce et al. 2020; Pérez-Cobas et al. 2022).
The close connection of the oropharynx with the lower respiratory tract and the gastrointestinal tract causes the migration of a large number of exogenous microorganisms. Infectious agents can move into the lower respiratory tract. In healthy adults, the oropharynx is colonized by Streptococcus, Neisseria, Haemophilus spp. And gram-negative anaerobic species of Fusobacterium, Veillonella, Prevotella, such opportunistic and pathogenic species as S. pneumoniae, S. pyogenes, S. agalactiae are found here (Kumpitsch et al. 2019; Pérez-Cobas et al. 2022).
The local microbiome of the lungs depends on such mechanical factors as aspiration, the work of the epithelium of the bronchi and bronchioles, and cough. A decrease in the protective properties of integumentary tissues and a violation of microbial elimination increases the risk of developing pulmonary infections. The lung microbiome of healthy people consists of bacteria (Veillonella, Prevotella, Fusobacteria, Streptococcus), viruses, bacteriophages and fungi (Aspergillus, Cladosporium, Eurotium, Penicillum) (Faner et al. 2017; Santacroce et al. 2020).
The causative agents of respiratory infections in 90% of cases are viruses (rhinoviruses, adenoviruses, infectious mononucleosis virus, coronaviruses), and 10% are caused by bacteria (S. pyogenes, S. mutans, Staphylococcus aureus, Moraxella catarrhalis, Haemophilus influenza) (Pérez-Cobas et al. 2022).
The leading causes of mortality are infections of the lower respiratory tract (bronchitis, bronchiolitis, pneumonia) of predominantly bacterial origin, the most common causative agent of which is Streptococcus pneumoniae, Haemophilus influenza, Pseudomonas aeruginosa, while about 30% of cases are co-infections with viruses (Santacroce et al. 2020).
Antimicrobial photodynamic therapy (APDT) is an affordable alternative method for the treatment of diseases of the respiratory tract, since it is a multipurpose method that does not cause resistance in microorganisms. The mechanism of the photodynamic action of light is based on the excitation of endogenous or exogenous light acceptors, called photosensitizers (PS). The photoexcitation chain reaction leads to the formation of reactive oxygen species (ROS) and peroxide radicals, which cause the oxidation of intracellular contents (from cell membranes to nucleic acids). Since ROS do not have a specific target molecule, the method does not cause the formation of resistance and can be used both against bacteria and fungi, and against viruses that have a lipid shell or residues of certain amino acids in their composition (Tuchin et al. 2022; Maisch 2015; Dias and Bagnato 2020; Wiehe et al. 2019; Blanco et al. 2017; Cassidy et al. 2011; Kassab et al. 2019).
A separate group are studies on the use of indocyanine green (ICG) as PS in PDT of respiratory system infections. Absorption of radiation in the IR region of the spectrum makes this dye an optimal means for the formation of a photodynamic reaction in the case when it is necessary to use radiation that penetrates deeply into tissues. Numerous data show that the most effective and safe for macroorganism cells is the ICG concentration of about 10 μM and the radiation dose of 120–200 J/cm2 (Topaloglu et al. 2013; Leite et al. 2018; Kassab et al. 2020). In our experiments on model microorganisms (S. epidermidis, S. aureus, Cutibacterium acnes), which are similar in physiology to the main bacteria that cause diseases of the respiratory tract, it has been shown that ICG concentrations 4 times lower (2.5 μM) are effective at a reported radiation dose of 140 J/cm2 (Tuchina and Tuchin 2009; Tuchina et al. 2011).
Usually, researchers face the difficult task of delivering a photosensitizer to a target organ or tissue. In the case of PDT of respiratory tract infections, a convenient alternative to injections and applications is spraying the dye in the form of an aerosol. A number of authors have shown the effectiveness of this method of PS delivery, while about 10% of radiation with wavelengths of 780–850 nm penetrates the lung parenchyma (Cassidy et al. 2011; Kassab et al. 2019).
PDT is not only an antibacterial agent, but is quite effective against viral infections of the respiratory system. It has been shown that PDT can be successfully used in such diseases as recurrent respiratory papillomatosis and herpes (Lieder et al. 2014; Zhang et al. 2014; Michutova et al. 2017). The COVID-19 pandemic dictated the importance of developing a method for the rapid elimination of viral particles from the respiratory system using a minimally invasive method. To date, data have already been obtained on the sensitivity of SARS-Cov-2 in vitro to PDT using methylene blue and radachlorin, or botanical extracts (Svyatchenko et al. 2021; Duguay et al. 2022).
Thus, it is possible to formulate the main tasks for optimizing PDT in infectious diseases of the respiratory system: i) the use of optical radiation with parameters for effective penetration into tissues, ii) the selection of a PS and its concentration sufficient for distribution along the respiratory tract, iii) the use of a combination of “light + FS”, capable of destroying both virions and regulating the number of conditionally pathogenic microorganisms.
Optical imaging and machine/deep learning for lung tissues studies
No doubt, artificial intelligence (AI) applications in medical images recognition and classification are hot-topic in applied medical science and partly in routine practice now. Numerical successful examples of X-ray, CT, MRI, US graphical data analysis by machine and deep learning are presented in the literature (Panayides et al. 2020). But conventional medical imaging modalities mostly measure tissue morphology. Oppositely, optical methods with few exceptions allow measuring tissue morphology and chemical content. Tissue optical imaging gives 3D high-volume spatial-spectral data that require sophisticated methods of useful information extracting and content analysis. Specific methods of machine and deep learning allow to tackle both tasks.
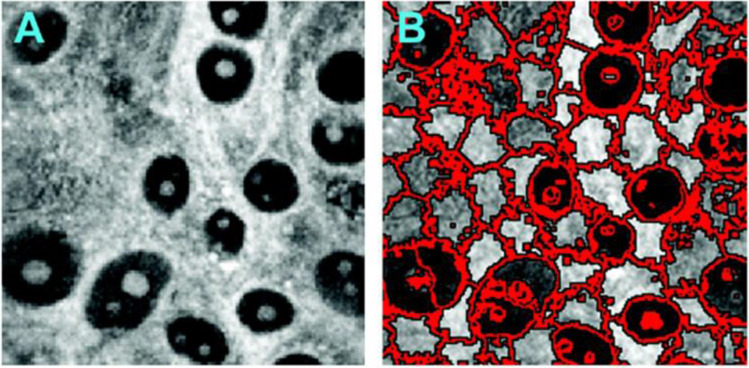
For instance, CARS provides sub-cell spatial resolution combined with a label-free morphological-spectral features’ extraction. But the latter requires involving high-experience experts and high-computation cost image processing. The machine learning based on molecular imaging data was used to identify cell types and state (Gao et al. 2012). The CARS images segmentation were implemented by 2D superpixels’ local clustering with further 3-D supervoxels’ forming. An example of similar segmentation approach implementation is shown in Fig. 14. Sub-cell image details were shown for extracted structures including cell nucleus positions and sizes that allowing cells’ differentiation.
Fig. 14.
An example of CARS image and its segmentation by 2D superpixels’ local clustering approach. Reprinted from (Gao et al. 2012) under the terms of the CC BY license
A deep learning algorithm for lung tissues’ CARS images classification was developed (Weng et al. 2017). Transfer learning was used to reduce a training set volume necessary for deep neural networks (DNNs) learning. The authors replaced the final classification layer, which works with necessary number of classes (healthy control and three types of lung cancers) in the GoogleNet Inception v3 DNN (see Fig. 15). The previous layers working with general visual features, such as texture edges or shapes were kept unchanged.
Fig. 15.
Transfer learning application for the GoogleNet Inception v3 DNN Reprinted from (Gao et al. 2012; Shlens 2016) under the terms of the CC BY license
Considering Raman spectra as speech signals for their identification was proposed (Qi et al. 2021). A short-time Fourier transform (STFT) widely used for speech analysis combined with a 33-layered convolutional neural network (CNN) (see Fig. 16) was applied to distinguish Raman spectra of pathological lung tissues. The 2D Raman spectrogram was composed by the Raman spectra STFT to achieve more accurate classification.
Fig. 16.
The 33-layered CNN model. Reprinted with permission from (Qi et al. 2021)
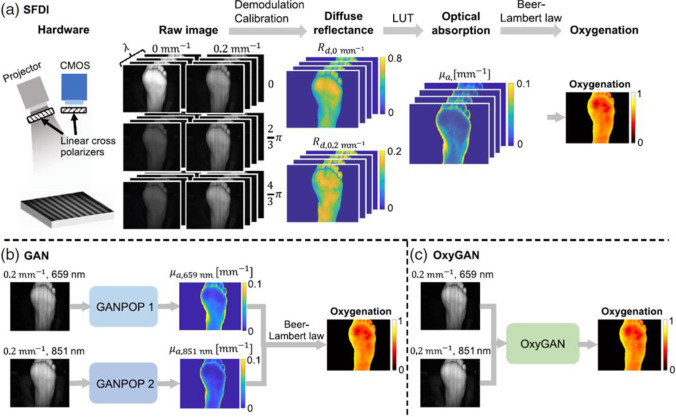
Mapping of tissue oxygenation using the spatial frequency-domain imaging (SFDI) needs six images with 0, 2/3 π, and 4/3 π phase offsets at two spatial frequencies and a pixel-wise lookup table (LUT) (see Fig. 17) (Chen et al. 2020; Vervandier and Gioux 2013). Generative adversarial networks (GAN) using generator/discriminator blocks can catch tissue optical properties of single structured-illumination images (see Fig. 16). But tissue oxygenation analysis by this technique requires using several spectral-specific GAN channels that is computer-consuming (Chen et al. 2020).
Fig. 17.
The implementations of tissue oxygenation analysis by SFDI (a), GAN (b), and OxyGAN (c). Reprinted from (Chen & Durr 2020a) under the terms of the CC BY license
Conclusion
The review presents general principles and advances in the field of tissue optical clearing (TOC) technology, OCA delivery mechanisms in lung tissue, studies of the impact of microbial and viral infections on tissue response, and antimicrobial and antiviral photodynamic phototherapies using methylene blue (MB) and indocyanine green (ICG) dyes as photosensitizers.
Studies on inhalation of PG/Gly-based e-cigarette liquids as OCAs and potential diagnostic tests to examine pathological changes in lung tissue ex vivo and in vivo were presented. Further research could focus on the safety assessment and validation of the developed diagnostic test in other animal models for biomedical applications.
Experimental data on Raman spectroscopy, high-resolution optical microscopy, and integrating sphere spectrometry used to study the properties of lung tissue in rats when exposed to OCA as a mixture of PG/Gly in the form of inhalation aerosols demonstrated signal enhancement and pathways for aerosols permeation into blood and other organs. An increase in the Raman spectroscopy signals of PG/Gly in blood and a change in the size of red blood cells indicating the accumulation of components of e-liquid in the blood stream will be also expected.
The use of the combined technology of PDT and TOC is a promising direction for further research due to the enhancement of the absorption properties of the monomeric form of dyes, such as MB, ICG et al., in OCA solutions containing polyatomic alcohols, for example, PG/Gly, and a decrease in tissue scattering within the target area, which provides better light delivery to the deep layers of tissues colonized by pathogens.
Advanced image analysis using machine learning methods is required to analyze the advantages of application a combination of optical imaging technologies, such as diffusion, OCT, photoacoustic, Raman, FLIM, SHG, two-photon fluorescence, to ensure multimodality and versatility when using the developed optical clearing methods.
Funding
The research was carried out with the support of a grant under the Decree of the Government of the Russian Federation No. 220 of 09 April 2010 (Agreement No. 075–15-2021–615 of 04 June 2021).
Declarations
Ethical approval
Animal experiments were performed in accordance with the Saratov State Medical University’s Ethics Committee (Protocol No. 7 of 01.02.2022).
Consent to participate
Not Applicable.
Consent for publication
Not Applicable.
Conflict of interests
All authors declare that they have no conflicts of interest.
Footnotes
Publisher's note
Springer Nature remains neutral with regard to jurisdictional claims in published maps and institutional affiliations.
References
- Bashkatov AN, Genina ÉA, Kochubey VI, et al. Optical properties of the subcutaneous adipose tissue in the spectral range 400–2500 nm. Opt Spectrosc. 2005;99:836–842. doi: 10.1134/1.2135863. [DOI] [Google Scholar]
- Bashkatov AN, Berezin KV, Dvoretskiy KN, Chernavina ML, Genina EA, Genin VD, Kochubey VI, Lazareva EN, Pravdin AB, Shvachkina ME, Timoshina PA, Tuchina DK, Yakovlev DD, Yakovlev DA, Yanina IY, Zhernovaya OS, Tuchin VV. Measurement of tissue optical properties in the context of tissue optical clearing. J Biomed Opt. 2018;23(9):091416. doi: 10.1117/1.JBO.23.9.091416. [DOI] [PubMed] [Google Scholar]
- Bashkatov AN, Genina EA, Tuchin VV (2011) Tissue optical properties. In: Boas DA, Pitris C, Ramanujam N (eds) Handbook of biomedical optics, 1st edn. CRC Press, Boca Raton, pp 74–110. 10.1201/b10951
- Becker LC, Bergfeld WF, Belsito DV, Hill RA, Klaassen CD, Liebler DC, Marks JG Jr, Shank RC, Slaga TJ, Snyder PW, Gill LJ, Heldreth B (2019) Safety assessment of glycerin as used in cosmetics. Int J Toxicol 38(3_suppl):6S–22S. https://doi.org/10.1177/1091581819883820 [DOI] [PubMed]
- Beek JF, Blokland P, Posthumus P et al (1997) In vitro double integrating-sphere optical properties of tissues between 630 and 1064 nm. Phys Med Biol 42:2255–2261 [DOI] [PubMed]
- Blanco KC, Inada NM, Carbinatto FM, Giusti AL, Bagnato VS. Treatment of recurrent pharyngotonsillitis by photodynamic therapy. Photodiagnosis Photodyn Ther. 2017;18:138–139. doi: 10.1016/j.pdpdt.2017.01.187. [DOI] [PubMed] [Google Scholar]
- Bolin FP, Preuss LE, Taylor RC, Ference RJ. Refractive index of some mammalian tissues using a fiber optic cladding method. Appl Opt. 1989;28:2297–2303. doi: 10.1364/AO.28.002297. [DOI] [PubMed] [Google Scholar]
- Bucharskaya A, Mudrak D, Yanina I, Navolokin N, Polozhenkov A, Genina E, Kistenev Yu, Tuchin V (2022) Morphological changes in rat lung tissue during inhalation of e-cigarette liquid aerosol. Proc. SPIE 12192, Opt Technol Biol Med 1219210. 10.1117/12.2627915
- Burlew JT, Weber C, Banks KP (2021) [Updated 2021 Jul 27]. In: StatPearls [Internet]. Treasure Island (FL): StatPearls Publishing; 2022 Jan-. Available from: https://www.ncbi.nlm.nih.gov/books/NBK532863/
- Carneiro I, Carvalho S, Henrique R, Selifonov A, Oliveira L, Tuchin VV. Enhanced ultraviolet spectroscopy by optical clearing for biomedical applications. IEEE J Select Tops Quant Electr. 2021;27(4):7200108. doi: 10.1109/jstqe.2020.3012350. [DOI] [Google Scholar]
- Cassidy CM, Tunney MM, Magee ND, Elborn JS, Bell S, Singh TRR, Donnelly RF. Drug and light delivery strategies for photodynamic antimicrobial chemotherapy (PACT) of pulmonary pathogens: A pilot study. Photodiagn Photodyn Ther. 2011;8:1–6. doi: 10.1016/j.pdpdt.2010.12.007. [DOI] [PubMed] [Google Scholar]
- Chen MT, Mahmood F, Sweer JA, Durr NJ. Ganpop: Generative adversarial network prediction of optical properties from single snapshot wide-field images. IEEE Trans Med Imaging. 2020;39(6):1988–1999. doi: 10.1109/TMI.2019.2962786. [DOI] [PMC free article] [PubMed] [Google Scholar]
- Chen MT, Durr NJ (2020a) Rapid tissue oxygenation mapping from snapshot structured-light images with adversarial deep learning. J Biomed Optics 25(11):112907–1–12. 10.1117/1.JBO.25.11.112907 [DOI] [PMC free article] [PubMed]
- Dias LD, Bagnato VS. An update on clinical photodynamic therapy for fighting respiratory tract infections: a promising tool against COVID-19 and its co-infections. Laser Phys Lett. 2020;17:083001. doi: 10.1088/1612-202X/ab95a9. [DOI] [Google Scholar]
- Dickson RP, Erb-Downward JR, Freeman CM, McCloskey L, Falkowski NR, Huffnagle GB, Curtis JL. Bacterial topography of the healthy human lower respiratory tract. Mbio. 2017;8:e02287–e2316. doi: 10.1128/mBio.02287-16. [DOI] [PMC free article] [PubMed] [Google Scholar]
- Ding M, Pan S-y, Huang J, Yuan C, Zhang Q, Zhu X-l, et al. Optical coherence tomography for identification of malignant pulmonary nodules based on random forest machine learning algorithm. PLoS ONE. 2021;16(12):e0260600. doi: 10.1371/journal.pone.0260600. [DOI] [PMC free article] [PubMed] [Google Scholar]
- Donley ER, Holme MR, Loyd JW (2021) Anatomy, Thorax, Wall Movements. [Updated 2021 Oct 14]. In: StatPearls [Internet]. Treasure Island (FL): StatPearls Publishing; 2022 Jan-. Available from: https://www.ncbi.nlm.nih.gov/books/NBK526023/ [PubMed]
- Duguay BA, Herod A, Pringle ES, Monro SMA, Hetu M, Cameron CG, McFarland SA, McCormick C. Photodynamic Inactivation of Human Coronaviruses. Viruses. 2022;14:110. doi: 10.3390/v14010110. [DOI] [PMC free article] [PubMed] [Google Scholar]
- Dyachenko PA, Dolotov LE, Lazareva EN, Kozlova AA, Inozemtseva OA, Verkhovskii RA, Afanaseva GA, Shushunova NA, Tuchin VV, Galanzha EI, Zharov VP. Detection of melanoma cells in whole blood samples using spectral imaging and optical clearing. IEEE J Sel Top Quantum Electron. 2021;27(4):72007. doi: 10.1109/jstqe.2020.3047437. [DOI] [Google Scholar]
- Faner R, Sibila O, Agusti A, Bernasconi E, Chalmers JD, Huffnagle GB, Manichanh C, Molyneaux PL, Paredes R, Brocal VP, et al. The microbiome in respiratory medicine: Current challenges and future perspectives. Eur Respir J. 2017;49:1602086. doi: 10.1183/13993003.02086-2016. [DOI] [PubMed] [Google Scholar]
- Gao L, Hammoudi AA, Li F, et al. Differential diagnosis of lung carcinoma with three-dimensional quantitative molecular vibrational imaging. J Biomed Optics. 2012;17(6):066017. doi: 10.1117/1.JBO.17.6.066017. [DOI] [PubMed] [Google Scholar]
- Genina EA. Tissue optical clearing: state of the art and prospects. Diagnostics. 2022;12:1534. doi: 10.3390/diagnostics12071534. [DOI] [PMC free article] [PubMed] [Google Scholar]
- Graczyk KM, Matyka M. Predicting porosity, permeability, and tortuosity of porous media from images by deep learning. Sci Rep. 2020;10:21488. doi: 10.1038/s41598-020-78415-x. [DOI] [PMC free article] [PubMed] [Google Scholar]
- Huang Z, McWilliams A, Lui H, et al. Near-infrared Raman spectroscopy for optical diagnosis of lung cancer. Int J Cancer. 2003;107:1047–1052. doi: 10.1002/ijc.11500. [DOI] [PubMed] [Google Scholar]
- Jaafar A, Mahmood MH, Holomb R, Himics L, Váczi T, Sdobnov AY, Tuchin VV, Veres M. Ex-vivo confocal Raman microspectroscopy of porcine skin with 633/785-nm laser excitation and optical clearing with glycerol/water/DMSO solution. J Innov Opt Health Sci. 2021;14(5):2142003. doi: 10.1142/S1793545821420037. [DOI] [Google Scholar]
- Jing L, Yao L, Zhao M, Peng Lp, Liu M (2018) Organ preservation: from the past to the future. Acta Pharmacol Sin 39:845–857 [DOI] [PMC free article] [PubMed]
- Kassab G, Geralde MC, Inada NM, Achiles AE, Guerra VG, Bagnato VS. Nebulization as a tool for photosensitizer delivery to the respiratory tract. J Biophotonics. 2019;12:e201800189. doi: 10.1002/jbio.201800189. [DOI] [PubMed] [Google Scholar]
- Kassab G, Cheburkanov V, Willis J, Moule MG, Kurachi C, Yakovlev V, Cirillo JD, Bagnato VS. Safety and delivery efficiency of a photodynamic treatment of the lungs using indocyanine green and extracorporeal near infrared illumination. J Biophotonics. 2020;13:e202000176. doi: 10.1002/jbio.202000176. [DOI] [PMC free article] [PubMed] [Google Scholar]
- Kim JH Jang, MJ, Choi J, Lee E, Song K-D, Cho J, Kim K-T, Cha H-J, Sun W (2018) Optimizing tissue-clearing conditions based on analysis of the critical factors affecting tissue clearing procedures. Sci Rep 8:12815. 10.1038/s41598-018-31153-7 [DOI] [PMC free article] [PubMed]
- Knudsen L, Ochs M. The micromechanics of lung alveoli: structure and function of surfactant and tissue components. Histochem Cell Biol. 2018;150(6):661–676. doi: 10.1007/s00418-018-1747-9. [DOI] [PMC free article] [PubMed] [Google Scholar]
- Kumpitsch C, Koskinen K, Schopf V, Moissl-Eichinger C. The microbiome of the upper respiratory tract in health and disease. BMC Biol. 2019;17:87. doi: 10.1186/s12915-019-0703-z. [DOI] [PMC free article] [PubMed] [Google Scholar]
- Lazareva EN, Oliveira L, Yanina IY, Chernomyrdin NV, Musina GR, Tuchina DK, Bashkatov AN, Zaytsev KI, Tuchin VV (2022) Refractive index measurements of tissue and blood components and OCAs in a wide spectral range. In: Tuchin VV, Zhu D, Genina EA (eds) Handbook of Tissue Optical Clearing: New Prospects in Optical Imaging, 1st Edition. CRC Press, Boca Raton, 141–166. 10.1201/9781003025252
- Lazareva EN, Tuchin VV. Measurement of refractive index of hemoglobin in the visible/NIR spectral range. J Biomed Opt. 2018;23(3):1–9. doi: 10.1117/1.JBO.23.3.035004. [DOI] [PubMed] [Google Scholar]
- Lee H, Park JH, Seo I, Park SH, Kim S (2014) Improved application of the electrophoretic tissue clearing technology, CLARITY, to intact solid organs including brain, pancreas, liver, kidney, lung, and intestine. BMC Dev Biol 14:48. 10.1186/s12861-014-0048-3 [DOI] [PMC free article] [PubMed]
- Leite S, Geralde MC, Salina ACG, Medeiros AI, Dovigo LN, Bagnato V. Inada N (2018) Near-infrared photodynamic inactivation of S. pneumoniae and its interaction with RAW 264.7 macrophages. J Biophotonics 11:1. 10.1002/jbio.201600283 [DOI] [PubMed]
- Lieder A, Khan MK, Lippert BM (2014) Photodynamic therapy for recurrent respiratory papillomatosis. Cochrane Database Syst Rev 6:CD009810. 10.1002/14651858.CD009810.pub2 [DOI] [PMC free article] [PubMed]
- Lin Q, Lazareva EN, Kochubey VI, Duan Y, Tuchin VV. Kinetics of optical clearing of human skin studied in vivo using portable Raman spectroscopy. Laser Phys Lett. 2020;17(10):105601. doi: 10.1088/1612-202x/abae6d. [DOI] [Google Scholar]
- Listewnik P, Ronowska M, Wasowicz M, Tuchin VV, Szczerska M (2021) Porous phantoms mimicking tissues—investigation of optical parameters stability over time. Materials 14:423–1–11. 10.3390/ma14020423 [DOI] [PMC free article] [PubMed]
- Lungs. In: Taylor T (ed) Innerbody Research [Internet]. Last Updated: Jul 30, 2020. https://www.innerbody.com/anatomy/respiratory/lungs
- Maisch T. Resistance in antimicrobial photodynamic inactivation of bacteria. Photochem Photobiol Sci. 2015;14:1518–1526. doi: 10.1039/c5pp00037h. [DOI] [PubMed] [Google Scholar]
- Meissner S, Knels L, Koch E. Improved three-dimensional Fourier domain optical coherence tomography by index matching in alveolar structures. J Biomed Opt. 2009;14(6):064037–64041. doi: 10.1117/1.3275472. [DOI] [PubMed] [Google Scholar]
- Mert S, Özbek E, Ötünçtemur A, Çulhaa M. Kidney tumor staging using surface-enhanced Raman scattering. J Biomed Opt. 2015;20(4):047002. doi: 10.1117/1.JBO.20.4.047002. [DOI] [PubMed] [Google Scholar]
- Michutova M, Mrazova V, Kudelova M, Smolinska M, Supolikova M, Vrbova M, Golais F. Herpes simplex viruses type 1 and 2 photoinactivated in the presence of methylene blue transform human and mouse cells in vitro. Acta Virol. 2017;61:308–315. doi: 10.4149/av_2017_309. [DOI] [PubMed] [Google Scholar]
- Microscopy and Laser Imaging: Spectral Radar OCT Systems. https://www.thorlabs.com/catalogpages/595.pdf. Accessed 17 Sept 2007
- Mzinza DT, et al. Application of light sheet microscopy for qualitative and quantitative analysis of bronchus-associated lymphoid tissue in mice. Cell Mol Immunol. 2018 doi: 10.1038/cmi.2017.150. [DOI] [PMC free article] [PubMed] [Google Scholar]
- Novoselova MV, Abakumova TO, Khlebtsov BN, Zatsepin TS, Lazareva EN, Tuchin VV, Zharov VP, Gorin DA, Galanzha EI (2020) Optical clearing for photoacoustic lympho- and angiography beyond conventional depth limit in vivo. Photoacoustics 100186. 10.1016/j.pacs.2020.100186 [DOI] [PMC free article] [PubMed]
- Ochoa LF, Kholodnykh A, Villarreal P, Tian B, Pal R, Freiberg AN, Brasier AR, Motamed M. Vargas G (2018) Imaging of murine whole lung fibrosis by large scale 3D microscopy aided by tissue optical clearing. Sci Rep. 2018;8:13348. doi: 10.1038/s41598-018-31182-2. [DOI] [PMC free article] [PubMed] [Google Scholar]
- Ochs M, Nyengaard JR, Jung A, Knudsen L, Voigt M, Wahlers T, Richter J, Gundersen HJG. The number of alveoli in the human lung. Am J Respir Crit Care Med. 2004;169:120–124. doi: 10.1164/rccm.200308-1107OC. [DOI] [PubMed] [Google Scholar]
- Oliveira L, Tuchin VV (2019) The optical clearing method: A new tool for clinical practice and biomedical engineering. Springer, New York
- Oren R, et al. Whole organ blood and lymphatic vessels imaging (WOBLI) Sci Rep. 2018;8:1412. doi: 10.1038/s41598-018-19663-w. [DOI] [PMC free article] [PubMed] [Google Scholar]
- Oshima Y, Shinzawa H, Takenaka T, et al. Discrimination analysis of human lung cancer cells associated with histological type and malignancy using Raman spectroscopy. J Biomed Opt. 2010;15(1):017009. doi: 10.1117/1.3316296. [DOI] [PubMed] [Google Scholar]
- Panayides AS, et al. AI in Medical Imaging Informatics: Current Challenges and Future Directions. IEEE J Biomed Health Informatics. 2020;24(7):1837–1857. doi: 10.1109/JBHI.2020.2991043. [DOI] [PMC free article] [PubMed] [Google Scholar]
- Pawley JB (2006) Guiding Principles of Specimen Preservation for Confocal Fluorescence Microscopy. In: Pawley, J. (eds) Handbook of Biological Confocal Microscopy. Springer, Boston, MA. 10.1007/978-0-387-45524-2_18
- Perez-Cobas AE, Baquero F, de Pablo R, Soriano MC, Coque TM. Altered ecology of the respiratory tract microbiome and nosocomial pneumonia. Front Microbiol. 2022;12:709421. doi: 10.3389/fmicb.2021.709421. [DOI] [PMC free article] [PubMed] [Google Scholar]
- Prahl S (1995) The adding-doubling method. In Welch AJ, van Gemert MJS (eds) Optical-Thermal Response of Laser Irradiated Tissue, Plenum Press, New York, pp 101–129
- Prahl S (2011) Everything I think you should know about Inverse Adding-Doubling. Oregon Medical Laser Center, St. Vincent Hospital, https://omlc.org/software/iad/manual.pdf. Accessed 08 June 2022.
- Qi Y, Yang L, Liu B, Liu L, Zheng Q, Liua D, Luoa J. Accurate diagnosis of lung tissues for 2D Raman spectrogram by deep learning based on short-time Fourier transform. Anal Chim Acta. 2021;1179:338821. doi: 10.1016/j.aca.2021.338821. [DOI] [PubMed] [Google Scholar]
- Qu J, MacAulay C, Lam S, et al. Optical properties of normal and carcinomatous bronchial tissue. Appl Opt. 1994;33:7397–7405. doi: 10.1364/AO.33.007397. [DOI] [PubMed] [Google Scholar]
- Quirk BC, McLaughlin RA, Pagnozzi AM, Kennedy BF, Noble PB, Sampson DD. Optofluidic needle probe integrating targeted delivery of fluid with optical coherence tomography imaging. Opt Lett. 2014;39:2888. doi: 10.1364/OL.39.002888. [DOI] [PubMed] [Google Scholar]
- Roy S, Perez-Guaita D, Bowden S, Heraud P, Wood BR. Spectroscopy goes viral: Diagnosis of hepatitis B and C virus infection from human sera using ATR-FTIR spectroscopy. Clinical Spectroscopy. 2019;1:100001. doi: 10.1016/j.clispe.2020.100001. [DOI] [Google Scholar]
- Sahin-Yilmaz A, Naclerio RM. Anatomy and physiology of the upper airway. Proc Am Thorac Soc. 2011;8:31–39. doi: 10.1513/pats.201007-050RN. [DOI] [PubMed] [Google Scholar]
- Santacroce L, Charitos IA, Ballini A, Inchingolo F, Luperto P, De Nitto E, Topi S. The Human Respiratory System and its Microbiome at a Glimpse. Biology. 2020;9:318. doi: 10.3390/biology9100318. [DOI] [PMC free article] [PubMed] [Google Scholar]
- Scott GD, Blum ED, Fryer AD, Jacoby DB. Tissue optical clearing, three-dimensional imaging, and computer morphometry in whole mouse lungs and human airways. Am J Respir Cell Mol Biol. 2014;51:43–55. doi: 10.1165/rcmb.2013-0284OC. [DOI] [PMC free article] [PubMed] [Google Scholar]
- Sdobnov AY, Darvin ME, Genina EA, Bashkatov AN, Lademann J, Tuchin VV. Recent progress in tissue optical clearing for spectroscopic application. Spectrochim Acta Part A Mol Biomol Spectrosc. 2018;197:216–229. doi: 10.1016/j.saa.2018.01.085. [DOI] [PubMed] [Google Scholar]
- Seadler BD, Toro F, Sharma S (2022) Physiology, Alveolar Tension. [Updated 2022 May 8]. In: StatPearls [Internet]. Treasure Island (FL): StatPearls Publishing; 2022 Jan-. Available from: https://www.ncbi.nlm.nih.gov/books/NBK539825/ [PubMed]
- Selifonov AA, Selifonova EI, Tuchin VV (2022) E-cigarette smoking vape impact on optical properties of porcine gingival mucosa measured ex vivo in the range from 200 to 800 nm. Proc SPIE 12192, Opt Technol Biol Med 1219211 (29 April 2022). 10.1117/12.2632629
- Shlens J (2016) Train your own image classifier with Inception in TensorFlow. https://research.googleblog.com/2016/03/train-your-ownimage-classifier-with.html (09 March 2016).
- Spliethoff JW, Prevoo W, Meier MAJ, Jong J, Klomp HM, Evers DJ, Sterenborg H, Lucassen GW, Hendriks BHW, Ruers TJM. Real-time in vivo tissue characterization with diffuse reflectance spectroscopy during transthoracic lung biopsy: a clinical feasibility study. Clin Cancer Res. 2016;22(2):357–365. doi: 10.1158/1078-0432.CCR-15-0807. [DOI] [PubMed] [Google Scholar]
- Svyatchenko VA, Nikonov SD, Mayorov AP, Gelfond ML, Loktev VB. Antiviral photodynamic therapy: Inactivation and inhibition of SARS-CoV-2 in vitro using methylene blue and radachlorin. Photodiagn Photodyn Thera. 2021;33:102112. doi: 10.1016/j.pdpdt.2020.102112. [DOI] [PMC free article] [PubMed] [Google Scholar]
- Topaloglu N, Gulsoy M, Yuksel S. Antimicrobial photodynamic therapy of resistant bacterial strains by indocyanine green and 809-nm diode laser. Photomed Laser Surg. 2013;31:155–162. doi: 10.1089/pho.2012.3430. [DOI] [PubMed] [Google Scholar]
- Tuchin VV (2015) Tissue Optics: Light Scattering Methods and Instruments for Medical Diagnostics. SPIE--The International Society for Optical Engineering; 3rd edition (February 9, 2015). 10.1117/3.1003040
- Tuchina ES, Tuchin VV. Low-intensity LED (625 and 405 nm) and laser (805 nm) killing of Propionibacterium acnes and Staphylococcus epidermidis. Proc SPIE. 2009;7165:7165I. doi: 10.1117/12.814812. [DOI] [Google Scholar]
- Tuchina ES, Tuchin VV, Khlebtsov BN, Khlebtsov NG. Phototoxic effect of conjugates of plasmon-resonance nanoparticles with indocyanine green dye on Staphylococcus aureus induced by IR laser radiation. Quantum Electron. 2011;41:354–359. doi: 10.1070/QE2011v041n04ABEH014595. [DOI] [Google Scholar]
- Tuchina DK, Meerovich IG, Sindeeva OA, Zherdeva VV, Savitsky AP, Bogdanov AA, Jr, Tuchin VV. Magnetic resonance contrast agents in optical clearing: Prospects for multimodal tissue imaging. J Biophotonics. 2020;13(11):e201960249. doi: 10.1002/jbio.201960249. [DOI] [PubMed] [Google Scholar]
- Tuchina DK, Meerovich IG, Sindeeva OA, Zherdeva VV, Kazachkina NI, Solov'ev ID, SavitskyAP BAA, Tuchin VV. Prospects for multimodal visualisation of biological tissues using fluorescence imaging. Quant Electr. 2021;51(2):104–117. doi: 10.1070/QEL17512. [DOI] [Google Scholar]
- Tuchin VV, Genina EA, Tuchina ES, Svetlakova AV, Svenskaya YI. Optical clearing of tissues: issues of antimicrobial phototherapy and drug delivery. Adv Drug Deliv Rev. 2022;180:114037. doi: 10.1016/j.addr.2021.114037. [DOI] [PubMed] [Google Scholar]
- Tuchin VV, Zhu D, Genina EA (2022) Handbook of tissue optical clearing: new prospects in optical imaging. CRC Press, London
- Tucker WD, Weber C, Burns B (2021) [Updated 2021 Jul 26]. In: StatPearls [Internet]. Treasure Island (FL): StatPearls Publishing; 2022 Jan-. Available from: https://www.ncbi.nlm.nih.gov/books/NBK534812/
- Ueda HR, Erturk A, Chung K, Gradinaru V, Chedotal A, Tomancak P, Keller PJ. Tissue clearing and its applications in neuroscience. Nat Rev Neurosci. 2020;21:61–79. doi: 10.1038/s41583-019-0250-1. [DOI] [PMC free article] [PubMed] [Google Scholar]
- Ueda HR, Dodt HU, Osten P, Economo MN, Chandrashekar J, Keller PJ. Whole-brain profiling of cells and circuits in mammals by tissue clearing and light-sheet microscopy. Neuron. 2020;106:369–387. doi: 10.1016/j.neuron.2020.03.004. [DOI] [PMC free article] [PubMed] [Google Scholar]
- Velazquez-Salazar JJ, Bazan-Dıaz L, Zhang Q, Mendoza-Cruz R, Montano-Priede L, Guisbiers G, Large N, Link S, Jose-Yacaman M. Controlled overgrowth of five-fold concave nanoparticles into plasmonic nanostars and their single-particle scattering sroperties. ACS Nano. 2019;13(9):10113–10128. doi: 10.1021/acsnano.9b03084. [DOI] [PubMed] [Google Scholar]
- Veldhuizen EJA, Haagsman HP (2000) Role of pulmonary surfactant components in surface film formation and dynamics. Biochimica et Biophysica Acta (BBA) - Biomembranes 1467(2):255–270. 10.1016/s0005-2736(00)00256-x [DOI] [PubMed]
- Vervandier J, Gioux S. Single snapshot imaging of optical properties. Biomed Opt Express. 2013;4(12):2938–2944. doi: 10.1364/BOE.4.002938. [DOI] [PMC free article] [PubMed] [Google Scholar]
- Weng S, Xu X, Li J, Wong STC. Combining deep learning and coherent anti-Stokes Raman scattering imaging for automated differential diagnosis of lung cancer. J Biomed Opt. 2017;22(10):106017. doi: 10.1117/1.JBO.22.10.106017. [DOI] [PMC free article] [PubMed] [Google Scholar]
- Wiehe AA, O'Brien JM, Senge MO. Trends and targets in antiviral phototherapy Photochem. Photobiol Sci. 2019;18:2565–2612. doi: 10.1039/c9pp00211a. [DOI] [PubMed] [Google Scholar]
- Xi P, Wei X, Qu J, et al. Shedding light on biology and healthcare—preface to the special issue on Biomedical Optics. Light Sci Appl. 2022;11:156. doi: 10.1038/s41377-022-00804-w. [DOI] [PMC free article] [PubMed] [Google Scholar]
- Yanina IY, Schleusener J, Lademann J, Tuchin VV, Darvin ME. The effectiveness of glycerol solutions for optical clearing of the intact skin as measured by confocal Raman microspectroscopy. Opt Spectrosc. 2020;128:759–765. doi: 10.1134/s0030400x20060259. [DOI] [Google Scholar]
- Yartsev A (2020) Diffusion of gases through the alveolar membrane. In: Deranged Physiology. A free online resource for Intensive Care Medicine [Internet] Available from: https://derangedphysiology.com/main/cicm-primary-exam/required-reading/respiratory-system/Chapter%20103/diffusion-gases-through-alveolar-membrane
- Yu T, Zhu J, Li D, Zhu D (2021) Physical and chemical mechanisms of tissue optical clearing. iScience 24(3):102178. 10.1016/j.isci.2021.102178 [DOI] [PMC free article] [PubMed]
- Yuan W, Thiboutot J, Park HC, Li A, Loube J, Mitzner W, Yarmus L, Brown RH, Li X(2022) Direct visualization and quantitative imaging of small airway anatomy in vivo using deep learning assisted diffractive OCT. IEEE Trans Biomed Eng. 10.1109/TBME.2022.3188173. Online ahead of print. [DOI] [PMC free article] [PubMed]
- Zhang YJ, Yang YG, Zou XB, Huang Z. 5-Aminolevulinic acid photodynamic therapy combined with CO2 laser therapy in treatment of laryngeal papilloma: case report. Photodiagnosis Photodyn Ther. 2014;14:131–133. doi: 10.1002/(sici)1097-0142(19970615)79:12<2282::aid-cncr2>3.0.co;2-o. [DOI] [PubMed] [Google Scholar]


