

Abstract
The computer-aided interpretation of fetal heart rate (FHR) and uterine contraction (UC) has not been developed well enough for wide use in delivery rooms. The main challenges still lie in the lack of unclear and nonstandard labels for cardiotocography (CTG) recordings, and the timely prediction of fetal state during monitoring. Rather than traditional supervised approaches to FHR classification, this paper demonstrates a way to understand the UC-dependent FHR responses in an unsupervised manner. In this work, we provide a complete method for FHR-UC segment clustering and analysis via the Gaussian process latent variable model, and density-based spatial clustering. We map the UC-dependent FHR segments into a space with a visual dimension and propose a trajectory-based FHR interpretation method. Three metrics of FHR trajectory are defined and an open-access CTG database is used for testing the proposed method.
Keywords: cardiotocography, trajectory of contraction-dependent fetal heart rate segments, unsupervised clustering
1. INTRODUCTION
Electrical fetal monitoring (EFM) provides continuous surveillance of fetal heart rate (FHR) and uterine activity (UA) in delivery rooms. This is also referred as cardiotocography (CTG). In the past decades, EFM techniques have been developed well and clinically used in many countries [1]. The aim of CTG monitoring is to alert obstetricians and gynecologists (OB-GYNs) of fetal hypoxia and acidosis during childbirth, allowing them to make timely decisions for surgical intervention. Traditionally, the patterns of CTG are visually examined by experienced OB-GYNs based on published guidelines [2, 3, 4]. A consistent interpretation of CTG and an accurate assessment of fetal wellbeing are not yet possible, owing to the noisy nature of measurements, different standards of reading resolution, as well as the subjective opinions of clinicians [5]. Hence, computer-aided FHR analysis has become a fast-growing field in recent years [6].
To achieve the goal of automatically and intelligently predicting the risk of fetal distress, data-driven machine learning (ML) techniques have been continuously studied. With the assistance from data and computation, the latent patterns and information that are hidden from human eyes can be explored. The representative works of FHR tracing interpretation mainly follow two directions: feature-based and neural network-based approaches. Among them, the FHR analysis with features are relatively plentiful. A comprehensive study in [7] reaches encouraging results by considering time-domain, frequency-domain and nonlinear features. In addition, nonparametric Bayesian approaches are also promising. For example, [8] makes use of fourteen FHR features in the hierarchical Dirichlet process mixture model for classification. Further, deep Gaussian process (GP) methods have also been investigated [9] for both supervised and unsupervised fetal status learning. Except for studying with features, some research leverages the power of neural network. In [10, 11], convolutional neural networks produce good performance by automatically conducting feature extraction and selection.
Even though many cutting-edge ML tools have been tested for FHR analysis, a reliable, interpretable, and applicable solution for CTG monitoring and prediction has not been found and/or accepted for a widespread use. The main challenges include the following two aspects. First, according to [3, 4], clinically, the FHR tracings are classified into three categories: normal, atypical or indeterminate, and abnormal. While there is broad consensus on the normal and abnormal classes, a large portion of FHR recordings, e.g. 50%-84%, are grouped to be uncertain. This fact leads to a problem that the agreement on the standards of CTG labeling are hard to achieve. While umbilical blood pH value is a common index of fetal status, experts have not settled on the threshold that can be used for classifying the fetuses. Also, such indicator cannot reflect the state of the fetus long before delivery. Second, most of the existing works of FHR assessment only consider information from FHR tracings, whereas little attention is put on other data resources, such as UA and clinical information. The inclusion of knowledge from UA signals could lead to improvements in evaluating fetal wellbeing. For example, [12] demonstrates a causal relationship from UA to FHR. In [9] and [13, 14], the features computed according to uterine contractions (UCs) show significant influence on performance enhancement.
In this paper, we propose to analyze segments of FHR data around the uterine contractions and cluster them in an unsupervised way. The math tools of this work include signal filtering and interpolation, the Gaussian process latent variable model (GPLVM) for reducing dimensionality, and density-based spatial clustering of applications with noise (DBSCAN) as an unsupervised clustering method. Additionally, in this paper, we use a method described in our previous work [15] for identifying contractions from UA recordings. We demonstrate the performance of the proposed method on real data.
2. PROBLEM AND BACKGROUND
Motivated by the aforementioned facts, we intend to take another approach to the problem of FHR monitoring. First of all, we will not consider the use of supervised learning for fetal status classification or prediction, but only use the experts’ labels as a reference for analysis. Secondly, we will also not take the entire FHR recordings or long segments as objects, but focus on the state of the fetus and its changes before and after contractions. We believe that the well-being of a fetus is well reflected through fetal responses to every UC. The advantages of our approach are 1) we get rid of the difficulties of measuring pH values and choosing thresholds, and 2) we start a time-dependent, also called event/contraction-dependent analysis, which will allow for online FHR monitoring
Some previous research supports our idea. To our knowledge, [16] is the first paper that mentioned using unsupervised technique for FHR clustering. Unfortunately, due to the undesirable results, this method was questioned by the authors. Years later, [9] considered using a five-layer deep GP to project the raw FHR recordings to a low-dimensional space. As uncertainty declines over layers, the normal and abnormal FHR samples are separated. Another recent work in [17] applied the phase space reconstruction to recover the latent manifolds of six consecutive FHR segments in the last thirty minutes before delivery. By comparing the manifolds of healthy and unhealthy fetal recordings and computing the Euclidean distances between them, the probabilities of being anomaly, i.e. abnormal sample, can be obtained. These results show that, as birth approaches, the statistical difference of outlier probabilities between data of healthy and unhealthy fetuses increases until the last five minutes.
3. MODEL AND METHOD
Our idea for contraction-dependent FHR segment clustering and analysis is elaborated in this section. We describe the data pre-processing, the access and use of UC information, feature extraction, dimensionality reduction, unsupervised clustering, result visualization and analysis. The flowchart of the entire solution is shown in Fig. 1.
Fig. 1:
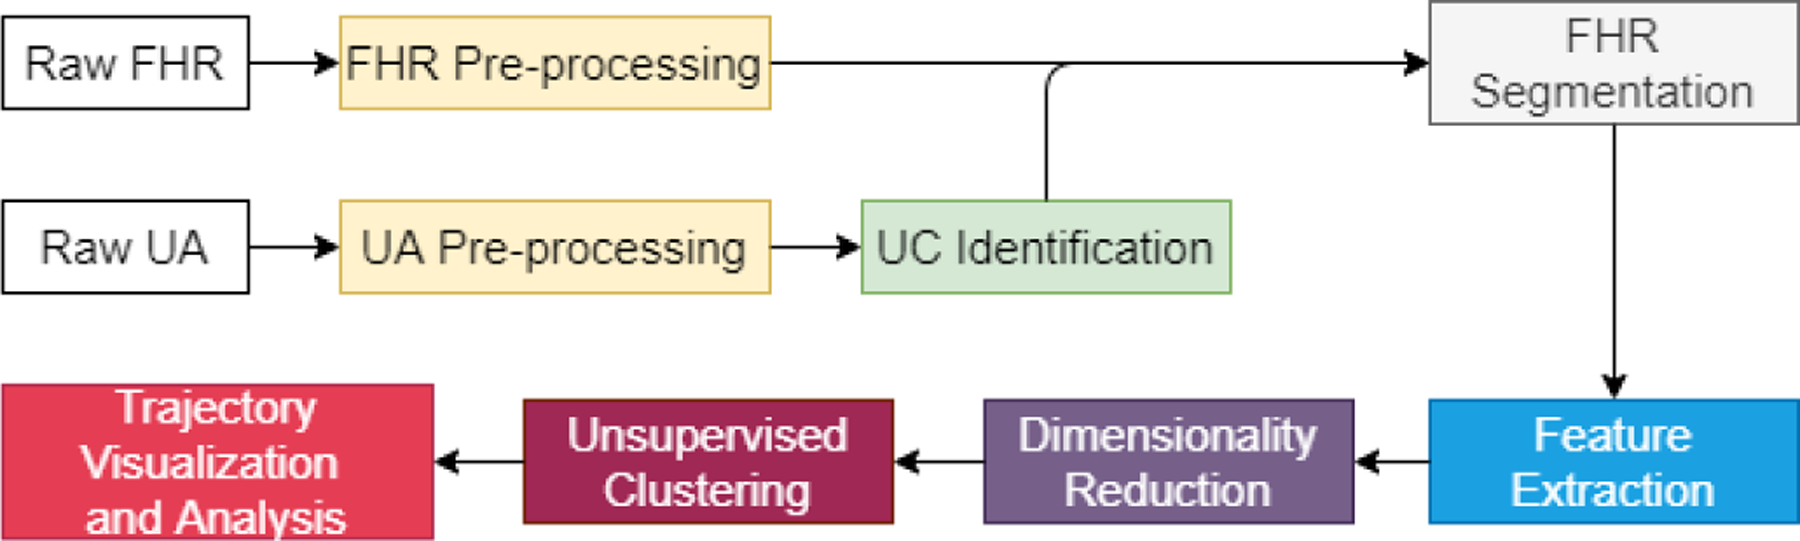
Flowchart of the proposed method.
3.1. Data Pre-processing
Given a CTG database, a critical first step is data pre-processing. The details about UA pre-processing can be found in [15]. For raw FHR, any zero-value sample means missing data, and samples outside of the range 50 bpm ~ 200 bpm are artifacts. Moreover, any successive samples with absolute differences greater than 25 bpm are regarded as abrupt increase or decrease, and if the differences are in 10 bpm ~ 25 bpm, they are unstable samples. The pre-processing of FHR includes two steps: 1) interpolating the missing samples and artifacts whose duration is less than 15 seconds, and 2) interpolating the unstable segments from an abrupt change to the first sample of the following stable segment, that is defined as any successive five samples with differences smaller than 10 bpm. Figure 2 compares the raw data and pre-processed data on a CTG example.
Fig. 2:
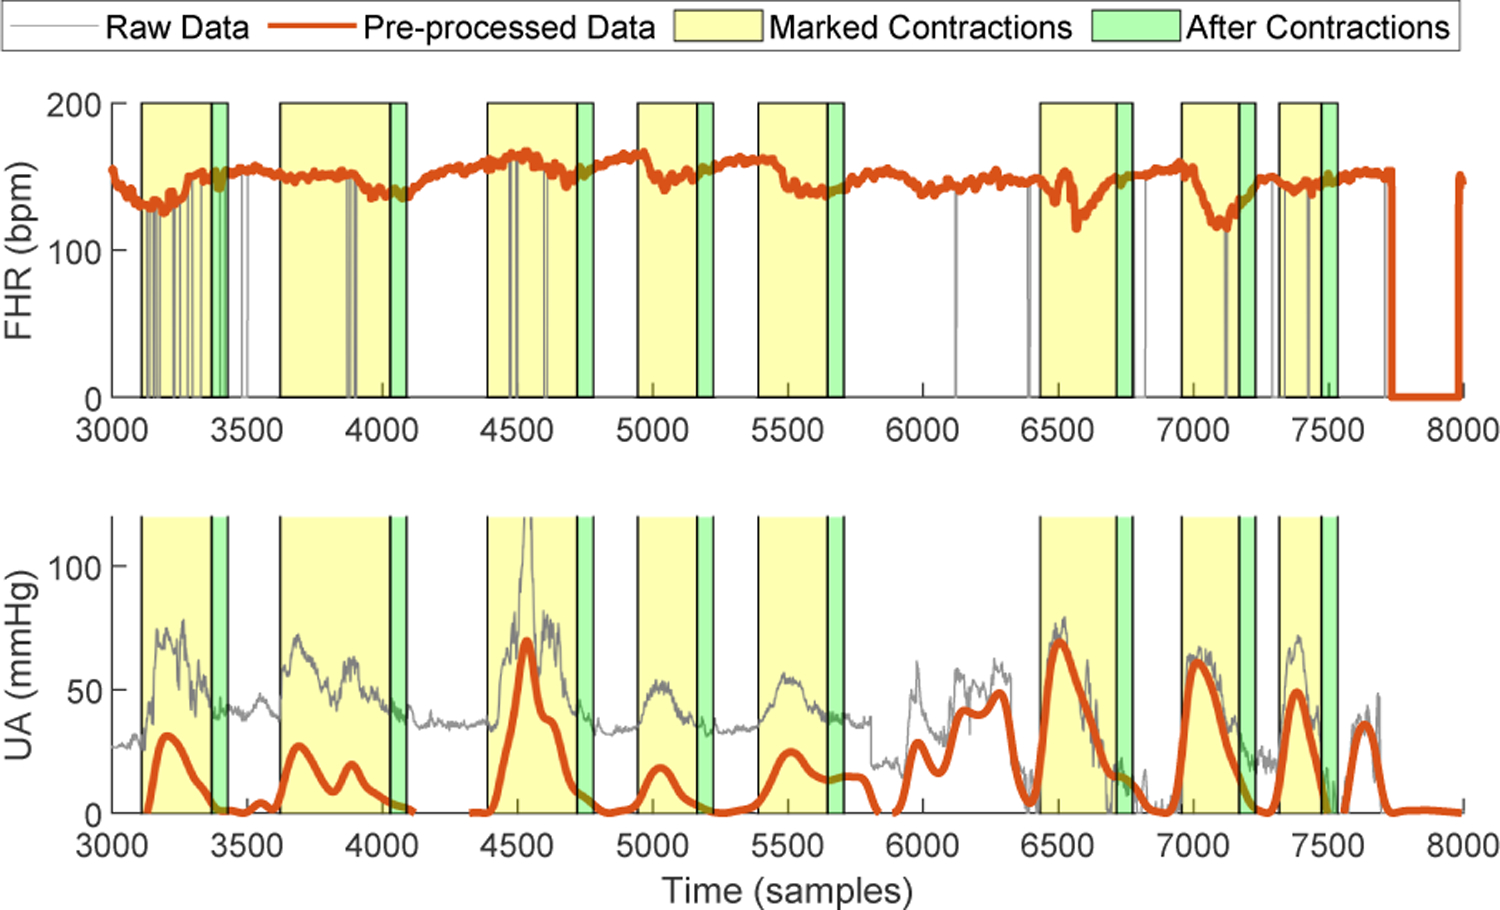
Data pre-processing and segmentation.
3.2. UC Identification and FHR Segmentation
We applied the GP-based UC identification method proposed in [15] for accessing the contraction information, such as onset, offset and peak time. With these data, we can mark the corresponding FHR segments during contractions and after contractions, as shown in Fig. 2. The 15-second window length is used after contractions. Note that, for any contraction event, if the FHR segments still contain more than 50% missing samples after pre-processing, this event is ignored. Besides, if the interval between two consecutive events is smaller than 15s, the first one will be discounted.
3.3. Feature Extraction
Considering the state of a fetus to be latent in its responses to the UC pressure from the mother, three categories of features are extracted from the FHR contraction segments and the FHR post-contraction segments. Table 1 gives a list of 18 features to be used in this study, that are suggested from previous works [7, 9]. In addition, we also compute the differences of these features from the FHR segments during and after contraction, and add them as another group of features. This is because the timing of response also reflects how well the fetus recovers from a big contraction pressure. To this end, for each contraction event, a total of 54 features are calculated.
Table 1:
Features of FHR Segments
| Category | Features |
|---|---|
| Time | Mean, Median, Standard deviation, Minimum, Maximum, Difference of median and minimum, Difference of maximum and median, Short-term variability, Short-term irregularity |
| Frequency | Energies in 0–0.06Hz (VLF), 0.06–0.3Hz (LF), 0.3–1Hz (MF) and 1–2Hz (HF), Ratio of energies: LF/(MF+HF) |
| Nonlinear | Poincare SD1, Poincaŕ e SD2, Approximate entropy, Sample entropy |
3.4. Dimensionality Reduction using GPLVM
Dimensionality Reduction is usually an essential step of analyzing high-dimensional data. A GPLVM is a generalization of probabilistic principal component analysis in which the assumption of linear mapping is replaced by a nonlinear kernel function [18]. Suppose a high-dimensional observation is where each column yd represents the samples in the dth dimension. For our FHR study, each row of Y matches the feature vector extracted from a single contraction event. Let collect latent variables in a low-dimensional space, i.e., Q ≪ D that can be the corresponding coordinates of features from every FHR segments. The GPLVM defines D independent nonlinear mappings from the latent space to the observation space:
| (1) |
where d = 1,2, …, D and each function fd(·) is Gaussian-process distributed. The noises in ed are supposed to be independent as well. Then, the marginal distribution of yd is
| (2) |
where the covariance matrix Σd consists of the uncertainty from the input X and the observation error, or
| (3) |
Here, the matrix Kd ∈ RN×N is obtained by evaluating the kernel function of the dth GP on all pairs of input data points. In general, in order to determine the importance of different dimensions, the automatic relevance determination (ARD) technique is used for defining the covariance functions. For example, the ARD version of the squared exponential kernel is
| (4) |
A straightforward solution of GPLVM training is optimizing the log likelihood over the latent variable X and all the hyperparameters in the kernel functions [18]. In [19], a variational inference framework of GPLVM was proposed where a low bound of marginal likelihood is obtained and maximized by introducing auxiliary variables and variational integration.
3.5. Unsupervised Clustering
We are not going to use any clinical measurements for labeling FHR segments, and therefore a good choice of unsupervised data clustering algorithm is important. For this purpose, we plotted the sample points of contraction-dependent FHR segments in a 2D space (see Fig. 3), which are mapped from the feature space by using a GPLVM. The details about the data set will be explained in Section 4.1. In this example figure, the grey dots represent all contraction events detected from all FHR recordings used in this study. For comparing the sample distributions from normal and abnormal FHR tracings, we selected and emphasized the samples, that are from the recordings with more than 90% expert consensus about their classes, by blue and red colors. From the figure, we can observe that the FHR segments from normal recordings are clustered but the ones from abnormal recordings are scattered. Based on these observations, we propose to build a “Healthy Zone” where most of the FHR contraction segments from normal tracings are located. We note that the states of healthy fetuses are largely confined to this healthy zone. In contrast, the states of non-healthy fetuses may frequently jump out of or stay out of the healthy zone from contraction to contraction.
Fig. 3:
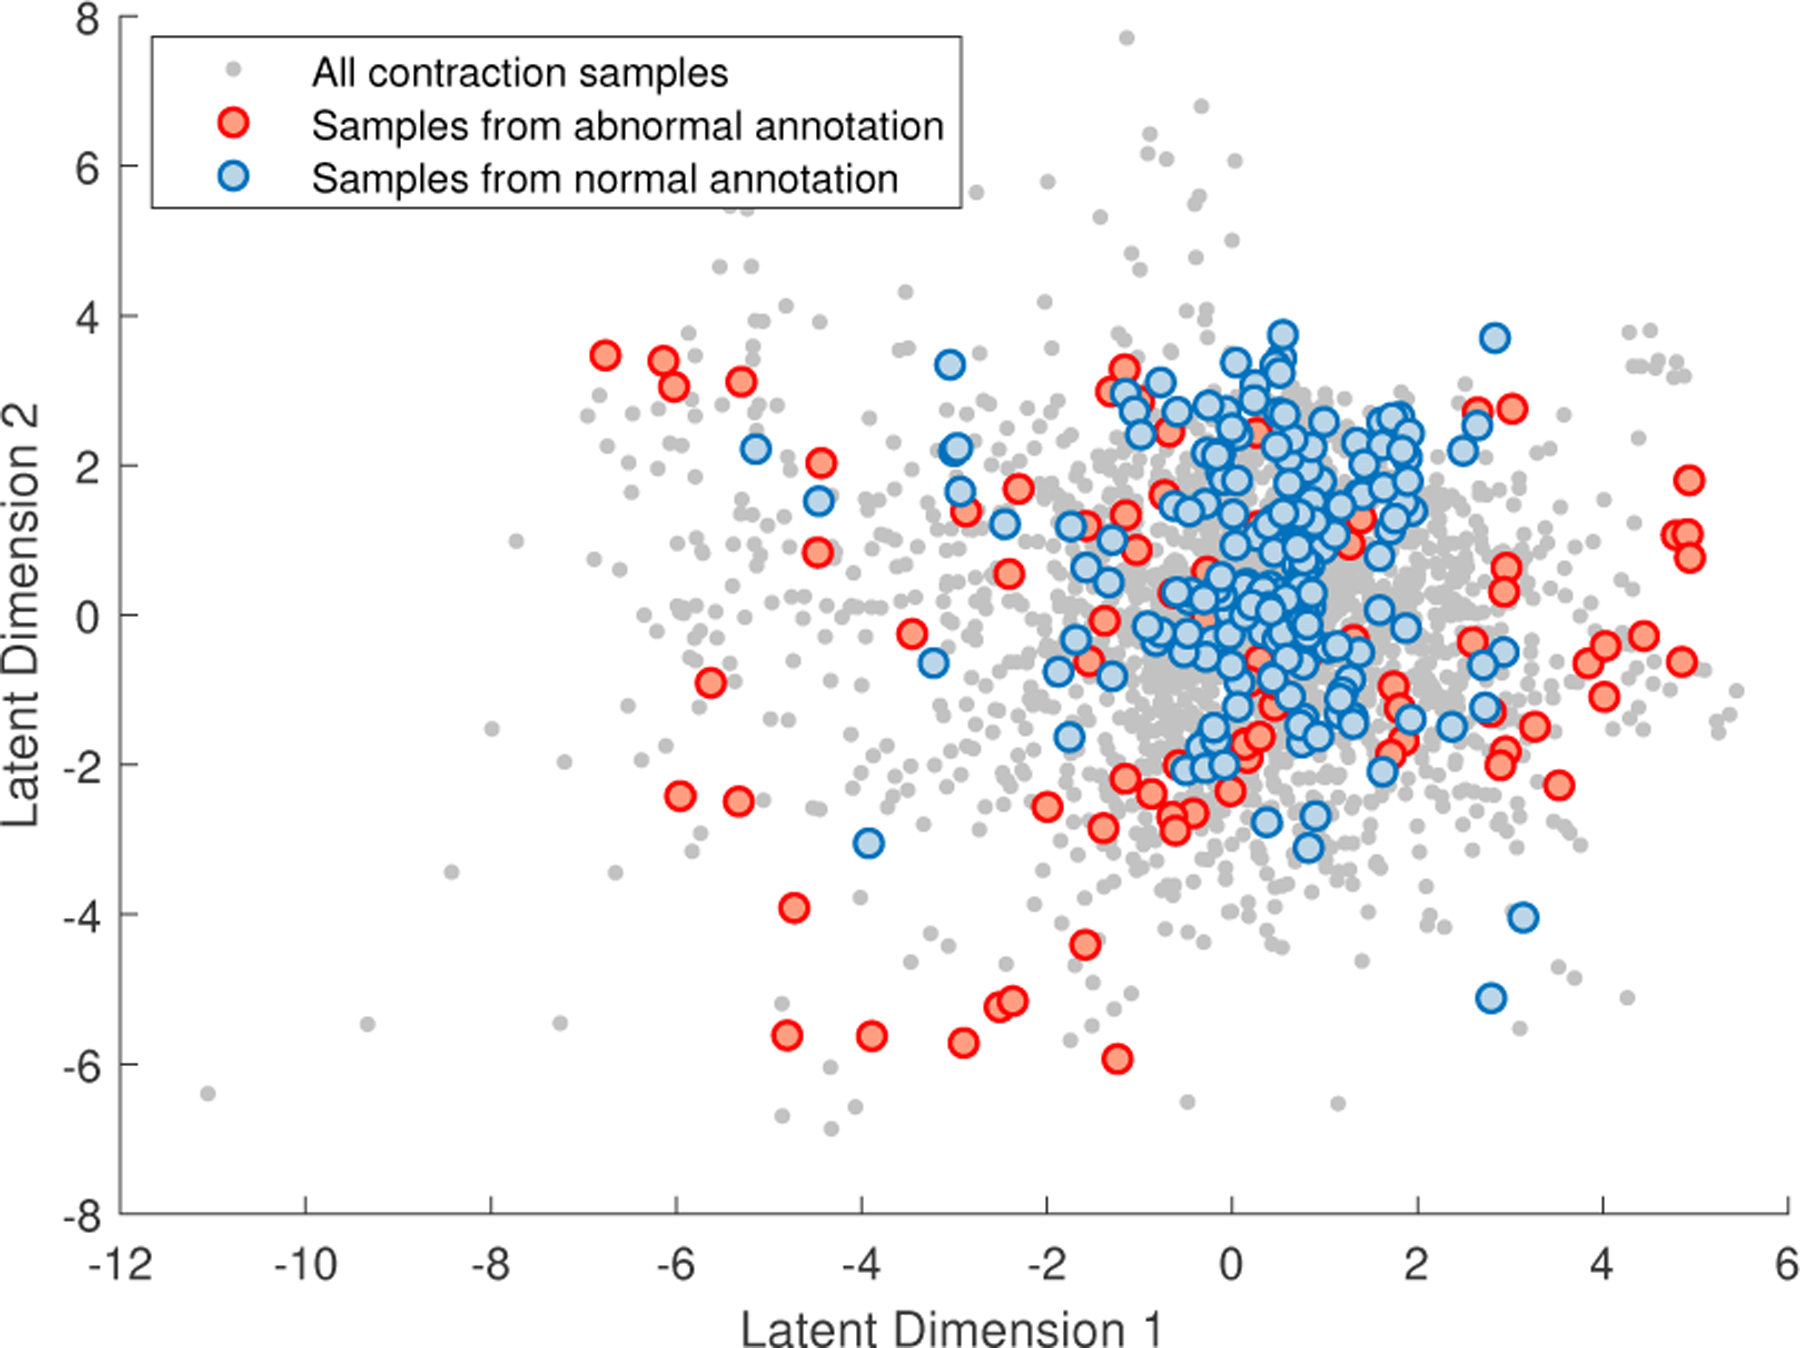
Example of sample distributions of normal and abnormal classes.
Accordingly, we applied a density-based spatial clustering technique, called DBSCAN, since it is able to identify a main cluster with a high density. There are two parameters in DBSCAN that need to be chosen. One is the maximum distance range between neighbors, and the other is a minimum sample size considered for a cluster. Note that, in this work, we treat the main cluster as the healthy zone, and all other clusters and outliers are in the unhealthy zone.
3.6. Trajectory Analysis and Metrics
With the binary labels of sample points after clustering, a boundary of the “healthy” cluster can be created by generating an alpha shape of the finite set of points being assigned to the healthy zone. The function boundary in MATLAB R2021b is used. In the same space, for each FHR recording, we can also draw a trajectory of its contraction-dependent segments by connecting their correlated sample points with lines. In this way, the changes of the fetal status at every contractions can be visually checked if the dimensionality of latent space is smaller than three. Figure 4 shows an example of FHR data trajectory where 8 valid contractions were detected. The box near each black dot indicates the order of the contraction and its peak time. The time 0 minute is assigned to birth, resulting the negative time indices.
Fig. 4:
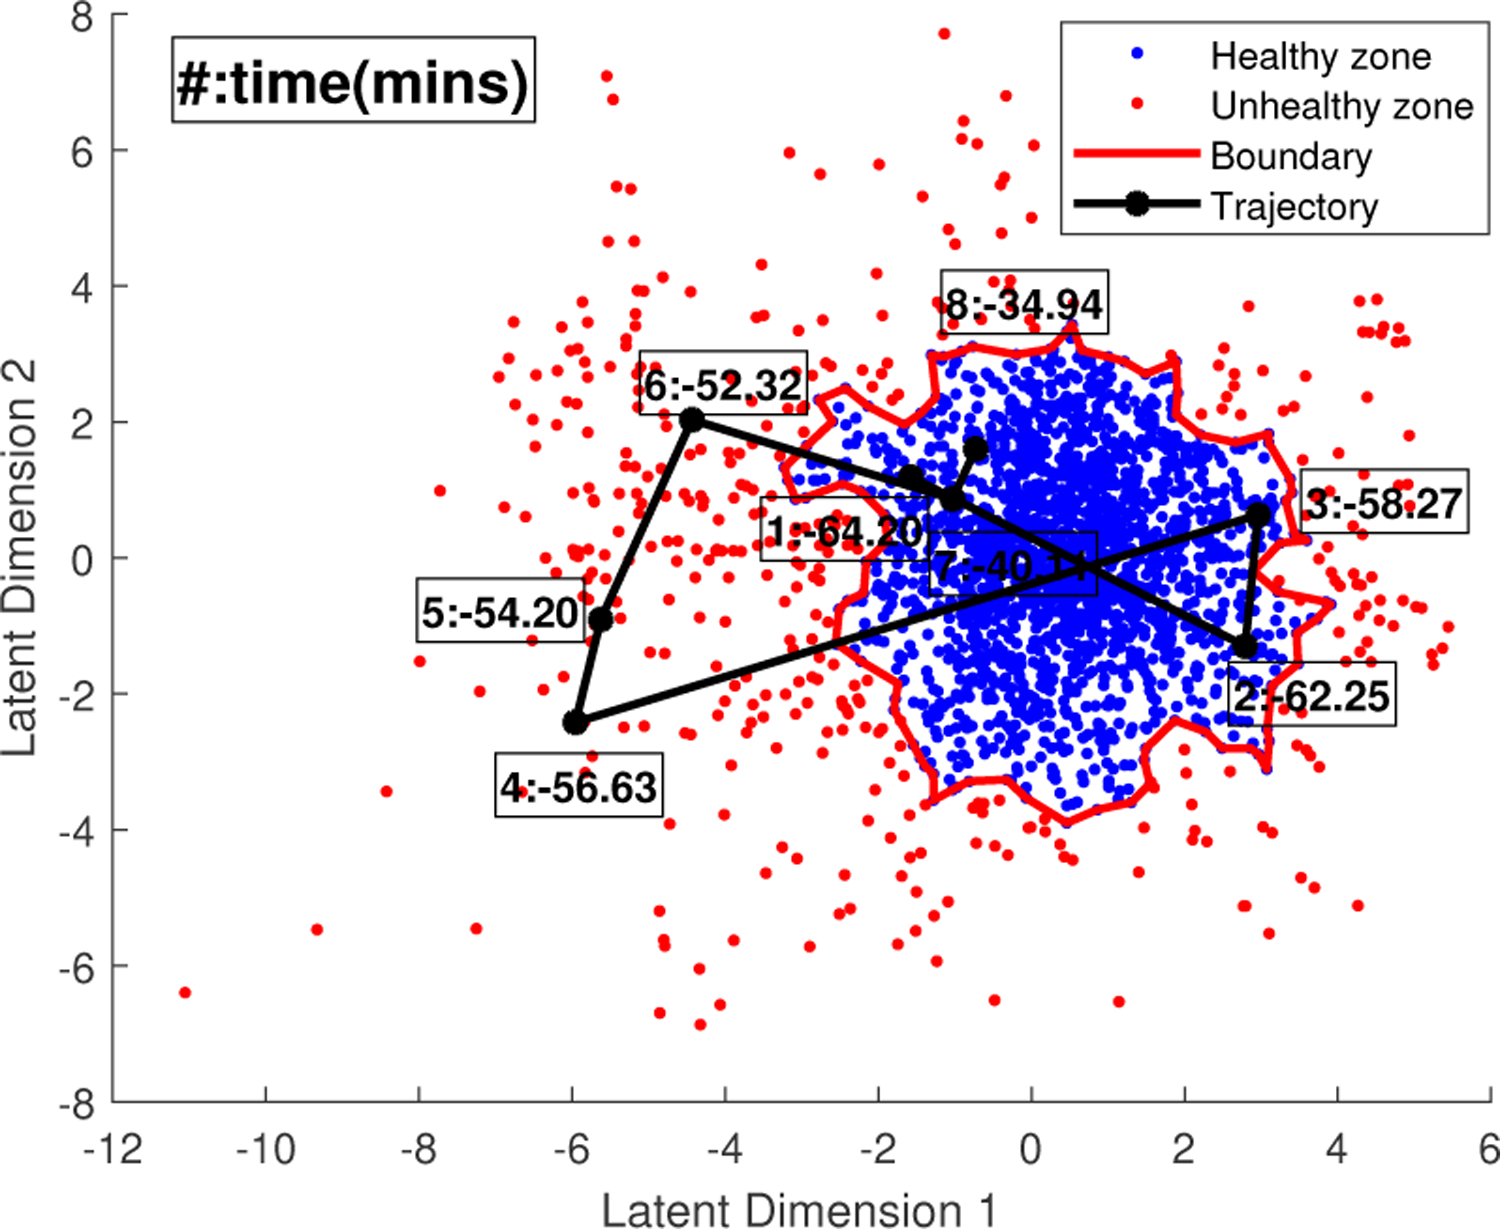
Example of trajectory of a FHR recording.
In order to quantitatively analyze the trajectories, we proposed the following three metrics:
| (5) |
| (6) |
| (7) |
The “Fraction” is the ratio of the number of samples in unhealthy zone and the total number of contractions, representing how often the fetal state travels out of the healthy region. The “Time” is a sum of contraction durations when the samples are in unhealthy zone and the rest periods between them. The “Distance” means the sum of the lengths from points outside the healthy zone to the boundary.
4. EXPERIMENTS
4.1. CTU-UHB Intrapartum CTG Database
An open access intrapartum CTG database [20], collected from April 2010 to August 2012 at the obstetrics ward of the University Hospital in Brno, Czech Republic, is popularly used for FHR study. There are 552 available CTG recordings with the corresponding clinical information. Each CTG signal includes a raw FHR tracing and a raw UA tracing. They are both sampled at 4Hz. An inter- and intra-observer agreement on evaluating this dataset by 9 experienced obstetricians was published in [5]. By analyzing the annotation results, we selected 83 normal recordings and 50 abnormal recordings that all have more than 50% confidence about their classes. Among these recordings, 2237 contractions were detected. In addition, we also marked the recordings with more than 90% or 80% confidence on their classes.
4.2. Results and Discussion
We take a 2D latent space as an example where we plotted the trajectories of all the selected recordings. Figure 5 presents five representative trajectories including (1) always in healthy zone, (2) jumping into unhealthy zone as close to birth, (3) occasional excursion from the healthy zone but close to the border, (4) gradual movement from healthy zone to unhealthy zone and (5) large and irregular jumps out of the healthy zone. Intuitively, the fetus might be well in the situations of (1), (2) and (3), because 1) with strong pressure, even the FHR from a healthy baby may show abnormal patterns as delivery approaches, and 2) occasionally move between healthy and unhealthy regions may imply that the fetus still has the ability to recover by itself. However, for the situation (4) and (5), the FHR contraction samples start to move to or stay in the unhealthy zone frequently, which should be an alarm for fetal distress and requires further examination by OB-GYNs. In Fig. 6, we compare the distributions of three metrics over two classes by using different amount of data. We can see that, although more outliers appear when more data is used, the difference between normal and abnormal classes is still significant.
Fig. 5:
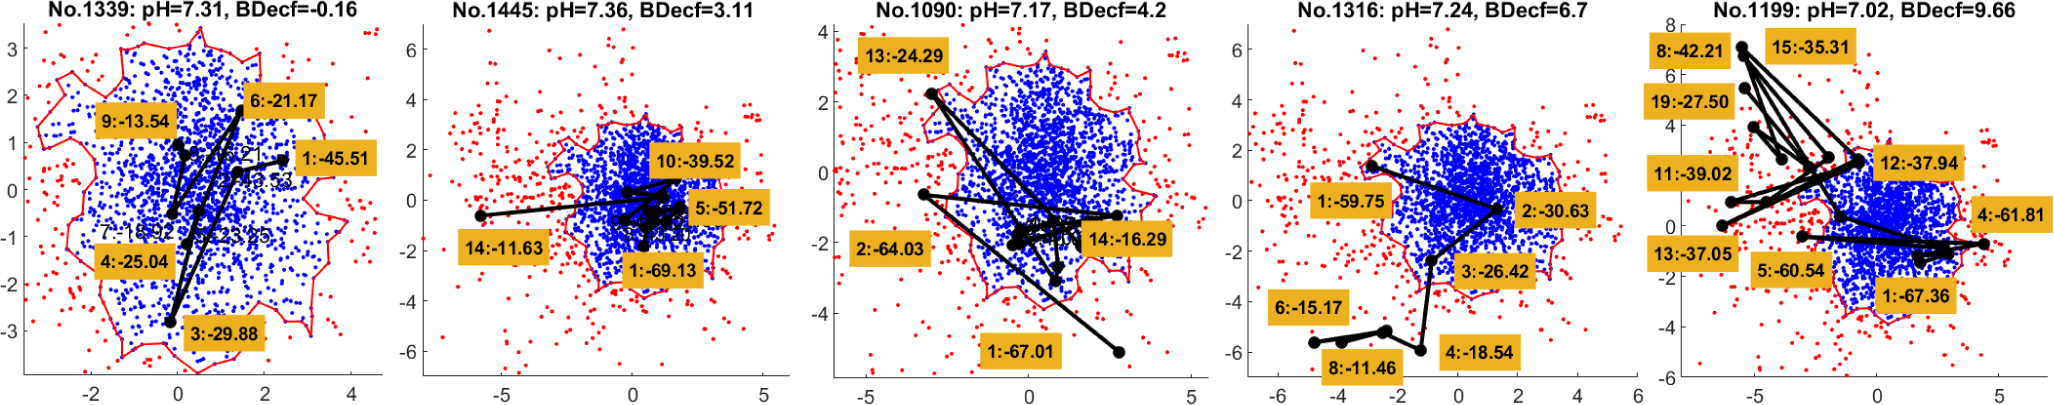
Five representative trajectories of FHR recordings. The left three are in normal class and the right two are in abnormal class.
Fig. 6:
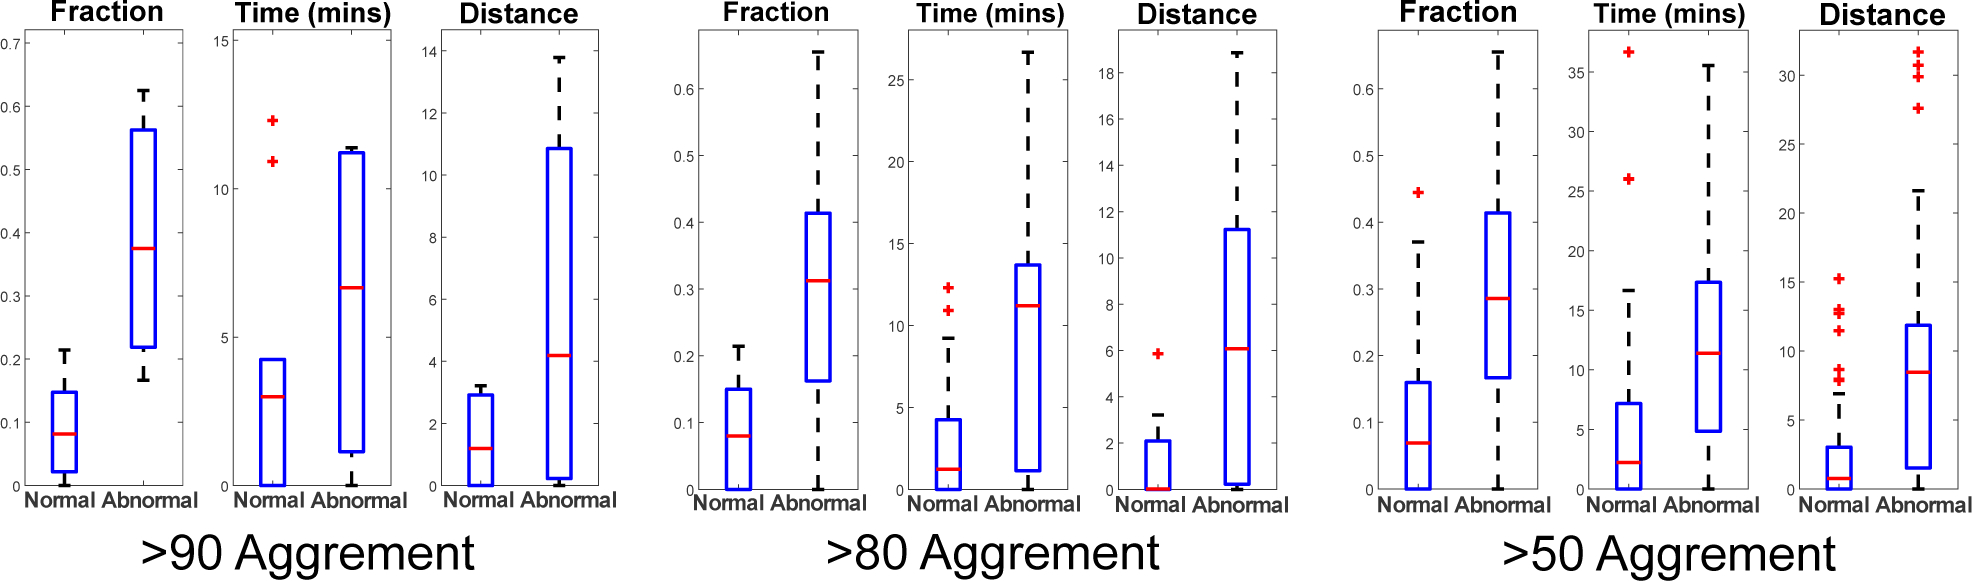
Comparison of three metrics of trajectories from normal and abnormal FHR recordings.
5. CONCLUSION
An unsupervised approach is considered in this study for improving the understanding of FHR recordings with the assistance of uterine activity. The contraction-based FHR segments are transformed into a visual space for tracking the states of fetal responses to every valid uterine contraction. State-of-the-art machine learning techniques are applied on real-world cardiotocography recordings. The newly proposed metrics for evaluation of the trajectory of the recordings shows clear difference between the normal and abnormal classes.
Acknowledgments
This work has been supported by NIH under Award 1RO1HD097188-01.
6. REFERENCES
- [1].Ayres-de Campos D, “Electronic fetal monitoring or cardiotocography, 50 years later: what’s in a name?” American Journal of Obstetrics & Gynecology, vol. 218, no. 6, pp. 545–546, 2018. [DOI] [PubMed] [Google Scholar]
- [2].Sweha A, Hacker TW, and Nuovo J, “Interpretation of the electronic fetal heart rate during labor,” American family physician, vol. 59, no. 9, p. 2487, 1999. [PubMed] [Google Scholar]
- [3].Macones GA, Hankins GD, Spong CY, Hauth J, and Moore T, “The 2008 National Institute of Child Health and Human Development workshop report on electronic fetal monitoring: update on definitions, interpretation, and research guidelines,” Journal of Obstetric, Gynecologic, & Neonatal Nursing, vol. 37, no. 5, pp. 510–515, 2008. [DOI] [PubMed] [Google Scholar]
- [4].Ayres-de Campos D, Spong CY, Chandraharan E, and Panel FIFMEC, “FIGO consensus guidelines on intrapartum fetal monitoring: Cardiotocography,” International Journal of Gynecology & Obstetrics, vol. 131, no. 1, pp. 13–24, 2015. [DOI] [PubMed] [Google Scholar]
- [5].Hruban L, Spilka J, Chudáček V, Janků P, Huptych M, Burša M, Hudec A, Kacerovskỳ M, Kouckỳ M, Procházka M et al. , “Agreement on intrapartum cardiotocogram recordings between expert obstetricians,” Journal of evaluation in clinical practice, vol. 21, no. 4, pp. 694–702, 2015. [DOI] [PubMed] [Google Scholar]
- [6].Stout MJ and Cahill AG, “Electronic fetal monitoring: past, present, and future.” Clinics in perinatology, vol. 38, no. 1, pp. 127–42, 2011. [DOI] [PubMed] [Google Scholar]
- [7].Zhao Z, Zhang Y, and Deng Y, “A comprehensive feature analysis of the fetal heart rate signal for the intelligent assessment of fetal state,” Journal of clinical medicine, vol. 7, no. 8, p. 223, 2018. [DOI] [PMC free article] [PubMed] [Google Scholar]
- [8].Yu K, Quirk JG, and Djurić PM, “Dynamic classification of fetal heart rates by hierarchical Dirichlet process mixture models,” PloS one, vol. 12, no. 9, p. e0185417, 2017. [DOI] [PMC free article] [PubMed] [Google Scholar]
- [9].Feng G, Quirk JG, and Djurić PM, “Supervised and unsupervised learning of fetal heart rate tracings with deep Gaussian processes,” in 2018 14th Symposium on Neural Networks and Applications (NEUREL). IEEE, 2018, pp. 1–6. [Google Scholar]
- [10].Petrozziello A, Redman CW, Papageorghiou AT, Jordanov I, and Georgieva A, “Multimodal convolutional neural networks to detect fetal compromise during labor and delivery,” IEEE Access, vol. 7, pp. 112026–112036, 2019. [Google Scholar]
- [11].Zhao Z, Zhang Y, Comert Z, and Deng Y, “Computer-aided diagnosis system of fetal hypoxia incorporating recurrence plot with convolutional neural network,” Frontiers in physiology, vol. 10, p. 255, 2019. [DOI] [PMC free article] [PubMed] [Google Scholar]
- [12].Feng G, Quirk JG, and Djurić PM, “Discovering causalities from cardiotocography signals using improved convergent cross mapping with Gaussian processes,” in ICASSP 2020–2020 IEEE International Conference on Acoustics, Speech and Signal Processing (ICASSP). IEEE, 2020, pp. 1309–1313. [DOI] [PMC free article] [PubMed] [Google Scholar]
- [13].Warmerdam GJ, Vullings R, Van Laar JO, Bergmans J, Schmitt L, Oei S et al. , “Using uterine activity to improve fetal heart rate variability analysis for detection of asphyxia during labor,” Physiological measurement, vol. 37, no. 3, p. 387, 2016. [DOI] [PubMed] [Google Scholar]
- [14].Warmerdam G, Vullings R, Van Laar J, Bergmans J, Schmitt L, Oei S et al. , “Detection rate of fetal distress using contraction-dependent fetal heart rate variability analysis,” Physiological measurement, vol. 39, no. 2, p. 025008, 2018. [DOI] [PubMed] [Google Scholar]
- [15].Yang L, Heiselman C, Quirk JG, and Djurić PM, “Identification of uterine contractions by an ensemble of Gaussian processes,” in ICASSP 2021–2021 IEEE International Conference on Acoustics, Speech and Signal Processing (ICASSP). IEEE, 2021, pp. 1020–1024. [DOI] [PMC free article] [PubMed] [Google Scholar]
- [16].Przybyła T, Jezewski J, and Roj D, “Unsupervised clustering for fetal state assessment based on selected features of the cardiotocographic signals,” Journal of Medical Informatics & Technologies, vol. 13, pp. 157–162, 2009. [Google Scholar]
- [17].Yang L, Ajirak M, Heiselman C, Quirk JG, and Djurić PM, “Unsupervised detection of anomalies in fetal heart rate tracings using phase space reconstruction,” in 2021 29th European Signal Processing Conference (EUSIPCO). IEEE, 2021. [DOI] [PMC free article] [PubMed] [Google Scholar]
- [18].Lawrence N and Hyvärinen A, “Probabilistic non-linear principal component analysis with Gaussian process latent variable models.” Journal of machine learning research, vol. 6, no. 11, 2005. [Google Scholar]
- [19].Titsias M and Lawrence ND, “Bayesian Gaussian process latent variable model,” in Proceedings of the Thirteenth International Conference on Artificial Intelligence and Statistics. JMLR Workshop and Conference Proceedings, 2010, pp. 844–851. [Google Scholar]
- [20].Chudáček V, Spilka J, Burša M, Janků P, Hruban L, Huptych M, and Lhotská L, “Open access intrapartum CTG database,”´ BMC pregnancy and childbirth, vol. 14, no. 1, pp. 1–12, 2014. [DOI] [PMC free article] [PubMed] [Google Scholar]