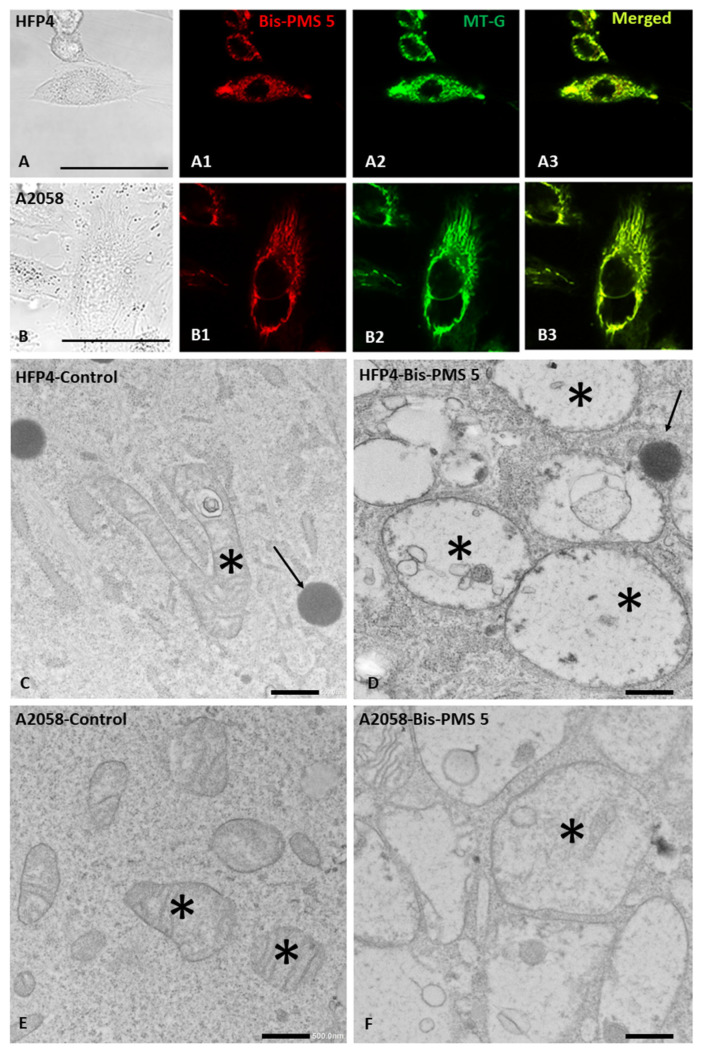
Figure 6.
Influence of Bis-PMS 5 on normal HFP4 fibroblast (A,C,D) and A2058 melanoma cells (B,E,F). Subcellular localization of Bis-PMS 5 can be seen in the red channel (λex = 630 nm, λem = 650–670 nm, (A1,B1)) and corresponds to the position of mitochondria stained with Mito-Tracker (green channel: λex = 490 nm, λem = 510–516 nm; (A2,B2)). Colocalization is shown in (A3,B3) with a merged red and green signal. Electron microscopy (C–F) demonstrates the ultrastructure of normal fibroblasts (C), melanoma cells (E) and cells treated with Bis-PMS 5 (D,F). Exposure of both cell types to 5 µM of Bis-PMS 5 for 2 h induced swelling of mitochondria with cristolysis (D,F). Asterisks mark mitochondria and arrows mark lipid droplets. Bar is 100 μm (A,B) and 500 nm (C–F).

