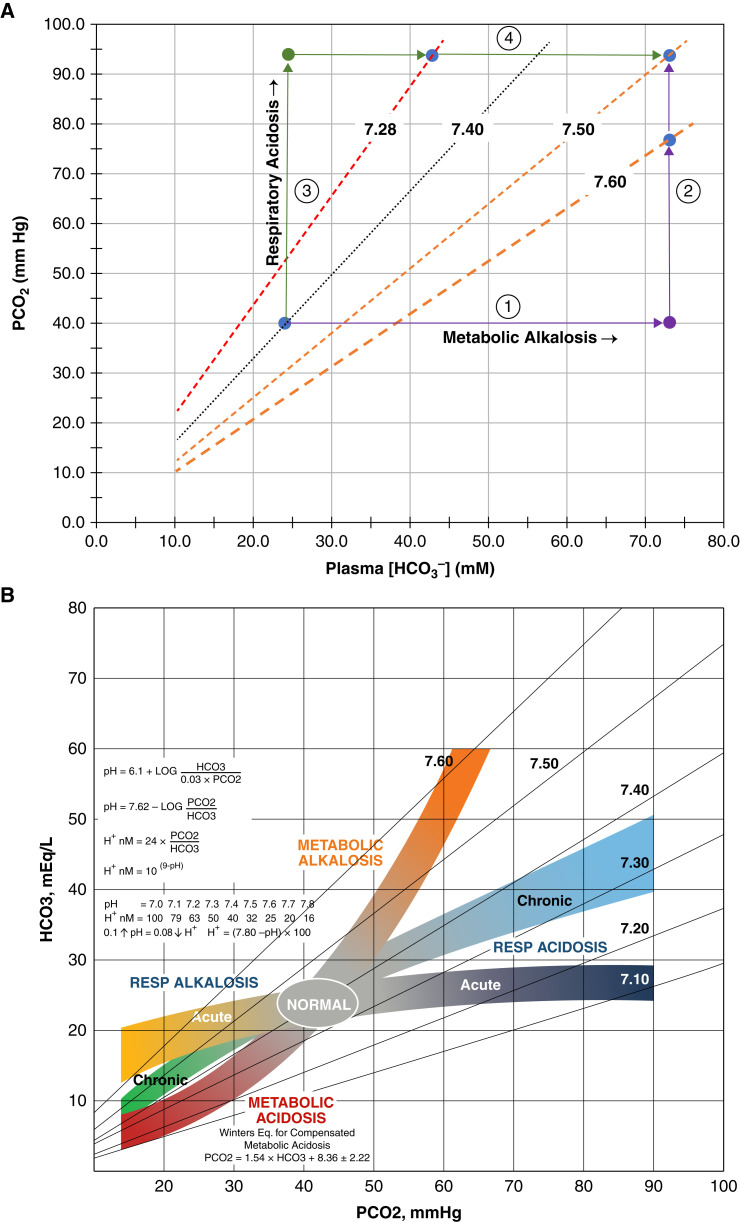
Figure 5.
Quantitative analysis and clinical illustration of acid-base disorders. (A) Quantitative analysis of acid-base disorder provided from index case. The arterial blood gas of the index patient: pH 7.5, PCO2 93.7 mm Hg, and [HCO3–] 73.1 mM. The blue filled circle corresponds to the normal PCO2 of 40 mm Hg and plasma [HCO3–] of 24 mM at pH 7.4. The dotted lines are pH isopleths that bound pH values from 7.28 to 7.6. Conceptualization of a parallel-process, mixed acid-base disturbance developing as two distinct processes along two separate and convergent pathways: (A) metabolic alkalosis with respiratory compensation (arrow 1) followed by superimposed chronic respiratory acidosis (arrow 2) and (B) chronic respiratory acidosis with appropriate bicarbonate retention (arrow 3) followed by metabolic alkalosis (arrow 4). (B) Clinical illustration of mixed acid-base disorder provided from index case. Colored bands represent the known boundaries and compensatory responses of the six acid-base disturbances. The pathogenesis of the arterial blood gas of the index patient: pH 7.5, PCO2 93.7 mm Hg, and [HCO3–] 73.1 mM can occur by two separate and distinct pathways, both ending at a point of metabolic alkalosis and chronic respiratory acidosis. Chronic respiratory acidosis from the normal state (oval labeled “NORMAL”) increases PCO2 to 93.7 mm Hg () and followed by a metabolic alkalosis () with final [HCO3–] of 73.1 mM. Alternatively, metabolic alkalosis () precedes the chronic respiratory acidosis. [HCO3–] increases initially to 73.1 mM and followed by hypercapnia with final PCO2 of 93.7 mm Hg (). (Kidney Kard v4, © 2016. Courtesy, Jerry Yee and Mark L. Graeber).

