Abstract
Metal halide perovskite nanocrystals (PNCs), with excellent electronic and optical properties, are promising for a variety of optoelectronic and photonic applications. However, the instability issue still impedes their practical applications. Here a ligand-assisted swelling–deswelling microencapsulation (LASDM) strategy is proposed and evaluated for improving the stability and photoluminescence (PL) performance of PNCs. With ligand assistance, well dispersed and intimately passivated PNCs in polymer matrices are obtained. Compared with the previously reported swelling–deswelling microencapsulation (SDM) strategy, the proposed method can provide better nanocrystal size control and surface coordination. Thus, full-color perovskite–polymer composites (PPCs) with unprecedented environmental stability can be achieved and concentration quenching can be avoided in polymer matrices. The excellent color purity, color tunability, optical density variability and environmental stability make PPCs highly promising for a range of PL applications, such as tailored lighting and transparent projection displays. Moreover, the simple, low cost, scalable process and the compatibility of this method with a group of polymer matrices should pave the way for PPCs to meet the requirements for practical use.
A ligand-assisted swelling–deswelling microencapsulation strategy is proposed to enable full-color perovskite–polymer composites with unprecedented environmental stability and optical density tunability.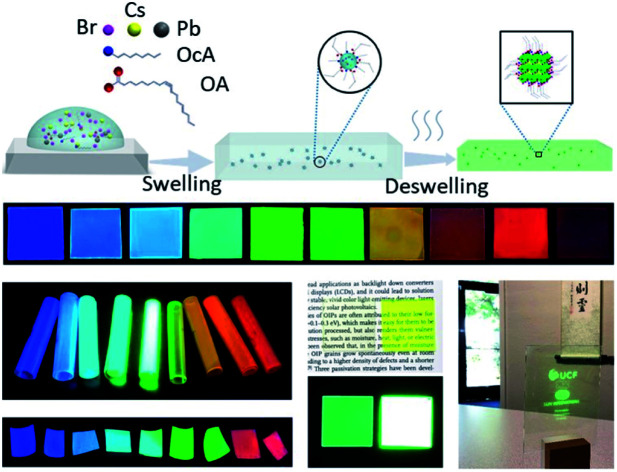
Introduction
Metal halide perovskites in a nanocrystal form with a chemical formula of ABX3 (A = methylammonium (MA), formamidinium (FA) or Cs, B = Pb or Sn, and X = Cl, Br, or I) have been extensively explored with great potential in photovoltaic, light emitting and photodetecting applications due to their excellent electronic and optical properties.1–3 Moreover, these perovskite nanocrystals (PNCs) demonstrated low cost, easy fabrication, high photoluminescence (PL) efficiency, and excellent color purity and tunability, making them highly promising for replacing traditional phosphors or quantum dots in wide color gamut displays or tailored lighting applications.4,5 However, the main obstacle towards the vast application of PNCs is their instability upon exposure to environmental factors such as moisture, heat, oxygen, light, etc., especially for red-emitting perovskites.6,7
During the past few years, many ex situ and in situ encapsulation strategies have been developed to protect PNCs against external stresses and improve stability.8 Compared to these ex situ methods, in situ strategies normally result in PNCs with better scalability and lower cost, favorable for practical applications.9 Previously, effort had been devoted to in situ hard template assisted synthesis, where mesoporous templates are used to physically confine the growth of perovskites inside the pores.10–12 However, in this strategy the pre-fabricated solid mesoporous matrix structure will leave the PNCs partially exposed and unprotected, and thus further encapsulation is needed for long-term practical use. The second method is to mix PNC precursors with dissolved organic matrices and grow PNCs in situ inside such matrices.13–15 Nevertheless, this method can only work for limited choices of polymers and perovskite/polymer phase separation is hard to avoid, thus leading to restricted stability improvement. Meanwhile, many propose to mix PNC precursors with melted/dissolved inorganic matrices and grow PNCs in situ inside the matrices.16–18 The inorganic matrices have the potential to deliver better protection than their organic counterpart, but perovskite/matrix phase separation is still an issue and the use of rigid substrates may result in poor flexibility and scalability. Another method is in situ crystallization of PNCs directly inside solid organic matrices.19,20 In 2016, our group reported an in situ swelling–deswelling microencapsulation (SDM) strategy to achieve well dispersed, intimately passivated MAPbBr3 PNCs inside polymer matrices that can survive boiling water treatment for 30 min, or two months of immersion in water with less than 7% efficiency loss.21 However, this strategy can only produce pure bromide-based perovskites with good performance, while PPCs with other halide compositions barely emit and are still vulnerable to external stimuli. Achieving full-color PPCs with a pure color emission and high stability is crucial for tailored lighting, low-cost wide-color-gamut displays, and other downconverting applications. In this regard, the previous SDM strategy is not optimal. Moreover, in general PNC synthesis, a small particle size is normally favored in order to get a strong excitonic feature for high quantum efficiency.22,23 In the early SDM developments, size control of PNCs is challenging, and when a higher concentration precursor solution is used, the as-obtained MAPbBr3 PPC film would yield lower PL efficiency due to bad dispersion of perovskites in the polymer and the larger particle size; this is known as concentration quenching. Avoiding concentration quenching can lead to highly luminescent PPCs with different optical densities (ODs), and such OD tunability is pivotal for PPCs to be adapted into a variety of applications, such as tailored lighting which requires a high OD and transparent projection displays where a low OD is preferred. Size reduction from the micron scale to sub-micron scale has been observed in CsPbBr3 nanorod–polymer composites by changing processing dynamics (for example, by increasing the spincoating speed),24 but the nanocrystal size is still not small enough to introduce effective excitonic confinement and efficiency improvement can be hardly noticed. Therefore, a general, simple, low cost in situ fabrication strategy for full-color PNCs that can provide excellent dispersion as well as complete intimate passivation yielding excellent stability against environmental stimulus is still missing.
In this paper, we report a ligand assisted SDM (LASDM) method to synthesize PNCs in situ in polymer matrices with high stability, wide color tunability and good color purity, and demonstrate it as a facile strategy to be applied to diverse perovskite precursor compounds, various polymer substrates and different processes. Long chain alkylamines, such as octylamine (OcA) or oleylamine (OlA), and carboxylic acids,such as oleic acid, (OA) have been widely used as capping ligands in solution synthesis of PNCs, to help engineer the dynamics of crystallization, control the PNC size, coordinate surface sites and improve colloidal stability.25–27 Here, ligands are applied in SDM to help with micelle formation during the swelling process, confine small PNC crystallization, and subsequently act as coordinators and stabilizers after crystallization. As a result, PL efficiency is improved, and high PL quantum efficiency (PLQY) of larger than 70% can be achieved for PPCs with a wide range of optical densities (0.05–0.77) without concentration quenching. PPCs of various emitting colors ranging from blue to near infrared can be readily obtained by tuning the halide compositions in the precursor solution, and they show excellent stability that can even survive boiling water treatment.
Results and discussion
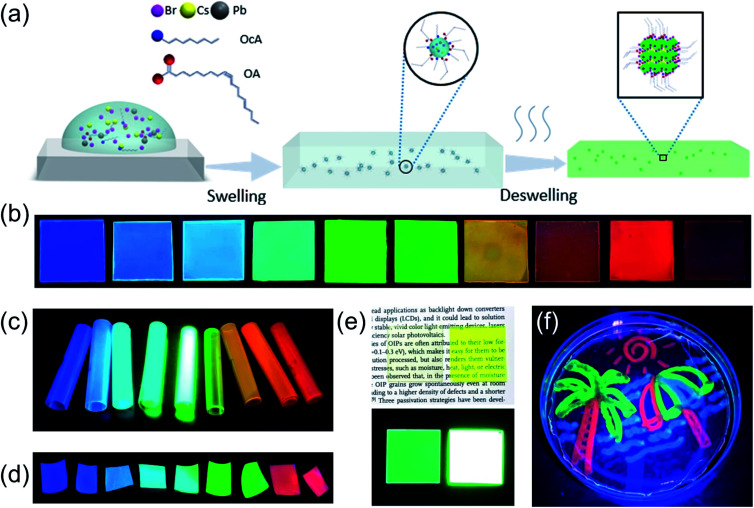
The scheme of the LASDM strategy is illustrated in Fig. 1a. As the precursor solution is introduced to polymer substrates (see the ESI† for Experimental details), for example, by spincoating, the solvent-induced polymer swelling effect will bring perovskite precursors and ligands in between swollen polymer chains. The ligand molecules tend to surround the perovskite precursors with the hydrophilic functional group facing inwards and the hydrophobic molecular end facing outwards to the polymer chains, thus forming micelles inside the swollen polymer matrix. The formation of such micelles facilitates excellent dispersion of perovskite precursors in small droplets, even at higher concentrations. When the solvent evaporates, the perovskite precursors inside the micelles will crystallize, forming ligand-capped PNCs which are well dispersed inside the deswelled polymer matrix.
Fig. 1. Ligand assisted swelling–deswelling microencapsulation (LASDM) strategy to fabricate stable, color tunable perovskite–polymer composites. (a) Schematic illustration of the LASDM strategy. (b–d) Photographs of spin-coated luminescent perovskite–polymer composite samples ((b) CsPbX3–PS, (c) CsPbX3–CA or (d) CsPbX3–ABS) emitting different colors from deep blue to near infrared under UV excitation (380 nm). (e) Photograph of MAPbBr3–PS films with high transparency (left) and a high optical density (right), under ambient light (up) and UV excitation (down). (f) Image of a CsPbX3–PS sample prepared by cotton swab painting, immersed in water under UV excitation (380 nm).
This strategy can be generally applied to a series of commonly used polymer substrates, such as polystyrene (PS), cellulose acetate (CA) and acrylonitrile butadiene styrene (ABS). Different polymer substrates might be preferred in specific application scenarios, due to varying mechanical and optical properties. Polystyrene is a widely used transparent, cheap thermoplastic packaging material that has a low glass transition temperature (Tg) and can be easily molded; cellulose acetate has high moisture and oxygen permeability, and therefore is sensitive to the environment and could be used for sensing applications; acrylonitrile-butadiene-styrene (ABS) is a highly scattering engineering thermoplastic terpolymer with good mechanical properties, especially high impact resistance, as well as ease of machining for different forms, such as 3D printing. By varying halide compositions in the precursor solution, emissions of different colors can be easily achieved. Fig. 1b, c and d show CsPbX3–PS, CsPbX3–CA, and CsPbX3–ABS PPCs with different emitting colors under UV excitation, respectively (the exact compositions can be found in the ESI figures†). Besides the suitability of this strategy for various polymer substrates, LASDM can also be applied to other perovskite compositions, such as MAPbX3, and can render different ODs without concentration quenching, as shown in Fig. 1e. When using a high concentration perovskite precursor solution without a ligand, for example, 0.075 mmol mL−1 MAPbBr3 solution, the PL efficiency drops a lot due to concentration quenching.21 With the assistance of a ligand pair, a high OD MAPbBr3 PPC film prepared with a 0.15 mmol mL−1 MAPbBr3 solution is obtained with a high PL efficiency. Fig. 1e demonstrates side by side a highly transparent film and a high OD film, under ambient light (up) or UV excitation (down). These two films have an OD of 0.05 and 0.775 at 450 nm, which means a transmittance of 88% and 17%, respectively. Surprisingly, both have PLQY higher than 70%. Thanks to the good PNC dispersion, ligand coordination and stabilization, and intimate polymer microencapsulation, the PPCs demonstrate excellent environmental stability. Fig. 1f shows a multi-color perovskite picture immersed in water under UV excitation, which is prepared by applying the LASDM strategy with cotton swab painting on a PS substrate.
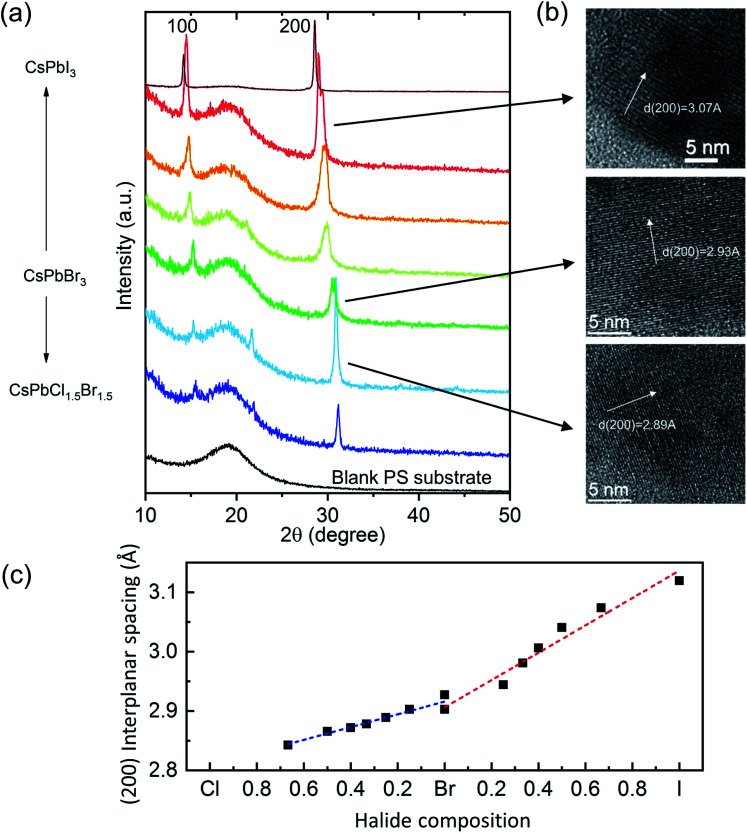
The structure of the LASDM-derived PPCs has been characterized by X-ray diffraction (XRD) and high-resolution transmission electron microscopy (HRTEM). Fig. 2a shows the XRD patterns of a series of CsPbX3–PS PPCs, with assistance of oleic acid (OA) and octylamine (OcA) ligands in a molar ratio 1 : 1. All the PPCs contain a broad diffraction band which comes from the PS substrate and two distinct diffraction peaks that can be assigned to (100) and (200) CsPbX3 crystalline peaks of the cubic structure. For some curves, the (110) peak is also distinguishable. Noticeably, the characteristic peaks shift to smaller angles when halide compositions vary from chloride-rich, via bromide-rich, to iodine-rich PNCs, indicating that the lattice constants become larger. This is because the ion radii of the halides are in the order of: I > Br > Cl. Fig. 2b shows HRTEM images of CsPbCl1.5Br1.5–PS, CsPbBr3–PS, and CsPbBrI2–PS samples, where (200) plane interplanar spacings of 2.89 Å, 2.93 Å and 3.07 Å can be observed, respectively, which matches exactly with that derived from the XRD (200) peak angle. Fig. 2c shows the correlation between the (200) interplanar spacing of all PPCs and their respective halide composition ratios. A nearly linear trend can be clearly observed in both Br–Cl and Br–I ranges.
Fig. 2. (a) XRD patterns of CsPbX3–PS composites and the blank PS substrate. (b) HRTEM images of CsPbBrI2–PS (top), CsPbBr3–PS (middle), CsPbCl1.5Br1.5–PS (bottom) samples. (c) Interplanar spacings of (200) faces derived from XRD patterns of samples with different halide compositions.
Long chain carboxylic acid and alkylamines are common choices of ligands employed in most solution syntheses of perovskite quantum dots, with organic acids always claimed to help with solvating precursors and providing colloidal stability while alkylamines are responsible for dimensional and size control.25–28 With no need for colloidal stabilization in the in situ SDM process, it is questionable whether OAs play a critical role in LASDM. To investigate this, PPCs are synthesized without OAs (with alkylamines only). XRD characterization was carried out on the one-ligand (OcA) PPCs. As shown in Fig. S1,† similar diffraction patterns can be observed, including clear (100) and (200), peaks, identifying the cubic crystal structure. The major difference is that the peaks are relatively narrower than those of PPCs prepared with both OA and OcA ligands, as shown in Fig. 2a. In fact, the full-width-of-half-maximum (FWHM) of the prominent XRD (200) peaks can be used for deriving the average crystal size using the Scherrer equation.29,30 The calculated average crystal sizes for PPCs prepared with a ligand pair or one ligand are summarized in Fig. S2.† For almost all the perovskite halide compositions, PNCs with a smaller size are obtained when a ligand pair is used. Size control has always been critical in PNC synthesis and a small particle size proved to be beneficial for PL efficiency. Results from the XRD characterization indicate that applying the oleic acid and alkylamine ligand pair can provide more effective micelle size control than using only the amine ligand. This could be attributed to the incorporation of oleic acid which can protonate the amine and help it more actively bind to bromide. In addition, the ion pair formed by oleate and alkylammonium would also bind to the charge neutral perovskite precursor.31–33
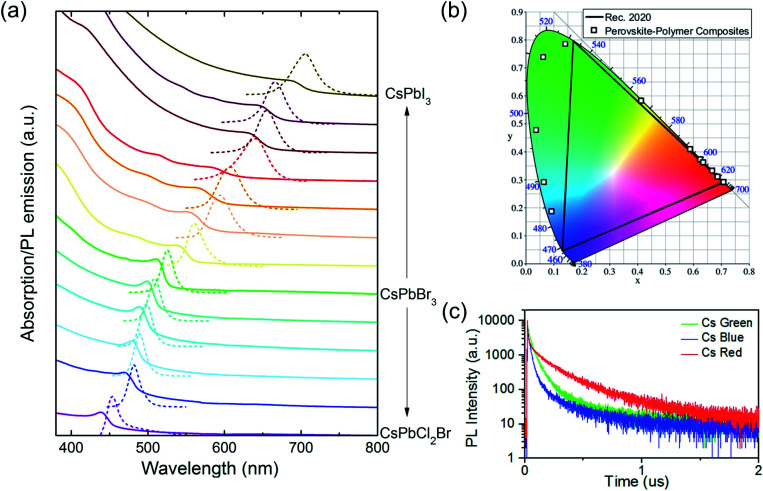
Fig. 3 shows the static and transient PL behavior and absorption spectra of the PPCs. As mentioned earlier, the bandgap and the emitting color of the PPCs can be tuned continuously when the halide composition is modified. Fig. 3a shows the absorption and PL emission spectra of CsPbX3–PS PPCs from the blue to near infrared spectral range, where X is tuned from a chloride and bromide mixture to pure iodine. The peak wavelengths and FWHMs for different halide mixtures are listed in Table S1.† The PL emission peak energy has a good linear fit with the halide composition (Fig. S3†), indicating that different halide components in the perovskite precursor are mixed uniformly in the synthesized nanocrystals. Benefitting from the linear relationship, precursors can be easily designed for any target emission wavelength. On the other hand, the color coordinates of the PPCs in the CIE 1931 color space are plotted in Fig. 3b. Compared to the color standard (Rec. 2020) for ultra-high-definition televisions, it is obvious that the emission colors are pretty saturated, demonstrating great potential in reproducing any natural color through color mixing. The continuously tunable, pure-color emitters are especially useful for downconverting applications such as tailored lighting, liquid crystal display, etc., to achieve better color performance.
Fig. 3. Optical properties of CsPbX3–PS composite films. (a) UV-vis absorption (solid lines) and PL emission (dashed lines) spectra. (b) Color coordinates of CsPbX3–PS PL emission properties shown in the CIE 1931 color space. The Rec. 2020 (black line) color standard is shown for comparison. (c) PL decay curves of blue, green and red CsPbX3–PS composite films under 375 nm excitation.
As mentioned earlier, LASDM can be applied to a series of polymers. Fig. S4 and S5† show the series of PL spectra of CsPbX3–CA and CsPbX3–ABS PPCs and their corresponding PL peak energy correlation with halide mixture compositions, respectively. Similar to those of CsPbX3–PS, the spectra have a nearly linear dependence on the halide composition. In fact, the peak wavelength of PPCs prepared with identical precursors but different substrates are quite similar, while the bandwidth might vary a little. This might be due to the different swelling properties of the substrates. The Hildebrand solubility parameter (δ) is a parameter commonly used to evaluate the polymer–solvent interaction. Table S2† lists the typical δ for the three polymers used in this work, and the solvent N,N-dimethylformamide (DMF) has a δ of 24.62.34,35 The closer the values of the polymer and the solvent are, the more likely they seem to be soluble, which in our case, means easier swelling of the polymer substrate. The swelling level would also influence the deswelling rate, the crystallization process and finally the final emission spectra.
Other than inorganic CsPbX3 perovskite materials, organic–inorganic hybrid perovskites, such as MAPbX3, are also compatible with LASDM. The PL spectra and peak energy of MAPbX3–PS PPCs are shown in Fig. S6.† Noticeably, the PL peak of pure iodine PPC shifts to a longer wavelength (764 nm) due to the intrinsic material bandgap property.
PL decay lifetimes are also recorded and shown in Fig. 3c, with average lifetimes of 40 ns, 149 ns and 215 ns for blue, green, and red samples, respectively. These values are much larger than the reported ones which are typically less than 30 ns, for PNCs in solution or with further encapsulation,36,37 indicating high crystallization quality with less non-recombination states.
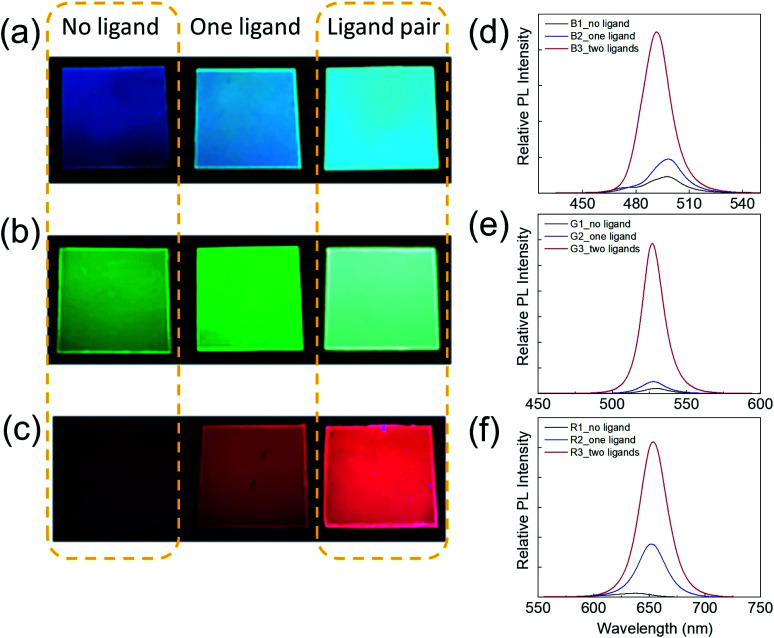
To quantify the improvement of the PL performance due to the assistance of ligands, red, green, and blue (RGB) PPCs are synthesized by SDM without a ligand, with an amine ligand only or with a ligand pair. The brightness enhancement can be clearly seen in photos taken under the same excitation condition with identical camera exposure (Fig. 4a–c). For a quantitative comparison, the samples' relative PL is measured using a fixed setup under laser (405 nm) excitation (Fig. 4d–f). By applying one amine ligand, blue and green samples can become around two times brighter, while the red sample has a 14-fold PL enhancement. Furthermore, when the long chain amine and oleic acid ligand pair is incorporated, the PL enhancement is magnificent, with ten fold for blue, 30 fold for green and 40 fold for red PPCs.
Fig. 4. (a–c) Photographs of the luminescent (a) blue (CsPbClBr2–PS), (b) green (CsPbBr3–PS) and (c) red (CsPbBrI2–PS) composites prepared with no ligand (left), one ligand (middle) or two ligands (right), under UV excitation. All photos are taken with identical camera exposure settings. (d–f) Comparison of PL emission spectra and relative PL intensities of (d) blue (CsPbClBr2–PS), (e) green (CsPbBr3–PS) and (f) red (CsPbBrI2–PS) composites prepared with no ligand (black line), one ligand (blue line) or two ligands (red line).
The obvious improvement can be attributed to two main reasons. First, PNC size reduction due to micelle formation with ligand assistance could lead to stronger quantum confinement of the excitons and improved radiative recombination.9 The micelle confinement effect and size reduction are also observed in the UV-Vis spectra. In typical UV-Vis measurements, the scattering of the measured sample can be ignored; and the as-obtained curves represent absorption spectra. But when the particle sizes are at a similar level to the incident light wavelength, the effect of Mie scattering will clearly show up as a long tail in measured UV-Vis spectra. The smaller the particles are, the weaker the scattering will be, and then a weaker tail effect will be involved in UV-Vis spectra. Ambient photographs and UV-Vis spectra of RGB PPCs prepared without a ligand, with an amine ligand only and with a ligand pair are shown in Fig. S7 and S8.† The samples with the ligand pair are the clearest, because of largely reduced scattering, as further confirmed by the UV-Vis spectra. It can also be observed that the ligand pair is much more effective than only the amine ligand, in micelle confinement and size control. Second, the ligands can passivate uncoordinated surface sites of the nanocrystals, thus mitigating non-radiative recombination. This can be supported by decay lifetime characterization (Fig. S9†), in which the CsPbBr3–PS composites prepared with a ligand pair possess the longest average decay lifetime of 55 ns. The PL decay curves are fitted with the bi-exponential decay function with the corresponding lifetimes and proportions summarized in Table S3.† The fast PL lifetime almost remains constant under different ligand conditions, which could be attributed to bulk recombination lifetime. The slow PL lifetime varies when a ligand(s) is (are) used, which could be induced by PNC variation or surface condition changes. The lifetimes of perovskites have been reported before and are dependent on many factors such as excitation power, crystallite size, film configuration and morphology.38–41 A longer lifetime is commonly taken as a sign of better material purity and good passivation of perovskite surfaces. Typically, a smaller particle size is associated with a shorter PL lifetime, due to increased surface areas and likely a larger number of surface defects.41 On the contrary, for perovskite PPCs, a longer slow PL lifetime is observed for smaller nanocrystals synthesized with assistance of ligand(s). This indicates reduced density of surface traps and thus nonradiative recombination channels. Particularly, when a ligand pair is used, the slow PL lifetime can be as long as 138 ns, as a result of improved surface coordination and passivation from ligands.
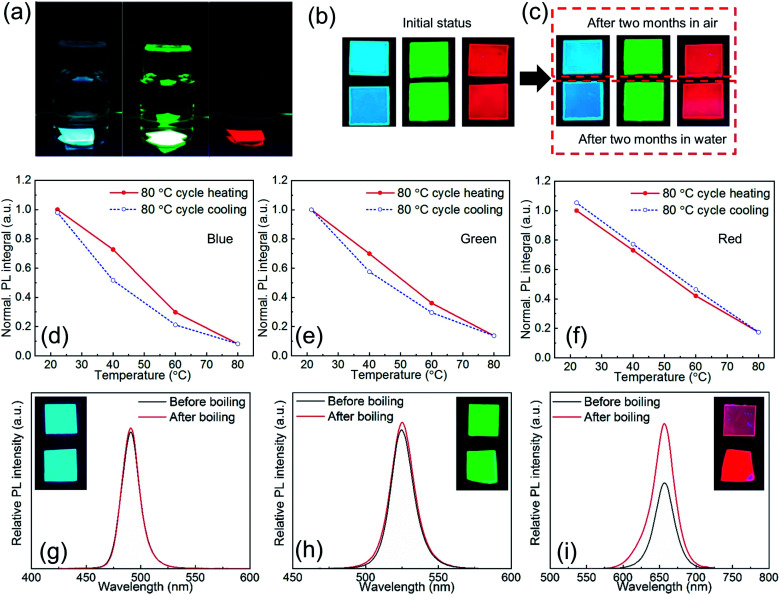
Due to the excellent size control and surface passivation by ligands as well as the intimate protection by the polymer matrix, the as-synthesized PPCs are ultrastable against environmental stimulus such as moisture, heat, etc.Fig. 5a shows RGB PPCs that have been immersed in water for two months. In the experiments, the as-synthesized PPC films were split into two pieces each, with one left in air and the other stored in water, both without extra encapsulation. After two months both pieces did not show obvious luminescence decay (Fig. 5b and c), and UV-Vis and PL spectra for blue and green samples remain unchanged (Fig. S10†). A slight difference is noticed for the red sample stored in water for two months, as it has one more absorption peak at around 435 nm, which can be attributed to the yellow 1-D orthorhombic phase with a wider bandgap.42 However, optical properties of the one stored in air with average 50% relative humidity (RH) remain the same. In fact, structural instability is pronounced for iodine based perovskites (Cs and FA based) because their 3D polymorphs are metastable and can easily transform to wide-bandgap 1D polymorphs.43–47 As a result, red and near infrared perovskites suffer from the instability issue and are more prone to surface defects and environmental factors, known as the “red wall”. In particular, CsPbI3 is usually claimed to be highly unstable and could retain its red PL for several weeks only,48 but CsPbI3 PPCs obtained with LASDM in this work are stored in air for more than six months and still show a strong PL emission around 700 nm (Fig. S11†), with a 10% brightness enhancement. The 1D orthorhombic phase still evolves as indicated in the absorption spectrum, but the reason for PL brightness enhancement is unclear and needs further investigation.
Fig. 5. Water and thermal stability characterization. (a) Photographs of blue (CsPbClBr2–PS), green (CsPbBr3–PS) and red (CsPbBrI2–PS) composite films in water under UV irradiation after two months of water immersion. (b and c) Each film sample was cut into two pieces in the beginning, with one piece stored in air and the other immersed in water. Photographs of the two pieces in one frame taken (b) at the beginning and (c) after two months. (d–f) Temperature-dependent PL intensities of (d) blue (CsPbClBr2–PS), (e) green (CsPbBr3–PS), and (f) red (CsPbBrI2–PS) composites. The red solid line refers to the heating process and the blue dashed line refers to the cooling process. (g–i) Comparison of PL emission spectra and relative PL intensities of (g) blue (CsPbClBr2–PS), (h) green (CsPbBr3–PS) and (i) red (CsPbBrI2–PS) composites before (black line) and after (red line) boiling water treatment. Inset shows the photos of the unboiled piece (top) and boiled piece (bottom) originally cut from one sample.
In order to characterize thermal stability, RGB PPCs are heated up to 80 °C which is close to the glass transition temperature of the PS matrix (Tg ∼ 90 °C) with the PL intensity monitored. All of the PPCs of different halide compositions and emitting colors can retain their initial PL intensity after being cooled down to room temperature (Fig. 5d–f), with identical absorption and emission spectra (Fig. S12†). In particular for the red PPCs, which could be more subject to phase transition at elevated temperatures; no signal of the yellow phase appears after the heating treatment. Given the excellent water and thermal stability, the PPCs are then tested in boiling water for more than 30 s (ESI Videos 1–3†). After boiling, the sample is put together with the reference for brightness comparison (Fig. 5g–i, inset photographs). From the measured relative PL spectra, blue and green samples almost retain the same brightness before/after boiling treatment, while surprisingly red PPCs show 1.7-fold PL enhancement after boiling. Moisture enhanced PL has been reported for perovskite materials and could be explained by hydrogen bonding induced deactivation of nonradiative recombination centers. A limited amount of water molecule penetration might be helpful, as observed from the result, before excessive water causes any phase transition (Fig. S13†). These results indicate that LASDM can effectively stabilize the crystal structure and slow down the phase transition, and with further selection of polymer substrates of lower permeability, better stability performance is expected.
For practical application scenarios, instead of considering thermal or water stability alone, the stability in a controlled high-temperature, high-humidity environment should be emphasized. Here, the PL intensities of three samples (CsPbBr3–PS, CsPbI3–PS, and MAPbBr3–PS) in a relatively harsh environment (70 °C, 90% RH) are monitored. As shown in Fig. S14,† the green-emitting samples maintained ∼40% of their initial PL intensities after 30 days, exhibiting much better stability than perovskite–polymer composites prepared by another in situ fabrication method in a similar environment.15 For the relatively unstable red-emitting sample, the PL intensity drops quickly in the first few days and then decreases slowly, resulting in a relative intensity of ∼20% after 30 days. While for applications such as lighting, intense blue light is applied to pump the downconverters and thus photostability is also crucial for practical uses. In the experiment, in situ photostability of a green-emitting sample (CsPbBr3–PS) is tested (Fig. S15†). It should be noted that for a standard illuminant D65 with 10 000 nit luminescence, the blue light irradiance is about 10–20 mW cm−2. Here a 457 nm blue laser with an irradiance of 100 mW cm−2 is utilized to pump and test the sample in an accelerated manner. After 6 hours, the PL intensity still maintains ∼70% of its initial intensity.
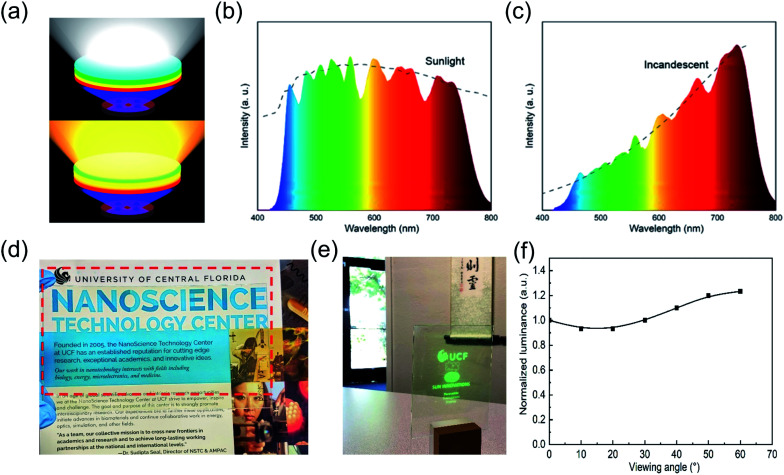
With excellent color tunability and purity, strong environmental stability, and OD flexibility, the PPCs synthesized by LASDM are highly promising in applications including but not limited to display backlighting, solid-state lighting and transparent projection displays. For example, modern solid-state lighting with all kinds of target application scenarios calls for delicate spectral, intensity and spatial control. Working with blue/UV LEDs, perovskite PPCs with continuously tunable emission spectra and narrow emission bandwidths can serve as tunable downconverters providing cost effective spectral control. Fig. 6a shows a concept proof scheme of exchangeable PPC remote downconverter plates combined with blue/UV LEDs for tailored lighting. With different combinations of emitting colors and OD, perovskite downconverters can meet a variety of spectral requirements with high fidelity. As two representative examples, sunlight and incandescent light can be simulated with high fidelity using the measured perovskite PPC spectra (Fig. 6b and c), demonstrating great potential for spectra engineered lighting.
Fig. 6. (a) Scheme of PPC films with different colors used as exchangeable down-conversion sheets in lighting applications. Fitted spectra for (b) sunlight like or (c) incandescent light like lighting using PPCs' PL spectra of different emitting wavelengths. (d) Photograph of a 5′′ by 3′′ transparent green PPC film under ambient light, in front of the text. (e) Photograph of the transparent projection display. (f) Luminescence at different viewing angles.
Another prominent example of application is transparent emissive projection displays.49 As schematically shown in Fig. S16,† a short wavelength (405 nm) projector is applied as the image source and our PPC plate is employed as the transparent emissive screen. These displays can provide real time information on a display screen right around users' viewpoints while users can still see through it. They have gained a lot of attention recently because they can be potentially applied to any windows and thus have a huge market. The PPC plate shows great potential to be used as a transparent emissive screen, providing high transparency, a wide viewing angle and a fast response time. Thanks to the intrinsically easy scalability of the SDM process, a 5′′ by 3′′ PPC plate with a transparency of over 88% for wavelengths longer than 450 nm (Fig. S17†) is fabricated by blade coating (Fig. 6d) and a live projection display with a MEMS laser projector is demonstrated (Fig. 6e, ESI Video 4†). The measured luminescence of a laser excited single spot on the PPC plate from different viewing angles is shown in Fig. 6f. A larger than 60° view angle can be guaranteed with this PPC-enabled transparent projection display.
Conclusions
An LASDM strategy is proposed and evaluated for improving the stability and PL performance of PNCs. With ligand assistance, well dispersed and intimately passivated PNCs in polymer matrices are obtained. Subsequently, the proposed method can provide better nanocrystal size control and surface coordination. Thus, full-color PPCs with unprecedented environmental stability can be achieved and concentration quenching can be avoided even when a highly concentrated precursor solution is applied. The excellent color purity, color tunability, optical density variability and environmental stability make PPCs highly promising for a range of PL applications, such as tailored lighting and transparent projection displays. Moreover, the simple, low cost, scalable process and the generality of this method for polymer matrices should pave the way for PPCs to be employed in practical applications.
Conflicts of interest
There are no conflicts to declare.
Supplementary Material
Acknowledgments
J. He and Z. He contributed equally to this work. The authors thank Dr Shun-Wei Liu from the Mingchi University of Technology, Taiwan, for PLQY measurements. S. T. Wu acknowledges partial support of the AFOSR under contract No. FA9550-14-1-0279. Y. J. Dong is grateful for support of this work by the UCF through a startup funding and an NSTC seed grant.
Electronic supplementary information (ESI) available. See DOI: 10.1039/d0na00196a
Notes and references
- Green M. A. Ho-Baillie A. Snaith H. J. Nat. Photonics. 2014;8:506. doi: 10.1038/nphoton.2014.134. [DOI] [Google Scholar]
- Stranks S. D. Snaith H. J. Nat. Nanotechnol. 2015;10:391. doi: 10.1038/nnano.2015.90. [DOI] [PubMed] [Google Scholar]
- Fang Y. J. Dong Q. F. Shao Y. C. Yuan Y. B. Huang J. S. Nat. Photonics. 2015;9:679. doi: 10.1038/nphoton.2015.156. [DOI] [Google Scholar]
- He Z. Zhang C. Dong Y. Wu S. T. Crystals. 2019;9:59. doi: 10.3390/cryst9020059. [DOI] [Google Scholar]
- He J. Chen H. Chen J. Wang Y. Wu S. T. Dong Y. Opt. Express. 2017;25:1291. doi: 10.1364/OE.25.012915. [DOI] [PubMed] [Google Scholar]
- Zhou Y. Zhao Y. Energy Environ. Sci. 2019;12:1495. doi: 10.1039/C8EE03559H. [DOI] [Google Scholar]
- Wei Y. Cheng Z. Lin J. Chem. Soc. Rev. 2019;48:310. doi: 10.1039/C8CS00740C. [DOI] [PubMed] [Google Scholar]
- Lv W. Li L. Xu M. Hong J. Tang X. Xu L. Wu Y. Zhu R. Chen R. Huang W. Adv. Mater. 2019;31:1900682. doi: 10.1002/adma.201900682. [DOI] [PubMed] [Google Scholar]
- Chang S. Bai Z. Zhong H. Adv. Opt. Mater. 2018;6:1800380. doi: 10.1002/adom.201800380. [DOI] [Google Scholar]
- Malgras V. Tominaka S. Ryan J. W. Henzie J. Takei T. Ohara K. Yamauchi Y. J. Am. Chem. Soc. 2016;138:13874. doi: 10.1021/jacs.6b05608. [DOI] [PubMed] [Google Scholar]
- Demchyshyn S. Roemer J. M. Groiß H. Heilbrunner H. Ulbricht C. Apaydin D. Böhm A. Rütt U. Bertram F. Hesser G. Sci. Adv. 2017;3:e1700738. doi: 10.1126/sciadv.1700738. [DOI] [PMC free article] [PubMed] [Google Scholar]
- Dirin D. N. Protesescu L. Trummer D. Kochetygov I. V. Yakunin S. Krumeich F. Stadie N. P. Kovalenko M. V. Nano Lett. 2016;16:5866. doi: 10.1021/acs.nanolett.6b02688. [DOI] [PMC free article] [PubMed] [Google Scholar]
- Raja S. N. Bekenstein Y. Koc M. A. Fischer S. Zhang D. Lin L. Ritchie R. O. Yang P. Alivisatos A. P. ACS Appl. Mater. Interfaces. 2016;8:35523. doi: 10.1021/acsami.6b09443. [DOI] [PubMed] [Google Scholar]
- Zhang H. Wang X. Liao Q. Xu Z. Li H. Zheng L. Fu H. Adv. Funct. Mater. 2017;27:1604382. doi: 10.1002/adfm.201604382. [DOI] [Google Scholar]
- Zhou Q. Bai Z. Lu W. Wang Y. Zou B. Zhong H. Adv. Mater. 2016;28:9163. doi: 10.1002/adma.201602651. [DOI] [PubMed] [Google Scholar]
- Chen X. Zhang F. Ge Y. Shi L. Huang S. Tang J. Lv Z. Zhang L. Zou B. Zhong H. Adv. Funct. Mater. 2018;28:1706567. doi: 10.1002/adfm.201706567. [DOI] [Google Scholar]
- Ye Y. Zhang W. Zhao Z. Wang J. Liu C. Deng Z. Zhao X. Han J. Adv. Opt. Mater. 2019;7:1801663. doi: 10.1002/adom.201801663. [DOI] [Google Scholar]
- Yuan S. Chen D. Li X. Zhong J. Xu X. ACS Appl. Mater. Interfaces. 2018;10:18918. doi: 10.1021/acsami.8b05155. [DOI] [PubMed] [Google Scholar]
- He Z. He J. Zhang C. Wu S. T. Dong Y. Chem. Rec. doi: 10.1002/tcr.201900074. [DOI] [Google Scholar]
- Shi L. Meng L. Jiang F. Ge Y. Li F. Wu X. G. Zhong H. Adv. Funct. Mater. 2019;29:1903648. doi: 10.1002/adfm.201903648. [DOI] [Google Scholar]
- Wang Y. He J. Chen H. Chen J. Zhu R. Ma P. Towers A. Lin Y. Gesquiere A. J. Wu S. T. Dong Y. Adv. Mater. 2016;28:10710. doi: 10.1002/adma.201603964. [DOI] [PubMed] [Google Scholar]
- Yang Y. Yang M. Li Z. Crisp R. Zhu K. Beard M. C. J. Phys. Chem. Lett. 2015;6:4688. doi: 10.1021/acs.jpclett.5b02290. [DOI] [PubMed] [Google Scholar]
- Cohen B. E. Wierzbowska M. Etgar L. Adv. Funct. Mater. 2017;27:1604733. doi: 10.1002/adfm.201604733. [DOI] [Google Scholar]
- He J. Towers A. Wang Y. Yuan P. Zhang J. Chen J. Gesquiere A. J. Wu S. T. Dong Y. Nanoscale. 2018;10:15436. doi: 10.1039/C8NR04895A. [DOI] [PubMed] [Google Scholar]
- Weidman M. C. Seitz M. Stranks S. D. Tisdale W. A. ACS Nano. 2016;10:7830. doi: 10.1021/acsnano.6b03496. [DOI] [PubMed] [Google Scholar]
- Fang X. Zhai W. Zhang K. Wang Y. Yao L. Tian C. Wan Y. Hou R. Li Y. Chen W. AIP Adv. 2017;7:085217. doi: 10.1063/1.4994995. [DOI] [Google Scholar]
- Sun S. Yuan D. Xu Y. Wang A. Deng Z. ACS Nano. 2016;10:3648. doi: 10.1021/acsnano.5b08193. [DOI] [PubMed] [Google Scholar]
- Zhang F. Zhong H. Chen C. Wu X.-g. Hu X. Huang H. Han J. Zou B. Dong Y. ACS Nano. 2015;9:4533. doi: 10.1021/acsnano.5b01154. [DOI] [PubMed] [Google Scholar]
- Di D. Musselman K. P. Li G. Sadhanala A. Ievskaya Y. Song Q. Tan Z.-K. Lai M. L. MacManus-Driscoll J. L. Greenham N. C. J. Phys. Chem. Lett. 2015;6:446. doi: 10.1021/jz502615e. [DOI] [PMC free article] [PubMed] [Google Scholar]
- Patterson A. Phys. Rev. 1939;56:972. doi: 10.1103/PhysRev.56.972. [DOI] [Google Scholar]
- De Roo J. Ibáñez M. Geiregat P. Nedelcu G. Walravens W. Maes J. Martins J. C. Van Driessche I. Kovalenko M. V. Hens Z. ACS Nano. 2016;10:2071. doi: 10.1021/acsnano.5b06295. [DOI] [PubMed] [Google Scholar]
- Pan A. He B. Fan X. Liu Z. Urban J. J. Alivisatos A. P. He L. Liu Y. ACS Nano. 2016;10:7943. doi: 10.1021/acsnano.6b03863. [DOI] [PubMed] [Google Scholar]
- Yang D. Li X. Zeng H. Adv. Mater. Interfaces. 2018;5:1701662. doi: 10.1002/admi.201701662. [DOI] [Google Scholar]
- Hansen C. M., Hansen solubility parameters: a user's handbook, CRC Press, 2002 [Google Scholar]
- Barton A. F., CRC handbook of solubility parameters and other cohesion parameters, Routledge, 2017 [Google Scholar]
- Protesescu L. Yakunin S. Bodnarchuk M. I. Krieg F. Caputo R. Hendon C. H. Yang R. X. Walsh A. Kovalenko M. V. Nano Lett. 2015;15:3692. doi: 10.1021/nl5048779. [DOI] [PMC free article] [PubMed] [Google Scholar]
- Yoon H. C. Lee S. Song J. K. Yang H. Do Y. R. ACS Appl. Mater. Interfaces. 2018;10:11756. doi: 10.1021/acsami.8b01014. [DOI] [PubMed] [Google Scholar]
- Staub F. Hempel H. Hebig J.-C. Mock J. Paetzold U. W. Rau U. Unold T. Kirchartz T. Phys. Rev. Appl. 2016;6:044017. doi: 10.1103/PhysRevApplied.6.044017. [DOI] [Google Scholar]
- Yarita N. Tahara H. Saruyama M. Kawawaki T. Sato R. Teranishi T. Kanemitsu Y. J. Phys. Chem. Lett. 2017;8:6041. doi: 10.1021/acs.jpclett.7b02840. [DOI] [PubMed] [Google Scholar]
- Xing G. Mathews N. Lim S. S. Yantara N. Liu X. Sabba D. Grätzel M. Mhaisalkar S. Sum T. C. Nat. Mater. 2014;13:47. doi: 10.1038/nmat3911. [DOI] [PubMed] [Google Scholar]
- D'Innocenzo V. Srimath Kandada A. R. De Bastiani M. Gandini M. Petrozza A. J. Am. Chem. Soc. 2014;136:17730. doi: 10.1021/ja511198f. [DOI] [PubMed] [Google Scholar]
- Stoumpos C. C. Malliakas C. D. Kanatzidis M. G. Inorg. Chem. 2013;52:9019. doi: 10.1021/ic401215x. [DOI] [PubMed] [Google Scholar]
- Babin V. Fabeni P. Nikl M. Nitsch K. Pazzi G. Zazubovich S. Phys. Status Solidi B. 2001;226:419. doi: 10.1002/1521-3951(200108)226:2<419::AID-PSSB419>3.0.CO;2-C. [DOI] [Google Scholar]
- Protesescu L. Yakunin S. Kumar S. Bär J. Bertolotti F. Masciocchi N. Guagliardi A. Grotevent M. Shorubalko I. Bodnarchuk M. I. ACS Nano. 2017;11:3119. doi: 10.1021/acsnano.7b00116. [DOI] [PMC free article] [PubMed] [Google Scholar]
- Li Z. Yang M. Park J.-S. Wei S.-H. Berry J. J. Zhu K. Chem. Mater. 2015;28:284. doi: 10.1021/acs.chemmater.5b04107. [DOI] [Google Scholar]
- Travis W. Glover E. Bronstein H. Scanlon D. Palgrave R. Chem. Sci. 2016;7:4548. doi: 10.1039/C5SC04845A. [DOI] [PMC free article] [PubMed] [Google Scholar]
- Filip M. R. Eperon G. E. Snaith H. J. Giustino F. Nat. Commun. 2014;5:5757. doi: 10.1038/ncomms6757. [DOI] [PubMed] [Google Scholar]
- Huang H. Bodnarchuk M. I. Kershaw S. V. Kovalenko M. V. Rogach A. L. ACS Energy Lett. 2017;2:2071. doi: 10.1021/acsenergylett.7b00547. [DOI] [PMC free article] [PubMed] [Google Scholar]
- Sun T., Pettitt G., Ho N. T., Eckles K., Clifton B. and Cheng B., Full color high contrast front projection on black emissive display, Presented at Emerging Digital Micromirror Device Based Systems and Applications IV, 2012 [Google Scholar]
Associated Data
This section collects any data citations, data availability statements, or supplementary materials included in this article.


