. 2022 Aug 15;11:e78967. doi: 10.7554/eLife.78967

Figure 1. Transcriptome profiling of Primitive Endoderm (PrE) in vitro differentiation.

(A) Schematic of the experiment. Cells were passaged twice in 2i/LIF and then plated in RPMI base media 24 hr before starting the experiment. Bottom panel: Flow cytometry plots showing the time points selected for single-cell RNA-seq. The fluorescent information of Sox2 and Hhex was recorded prior to sequencing. Cells from all the populations shown in the plots were collected for sequencing. (B) UMAP projection of the in vitro experiment showing nine identified clusters using Louvain (upper panel) and stages of differentiation (bottom panel). (C) Heatmap showing expression of selected Epi, Inner Cell Mass (ICM), and PrE markers in 2i/LIF, days 2 and 7 of differentiation. Left panel: PrE Diff branch. Right panel: NEDiff branch. Cells at day 2 in the PrE branch already are upregulating endoderm genes while the NEDiff cells are not. (D) Sankey plot visualizing cluster similarity comparison between identified in vitro clusters and in vivo (Nowotschin et al., 2019) experiment using the Cluster Alignment Tool (CAT).

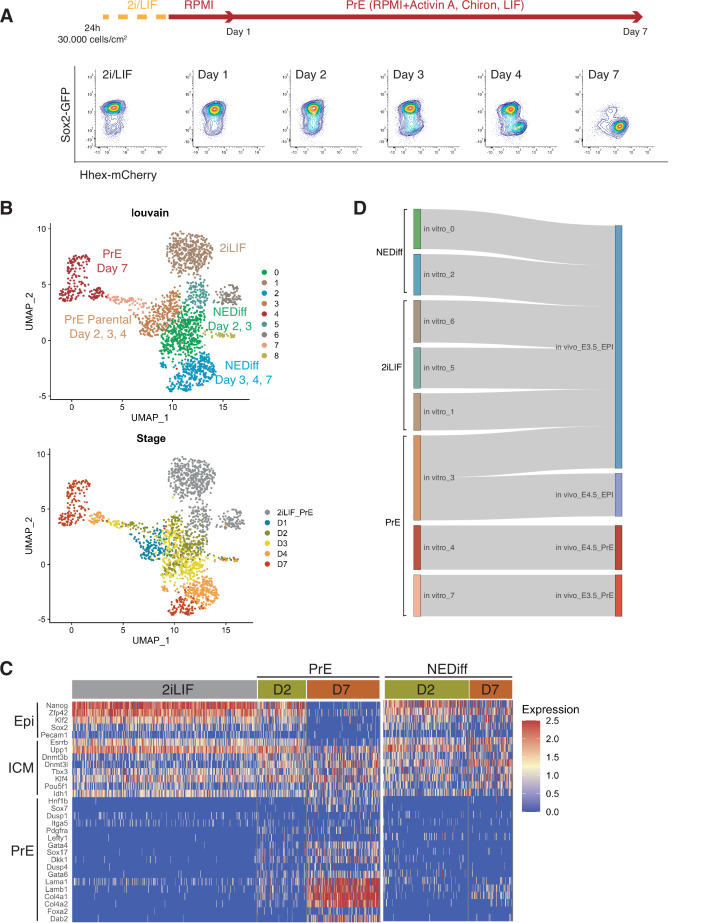
Figure 1.

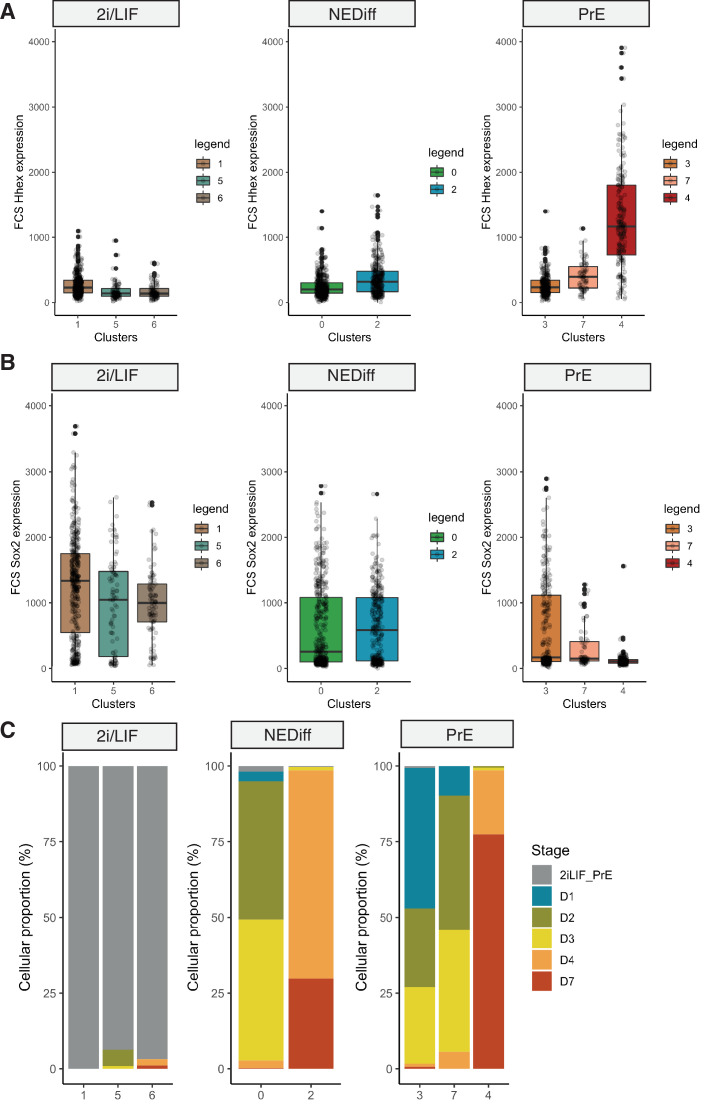
Figure 1—figure supplement 1. Properties of cells collected for MARS-seq during Primitive Endoderm (PrE) in vitro differentiation.

Figure 1—figure supplement 1.

(A) Fluorescence intensity on the Hhex-mCherry channel recorded by the FACS at the moment of the sample collection for sequencing. Samples were collected from 2i/LIF culture, and days 1, 2, 3, 4, and 7 of PrE differentiation. Cells are labelled PrE or NEDiff according to whether they belong to the PrE branch or the not differentiated branch, respectively. PrE cells show higher Hhex reporter expression than the NEDiff clusters. (B) Fluorescence intensity on the Sox2-GFP channel recorded by FACS at the moment of the sample collection for sequencing. Samples were collected from 2i/LIF culture, and days 1, 2, 3, 4, and 7 of PrE differentiation. Cells are labelled PrE or NEDiff according to whether they belong to the PrE branch or the not differentiated branch, respectively. NEDiff cells show higher Sox2 reporter expression than the PrE clusters. (C) Cellular proportions of cells in 2i/LIF vs. NEDiff vs. PrE branch, showing that clusters 1, 5, and 6 belong to the 2i/LIF cells. Cells from days 2, 3, and 4 are separated between differentiated (PrE, clusters 3, 7, and 4) and non-differentiated (NEDiff, clusters 0 and 2).
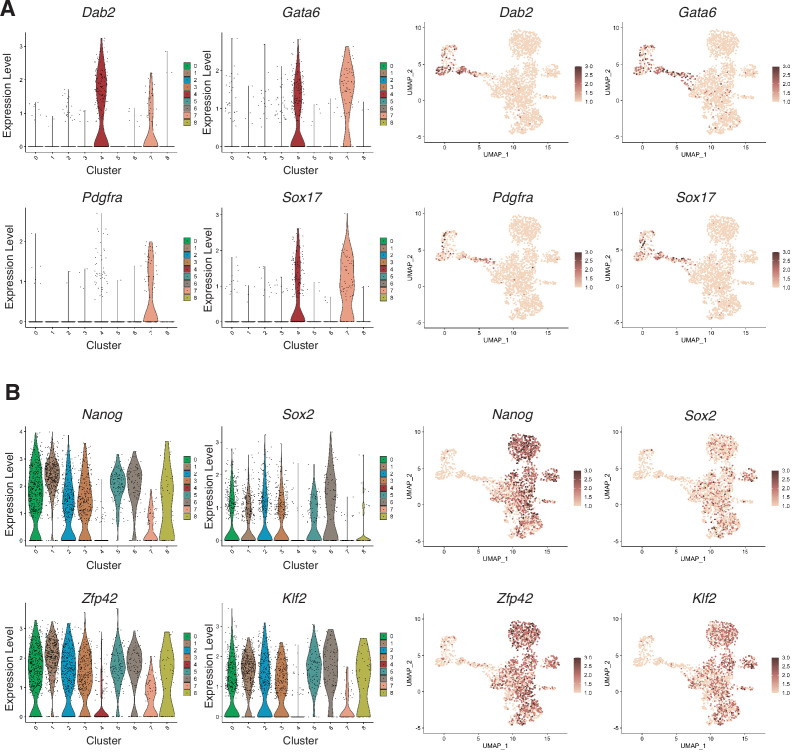
Figure 1—figure supplement 2. Lineage-specific markers expressed in single-cell RNA-seq clusters.

Figure 1—figure supplement 2.

(A) Interrogation of endodermal genes (Dab2, Gata6, Pdgfra, and Sox17), mostly expressed in the Primitive Endoderm (PrE) branch of the dataset. (B) Interrogation of Epiblast genes (Nanog, Sox2, Zfp42, and Klf2), mostly expressed in the 2i/LIF clusters and the NEDiff branch of the dataset.