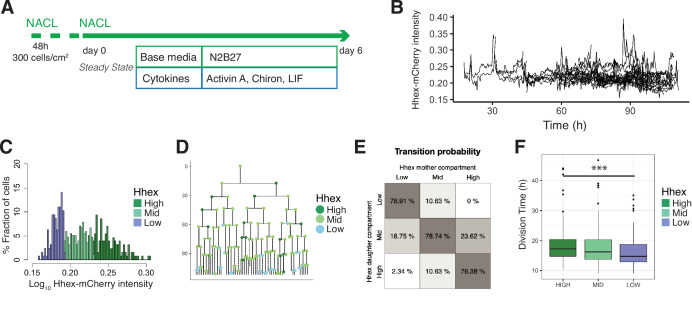
Figure 4. Single-cell quantification of Hhex expression in NACL uncovers a relationship between Hhex levels and cell cycle length.
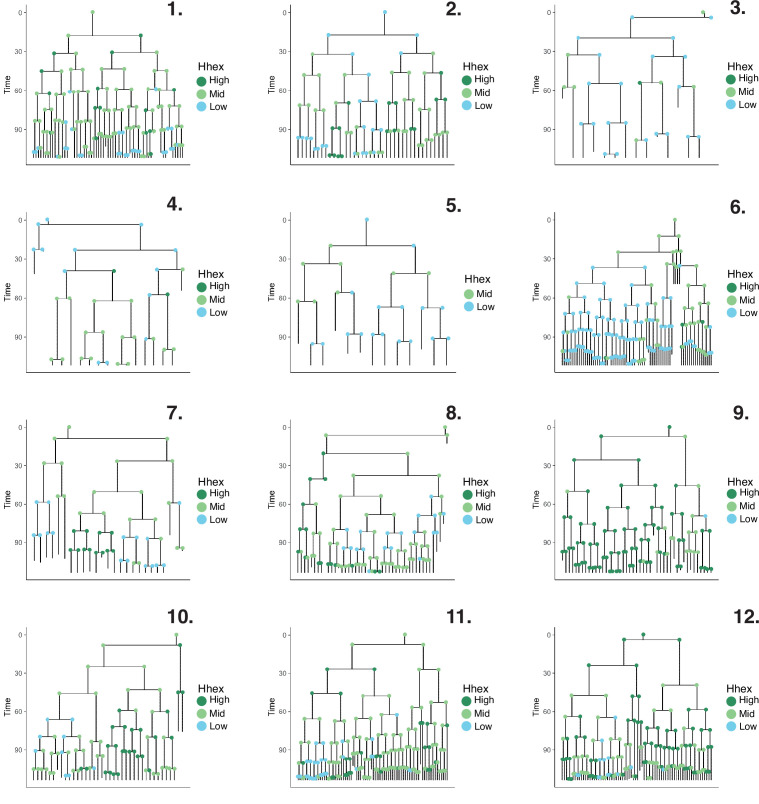
(A) Schematic of the experimental setup. Cells were plated 48 hr before starting the experiment. Cells were imaged for 6 days acquiring one time frame every 20 min. (B) Example of a cell trace (Time vs. Hhex-mCherry intensity) in the setup analysed. Cells survived and divided over 6 days without any apparent effect of cell death. Cells were entering and exiting higher and lower Hhex states without any apparent bias. (C) Hhex intensity distribution was divided into three compartments: High (includes cells above 75% percentile), Mid (between 25% and 75% percentiles), and Low (cells below 25% percentile). Y-Axis shows the percentage of cells that falls into each bin. See Table 4 for total cell numbers per compartment. (D) Example of a lineage tree with the corresponding compartments of Hhex, by colour. The first and last generation were discarded from further analysis since the cell cycle information is not complete. All lineage trees collected in the NACL condition are shown in Figure 4—figure supplement 2. This example corresponds to Tree 1 in Figure 4—figure supplement 2. (E) Probability of cells to transition compartments between mother and daughter cells, quantified as percentage of cells over one generation. (F) The Low Hhex population divides significantly faster than the High Hhex. ***p value <0.001, Kruskal–Wallis test. The Mid Hhex population shows an in-between division time, suggesting a linear relationship between Hhex expression level and cell cycle length.


