Abstract
We report a high-performance magnetic nanoparticle as a hyperthermic agent under low applied field and frequency. CTAB (cetyltrimethylammonium bromide)-coated NixZn1−xFe2O4 nanoparticles of average particle size < 25 nm with various stoichiometric ratios were successfully synthesized using a co-precipitation technique. Characterization results indicate a close interaction of CTAB ions with the surface metal ions resulting in a cation distribution deviating from their equilibrium positions. Magnetic measurements were done at 300 K and 5 K using a superconducting quantum interference device. Saturation magnetization gradually increases with increasing substitution of Ni2+ ions with Zn2+ ions, attributed to the cation distribution and high super-exchange interaction between the A- and B-sites. The average size of the nanoparticles is estimated to be <10 nm with a magnetically dead layer (>1 nm @ 300 K), reflecting the effect of CTAB coating on the surface of the nanoparticles. The magnetocrystalline anisotropy (Keff), obtained from the law of approach to saturation, is inversely proportional to the Ms value. The increasing incorporation of Ni2+ ions in the lattice system is found to influence various structural parameters, which is reflected in the magnetic performance of the nanoparticles. A specific absorption rate of 347 W g−1 and intrinsic loss power of 4.6 nH m2 kg−1 was attained with a minimal concentration of 2 mg ml−1 in a very short time period of 1.5 min in Ni0.75Zn0.25Fe2O4 nanoparticles.
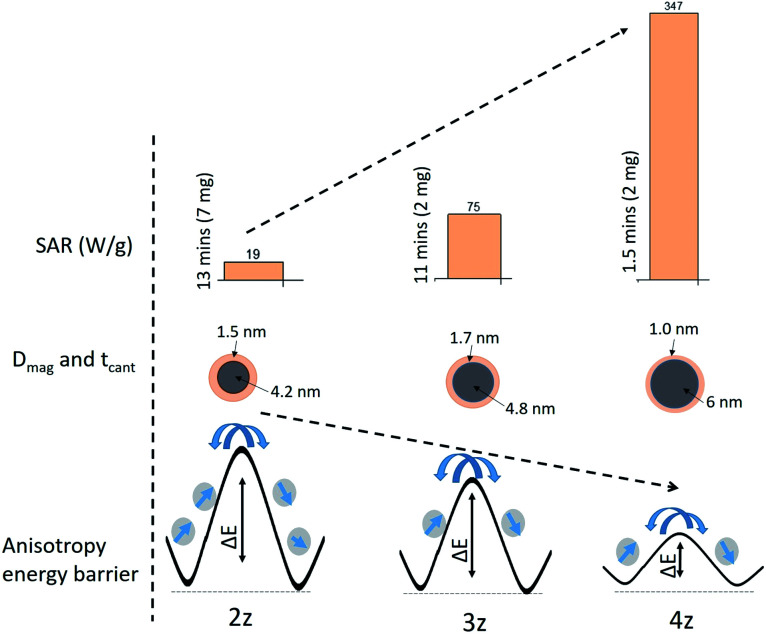
Nickel–zinc ferrite nanoparticles coated with cetyltrimethylammonium bromide provide sufficient heat generation rate for hypothermia with only 2 mg ml−1, some of the lowest amount reported to date, under low applied field and frequency.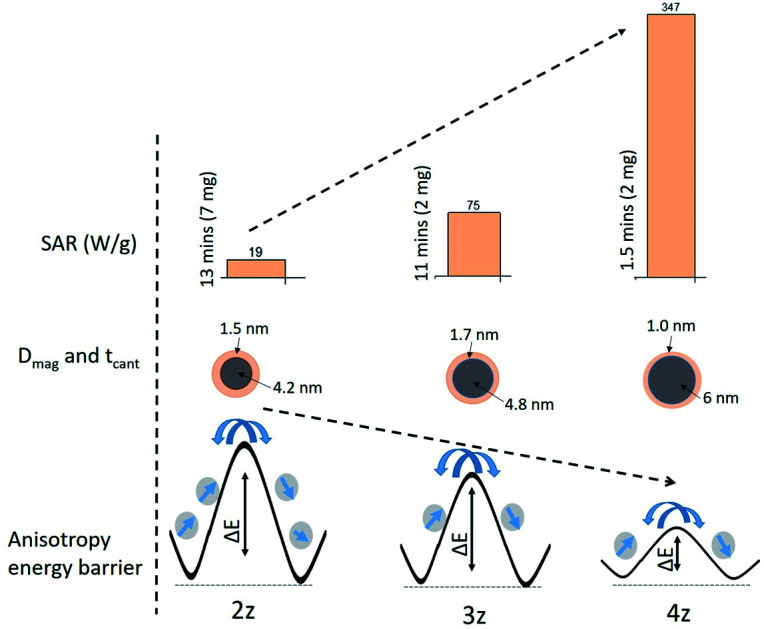
Introduction
One of the key challenges in magnetic hyperthermia is the amount of heat a magnetic nanoparticle (MNP) can generate at very low magnetic field strength for a minimally invasive heat treatment. Search for new magnetic nanomaterials has been ongoing to obtain the highest specific absorption rate (SAR) values at the lowest administered particle dose and the lowest frequency and/or magnetic field amplitude possible. Saturation magnetization (Ms) and magnetic anisotropy (Keff) play a crucial role in determining the heating efficiency of the nanoparticles. Ferrites (MFe2O,4 M: Mn, Co, Fe etc.) are good candidates for hyperthermia due to their medium magnetic moment, biocompatibility, low inherent toxicity, ease of synthesis and their physical and chemical stabilities, and relatively high specific absorption rate (SAR).1–3 These properties are essentially tailored through chemical composition and cation distribution in the spinel lattice system.4 ZnFe2O4 is one of the labile compounds (Zn being a non-magnetic ion) in the ferrites family. It has a normal spinel structure ((Zn2+)A[Fe23+]BO42−) whose magnetic property is known to strongly depend on the degree of inversion.5 In contrast, NiFe2O4 of inverse spinel structure ((Fe3+)A[Ni2+Fe3+]BO42−) is a soft magnetic material well-known for its moderate coercivity and saturation magnetization in bulk form.6 The properties of these two compounds are very different; for example, Ni ferrite is ferrimagnetic with a Curie temperature of ∼858 K while Zn ferrite is antiferromagnetic with a Neel temperature of about 9 K.7 This indicates that desirable properties can be tailored just by varying the ferrite composition. For example, Dalal et al. showed that Zn substitution in NiFe2O4 increases the saturation magnetization by redistributing the cations in A(tet) and B(oct) sites with maximum magnetization obtained by 50% Zn substitution.8 Kavas et al. also reported that the saturation magnetization decreases considerably with increasing concentration of Zn2+ since an increase in the occupancy of Zn2+ in tetrahedral A-site weakens the superexchange A(tet)–O–B(oct) interaction; a further decrease of Zn2+ can conversely cause B(oct)–O–B(oct) interaction equivalent to A(tet)–O–B(oct) interaction.9 Here, subscripts tet and oct refer to tetrahedral and octahedral sites, respectively. By introducing different metal cations, it is possible to manipulate the strength of magnetic interactions in lattice sites to adjust the saturation magnetization as well as the magnetic anisotropy of the nanoparticles.
Incorporation of organic molecules as surface coating agent is shown not only to control particle growth, prevent aggregation or inter-particle interaction but has influence towards the magnetic properties of the nanoparticles. It is well established by the ligand field theory that π-acceptor ligands (e.g. CTAB, oleic acid) are responsible for a co-ordination that induces a large crystal field splitting energy (CFSE). For a transition metal, large CFSE indicates a large d-orbital splitting and a small spin–orbit coupling. Such coupling represents a source for the magnetocrystalline anisotropy, which is thus reduced by π-acceptor ligands at the particle surface. Vadivel et al. studied the influence of various concentrations of CTAB in CoFe2O4 and found a significant impact of size on enhancing the Ms value.10 Lu et al. studied the influence of sodium dodecyl sulfate (SDS, π-donor), polyethylene glycol (PEG, π-donor) and CTAB surfactants on SrFe12O19 nanoparticles prepared by co-precipitation and concluded that the addition of CTAB enhances the properties more relative to the other two surfactants (SDS and PEG).11 There has been a surge in the search for a suitable heating mediator that can generate enough heat with a very low concentration of MNPs. In this study, we present an excellent heat generating nanomaterial requiring less than 2 mg of MNPs: CTAB-coated nickel-substituted zinc ferrite (NixZn1−xFe2O4 where x = 0.0, 0.25, 0.5, 0.75) nanoparticles. A systematic investigation on the CTAB controlled crystallite size, cationic distribution and its influence towards the magnetic properties, the specific absorption rate (SAR) and intrinsic loss power (ILP) is presented. This study is precursor to establishing biocompatibility, toxicity and other factors that determine successful approval for clinical use. The field and frequency applied here are under human tolerable range. This work demonstrates the tunability of the desired limit of heat generation by understanding the correlation between the nature of the surface binding ligand (CTAB) and the structural and magnetic properties of the nanoparticles.
Experimental work
Synthesis
All chemicals were of analytical grade and used without further purification for the synthesis. NixZn1−xFe2O4 nanoparticles with four different stoichiometric ratios (x: 0.0, 0.25, 0.50, 0.75) were prepared by co-precipitation at room temperature using Zn(NO3)2·6H2O, FeN3O9·7H2O and Ni(NO3)·6H2O as precursors. These four samples are labeled 1z, 2z, 3z and 4z here for convenience. A 1.5 molar solution of NaOH was monitored drop-wise under constant stirring until a pH of 7–8 was obtained at ∼200–250 °C. A specified amount of CTAB was gradually added into the solution as a surfactant and coating material. The liquid precipitate was then stirred at 80 °C with a magnetic stirrer for 30 minutes and further sonicated at 50 °C for another 30 minutes. The reaction mixture was cooled and centrifuged at 2500 rpm to separate the precipitates from the solution. After that, the precipitates were vacuum pumped and washed 2–3 times with ethanol and deionized water to remove the excess surfactant, and dried at 100 °C overnight. The dried precipitate was then ground into fine powder and heated at 200 °C for 4 hours.
Characterization
X-ray diffraction (XRD) patterns were taken with Rigaku X-ray Diffractometer operating at 50 kV/180 A m at room temperature using CuKα (λ = 1.5406 Å) to identify the structure of the samples. The morphology of the nanoparticles was analyzed using Field Emission Scanning Electron Microscope (FESEM, Zeiss). The incorporation of CTAB as coating agent was analyzed by Fourier Transform Infrared (FTIR) spectroscopy. The vibrational modes and an indication of inversion parameter were examined at room temperature by Raman spectroscopy (LabRam HR, Horiba). The DC magnetic measurements were done using Superconducting Quantum Interference Device (SQUID, Quantum Design. MPMS XL-5) at room temperature 300 K and low temperature 5 K. Induction heating of the samples was performed using Easy Heat 8310 (Ambrell make) with 8-turn coils. Here, the Easy Heat power supply delivers RF energy to the work-head to heat the target samples. In the work head, the energy from the power supply concentrates an electromagnetic field within the coil. Samples of required mass suspended in 1 ml of distilled water were sonicated and placed at the center of the coil, and a constant frequency (f) and applied field amplitude (H) were kept at 337 kHz and 14.98 kA m−1 respectively. The magnetic field (H) calculation is shown in Fig. S1.† An RF-immune fiber optic probe was attached to the temperature sensor module and placed within the target material to determine the temperature rise in the sample with respect to time.
Results and discussion
Structural analysis
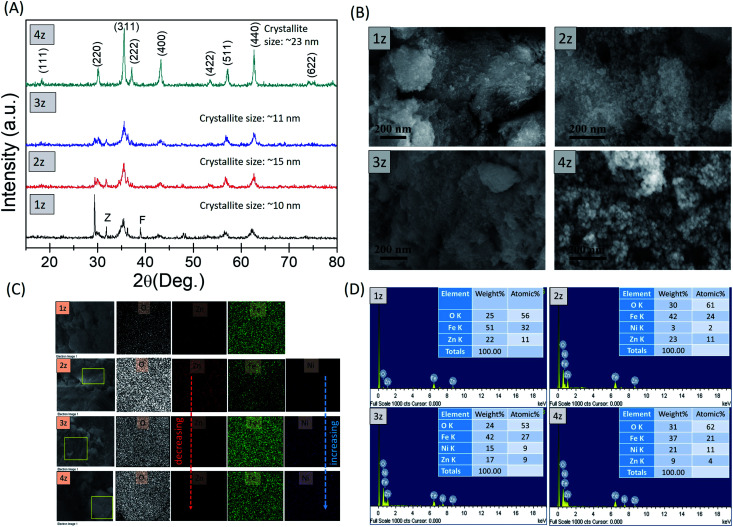
X-ray diffraction patterns in Fig. 1A show characteristic reflections of cubic spinel ZnFe2O4 and Ni–ZnFe2O4 [ICDD: No: 01-073-1963]. A phase pure and well crystallized nature is reflected in sample 4z, while some minor impure phase of ZnO (Z) [ICDD: 00-036-1451] and Fe2O3 (F) [ICDD: 00-039-1346] is detected in samples 1z, 2z, and 3z, which must have resulted from some incomplete reactions during the synthesis.12,13 The crystallite size (Dsh), approximated from the most prominent peak (311) using Scherrer's formula, is 10 nm, 15 nm, 11 nm, and 23 nm for 1z (ZnFe2O4), 2z (Ni0.25Zn0.75Fe2O5), 3z (Ni0.5Zn0.5Fe2O4), and 4z (Ni0.75Zn0.25Fe2O4) respectively. Further discussion on crystallite size is given under ESI.† The FESEM images show almost uniform spherical nanoparticles (Fig. 1B). EDS surface elemental analysis done at different positions on all the samples indicates consistency with the starting stoichiometric ratio, further confirmed by the overall mapping associated with the concentration of Zn2+ and Ni2+ as shown in Fig. 1C and D.
Fig. 1. Characterization results. (A) X-ray diffractogram, (B) FESEM images, (C) EDS mapping and (D) compositional analysis of NixZn1−xFe2O4 (x = 0.0, 0.25, 0.5, 0.75) nanoparticles.
The true value of the lattice parameter (ao) of each sample was calculated by extrapolating Nelson–Riley function f(θ) given by eqn (1) (see Fig. S3†), and the information on lattice strain (ε) and crystallite size (DWH) (Table S1†) was determined from Williamson–Hall (W–H) equation (eqn (2)).14
 |
1 |
 |
2 |
Fig. 2 shows the variation of the crystallite size as well as the lattice parameter and lattice strain, which is induced by the substitution of Ni2+ ions (0.055 nm) and interaction of surface ions with the adsorbed coating agent (CTAB). The lattice parameter is found to vary correspondingly with the crystallite size as shown in Fig. 2a and b. At the same time, lattice strain in Fig. 2c, which is a measure of the distribution of lattice constants, such as lattice dislocations, that arises from crystal imperfections, also appears to have some influence towards the lattice parameters. Increase in strain increases the lattice parameter and thereby the crystallite size as seen in 2z, although this trend disappears in the well crystallized sample 4z. It is possible that the presence of some impure phases (observed in 1z, 2z, and 3z) induces lattice strain in the crystal structure. In addition, the larger surface area in smaller nanoparticles of 1z, 2z and 3z induces greater degree of surface ion interactions with the capping ligands of CTAB, which resulted in increase/decrease of strain in the lattice system.15
Fig. 2. (a) Crystallite size, (b) lattice parameter and (c) lattice strain of NixZn1−xFe2O4 nanoparticles.
The intrinsic vibration of the cations and binding of CTAB to the nanoparticles were investigated by FTIR analysis as shown in Fig. S4.† The vibrational frequency of spinel ferrite depends on the distance of cations and oxygen, the mass of cations and bonding forces.16 The band observed at about 556 cm−1 represents the stretching vibration at the tetrahedral site, where a slight peak shift is observed with increasing Ni2+ ions. Force constant at the tetrahedral site (ktet) was calculated using a method suggested by Waldron,17 whose simplified form is given by:
| ktet = 7.62 × (Mtet × ν2 × 10⁻⁷)N/m | 3 |
where, Mtet is the molecular weight of cations on the tetrahedral site, ν (cm−1) is the vibrational frequency of Me–O bond. The value of ktet increases with decreasing Zn2+ ions concentration (discussed later in Table 1) indicating reduction in the (Me–O)tet bond length.16 The assignment of various bands in the FTIR analysis can be found under ESI.†
Crystallite size of NixZn1−xFe2O4 nanoparticles, cation distribution between the tetrahedral (A-site) and octahedral (B-site) sites, saturation magnetization (Ms) and its coercivity (Hc) at 300 K and 5 K.
| Sample name | K tet (N m−1) | Cation distribution | Mean ion radii | M s (emu g−1) | D max (nm) | t cant (nm) | K eff (×104) (J m−3) | ||
|---|---|---|---|---|---|---|---|---|---|
| A-site | B-site | r tet (Å) | r oct (Å) | 300 K | |||||
| 1z (ZnFe2O4) | 2.9 × 10² | Zn0.87Fe0.13O4 | Zn0.13Fe1.87O4 | 0.58 | 0.49 | 9 | — | — | 12 |
| 2z (Ni0.25Zn0.75Fe2O4) | 4.5 × 10² | Ni0.15Zn0.54Fe0.31O4 | Ni0.1Zn0.21Fe1.46O4 | 0.55 | 0.49 | 37 | 4.6 | 1.5 | 22 |
| 3z (Ni0.5Zn0.5Fe2O4) | 4.7 × 10² | Ni0.06Zn0.25Fe0.68O4 | Ni0.44Zn0.25Fe1.32O4 | 0.51 | 0.51 | 38 | 4.8 | 1.7 | 19 |
| 4z (Ni0.75Zn0.25Fe2O4) | 4.8 × 10² | Ni0.16Zn0.13Fe0.71O4 | Ni0.54Zn0.12Fe1.29O4 | 0.51 | 0.50 | 53 | 6.0 | 1.0 | 12 |
The spinel structure with the space group Fd3̄m exhibits five Raman active modes, namely A1g, Eg, and three T2g owing to the symmetric and asymmetric bending or stretching of oxygen ions with the metal ions. Room-temperature Raman spectra of all the samples with their modes are shown in Fig. S5,† and the individual Raman modes for all the samples are tabulated in Table S2.† The A1g peak represents the symmetric stretch in the A-sites, wherein different metal–oxygen stretches appear at different wavenumbers due to their mass difference. Broadening of the A1g peak indicates the occurrence of multiple cations in the A-site. For example, Nakagomi et al. claimed that lighter ions (Fe3+ in our case) respond at higher wavenumber and heavier ions (Ni2+, Zn2+) respond at lower wavenumber.18 The A1g peaks of all the samples were deconvoluted by fitting them with individual Lorentzian components to identify the cation occupancy in the A-site. Since the A1g Raman mode is associated with the stretching vibration of the ion species in the A-site, the integrated intensity of A1g mode is then proportional to the NiA, FeA, and ZnA content in the A-site, respectively.19 The cation redistribution between the A- and B-sites was estimated from the area under the deconvoluted peaks (Table 1).
The substitution of Ni2+ ions, which has a marked preference for the octahedral (B-site) environment, induces redistribution of cations between the A- and B- sites. A normal spinel ZnFe2O4 is also seen to have deviated from a normal equilibrium spinel system to a mixed spinel system. The incorporation of Ni2+ ions induces ‘partial’ migration of B-site Fe3+ ions to A-site while at the same time a fraction of Zn2+ ions has also migrated to B-site against their chemical preference. However, a majority of Fe3+ along with Ni2+ are found occupying their preferred B-site. Using the cation distribution data, the mean ionic radius of the tetrahedral site (rtet) and octahedral site (roct) was calculated using the following equation:20
 |
4 |
 |
5 |
where, Ctet and Coct are the ionic concentrations at A and B sites, and r is the Shannon's ionic radius. The calculated values of the mean ionic radius are given in Table 1. The roct remains almost constant while rtet decreases with increasing x, confirming that incorporation of Ni2+ ions induces the re-distribution of cations leading to contraction of A-site. The decreasing rtet corresponds well with the increasing ktet observed in the FTIR study. The observed behaviour produces a significant effect on the saturation magnetization and magnetocrystalline anisotropy constant, which in turn would dictate the heating efficiency of the nanoparticle (discussed in the next section).
Magnetic characterization
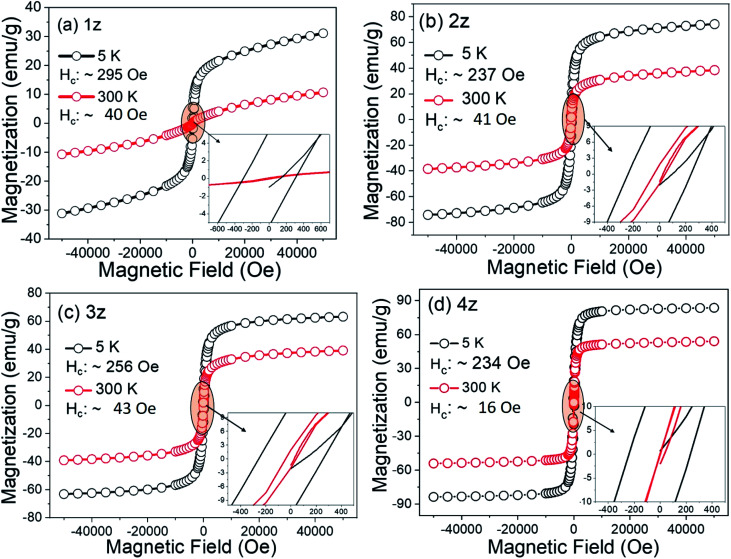
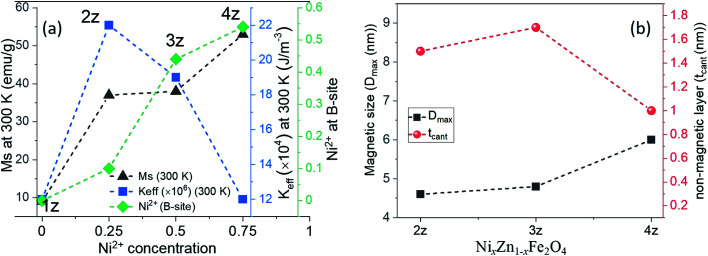
The M–H curves for the four NixZn1−xFe2O4 samples at 300 K and 5 K are shown in Fig. 3. The coercivity (Hc) of all the samples at room temperature (300 K) is <50 Oe (Fig. S6†), indicative of the soft magnetic behaviour of the nanoparticles. The saturation magnetization (Ms) is found to increase with increasing concentration of Ni2+ ions, which further induces greater % of Ni2+ ions towards their favourable B-site (Fig. 4a). This is in agreement with the cation distribution where majority of Fe3+ (5 μB) and Ni2+ (2 μB) are located in B-site resulting in an increase in the net magnetic moment M = MB-site − MA-site. Also, decreasing non-magnetic ions (Zn2+ (0.074 nm)) in the lattice system and reduction in (Me–O) bond length enhances the super-exchange FeA–O–FeB and NiA–O–NiB interaction. The influence of some impure phase and surface spin disorder with the adsorption of CTAB ions could also have minor contributions towards the lower Ms values observed in 1z, 2z, and 3z.
Fig. 3. Magnetization curves of CTAB-coated NixZn1−xFe2O4 nanoparticles at 300 K and 5 K with their coercive field in the inset.
Fig. 4. (a) Saturation magnetization of NixZn1−xFe2O4 nanoparticles at 300 K and 5 K, effective anisotropy, and inversion (Ni2+ at B-site) with respect to Ni2+ concentration. (b) The interrelation of magnetic size (Dmax, nm) and non-magnetic layer (tcant, nm).
An upturn magnetization at low temperature (5 K) deviates from the modified Bloch's law, where an exponential decay of the saturation magnetization at low temperature is expected.21 Similar result was also observed by Maaz et al.22 and Mandal et al.,23 (for <50 K) which was attributed to the effect of surface spin shell moments and quantization of spin-waves spectrum as a result of finite size. The hike in Hc value (<50 Oe @ 300 K to ∼230–290 Oe @ 5 K) is driven by the surface spin freezing effect, where the magnetic moments are frozen into anisotropic directions at low temperature. For particles small enough with high surface-to-volume ratio, the inter-particle surface-interaction (among the canted spins) can become quite effective resulting in magnetic hardening or augmentation of Hc, and such kind of interactions are rather weak, therefore it occurs only at very low temperature.24 However, the coercive field (Hc) in our samples is not significantly high to retain the spin moments unsaturated. At about 10 kOe, the magnetization of these nanocrystals is already close to the saturation point, which further confirms the very soft magnetic nature of the nanoparticles. In this sense, the freezing temperature of all the samples is <5 K. It is also noted that μoH of about 5 kOe (for 300 K) to ∼10 kOe (for low temperature) is sufficient to magnetize these NixZn1−xFe2O4 samples. These features closely delineate the characteristic of superparamagnetic nanoparticles, which is ideal for hyperthermia application.
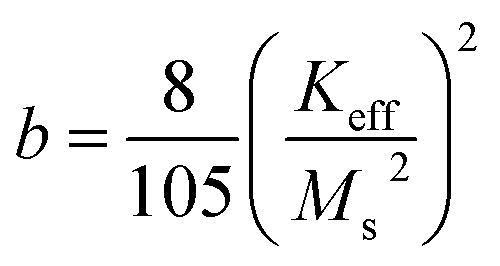
The generation of heat has a marked dependency on the anisotropic energy of the nanoparticles, therefore the effective magnetic anisotropy of these nanoparticles was determined by fitting the experimental M–H data at the high field using the law of approach to saturation magnetization.25
 |
6 |
 |
6a |
where, the term a/H takes into account of the microstructural defects in the system, and non-magnetic (if any), c is associated with the magnetic susceptibility in high applied magnetic field and b/H2 corresponds to the magnetic anisotropy of the material, where the Keff was calculated using eqn (6a) (tabulated in Table 1). Since the cationic distribution in all the samples deviates significantly from their bulk counterpart, the contribution of the a/H factor is found to be non-negligible for a good fit. The effect of cation distribution with the substitution of Ni2+ is shown in Fig. 4a. Keff value decreases with increasing Ms and Ni2+ concentration in B-site. As mentioned earlier, according to ligand field theory, π-acceptor such as CTAB results in large crystal field splitting energy of d-orbital energy level of transition metal ions. Rakshit et al.26 reported that enhanced π-acceptor ligand–metal interaction favors the quenching of orbital magnetic moment of 3d-transition metals ions more and subsequently reduces its spin orbit coupling, thereby reducing their magnetocrystalline energy. In our case, Zn2+ (d0) and Fe3+ (d5) have zero CSFE; therefore, the observed decrease in magnetic anisotropy with increasing Ni2+ ions must have resulted mostly from the increasing interaction of Ni2+ (d8) with the CTAB ligands. In addition, there is a plausible presence of asymmetric local structure inside the symmetric and cubic spinel system in samples 2z and 3z, as the cationic distribution deviates far from its equilibrium positions. The presence of ZnO as some impure phase could also affect such local symmetric structure of the nanoparticles. This could also result in a greater effective magnetocrystalline anisotropy. The Keff value of 1z (ZnFe2O4) is unreliable and hence neglected as the M–H curve is not well saturated. This could be due to the high surface spin disorder or a fraction of antiferromagnetic ordering in the system. It is also highly plausible that the presence of impure phases (ZnO and Fe2O3) in the crystal system induces structural changes or distortion, thereby affecting the magnetic behaviour of ZnFe2O4 nanoparticles.
To confirm the presence of surface spin disorder in our focused samples (2z, 3z, and 4z), the average magnetic size was first estimated from the slope of the magnetization near zero field using the following relation:27
 |
7 |
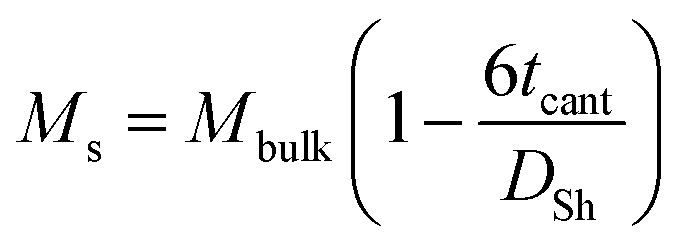
where k = Boltzmann constant, T = temperature (300 K), dM/dH = the slope near zero field, and ρ is the density of the material. The magnetic sizes calculated (Dmax) are consistently smaller compared to those from Scherrer's (Dsh), justifying the presence of magnetically inactive layer at the surface of the nanoparticles. The thickness of the non-magnetic layer (tcant @ 300 K) constituting canted spins was determined using the relation:28
 |
8 |
where Mbulk is the bulk net magnetization and Dsh is the average particle size. The approximated value of the thickness is given in Table 1. According to the ‘‘dead-layer’’ hypothesis, as the particle size decreases, the contribution of the dead layer should increase.29Fig. 4b shows the correlation between tcant and Dmax obeying the hypothesis. This also reflects the intensity of the interaction of surface ions with the CTAB ions and more so with increasing Ni2+ concentration. The influence towards the magnetic performance of the nanoparticles and thereby its heat generating properties are discussed in the next section.
Induction heating study
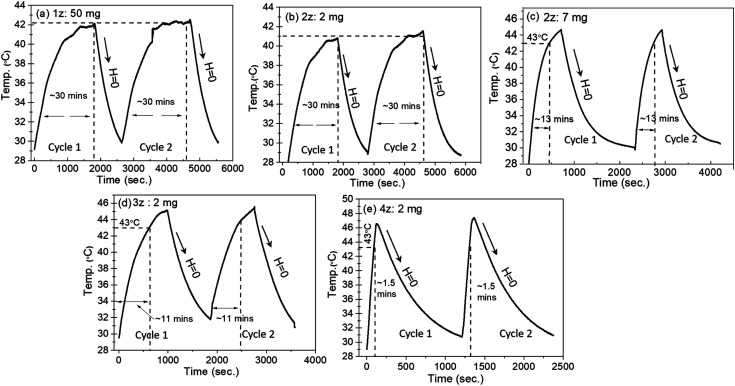
To study the heating efficiency of the synthesized nanoparticles for hyperthermia application, the temperature response with respect to time was measured with minimum nanoparticle concentrations (2 mg ml−1) for each sample at a standard frequency of f = 337 kHz and an applied field amplitude of H = 14.98 kA m−1 (188 Oe) as shown in Fig. 5. For an effective in vivo administration, the magnetic nanoparticles need to generate maximum heat at minimal nanoparticle concentration in a physiologically tolerable range of magnetic fields and amplitudes. The human tolerable range of frequency and amplitude are considered to be f < 1.2 MHz and H < 15 kA m−1 respectively, with their product C = Hf not exceeding ∼5 × 10⁹ A m−1 s−1.30 The calculated value of C for our experiment is 5 × 10⁹ A m−1 s−1, thus fulfilling an important requirement for the magnetic field amplitude and frequency. In addition, there is an optimum applied frequency associated with anisotropy energy barrier. If the frequency is too high, then it would leave an insufficient time for the magnetic moment to crossover the energy barrier resulting in ‘zero’ energy dissipation. Our previous work on heat dissipation indicates highest efficiency for spin moment fluctuation and hence effective heat generation lies at f = 337 kHz and H = 14.98 kA m−1.31 Many of the specific absorption rate (SAR) values previously reported in the literature for magnetic NPs were measured at frequencies between 500 and 700 kHz and fields between 10 and 30 kA m−1, resulting in Hf factors largely above the human tolerance limit.32
Fig. 5. Time dependent temperature variation of CTAB-coated NixZn1−xFe2O4 nanoparticles tested at a minimal nanoparticle concentration of 2 mg ml−1. Sample 1z could never attain the threshold temperature even at 50 mg ml−1, therefore nanoparticle concentration < 50 mg ml−1 is not shown.
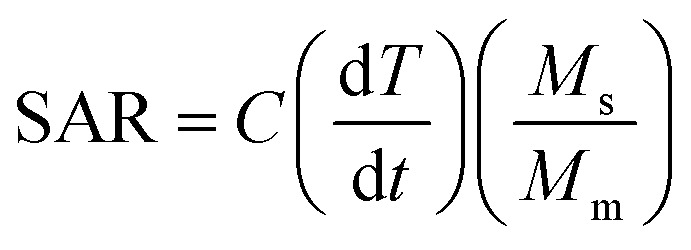
The most commonly quoted measure for magnetic heating ability of MNPs, the specific absorption rate, is defined as the heating power generated per unit mass (W g−1).33
 |
9 |
where C is the sample specific heat capacity (4.186 J g−1 °C−1 for water), (dT/dt) is the initial slope of the time-dependent temperature curve, ms is the mass of suspension and mm is the mass of the magnetic material in suspension. The specific absorption rate was quantified here by approximating the slope of the initial heat rise (dT/dt) since the initial slope of the curve (proportional to the heat dissipation rate) is assumed to have negligible losses. Two cycles of induction heating curves for all the samples were taken to test the consistency of the initial heat rise of the nanoparticles. Upon removal of the magnetic field (H = 0), the temperature of the nanoparticles fell back to the initial temperature taking about 15 minutes. We propose that such low field dependent nanoparticles with abrupt rise (with H) and fall (H = 0), especially sample 4z, would be useful for a non-invasive ‘short-time’ hyperthermia treatment by activating and deactivating the applied field and frequency at the effective temperature.
The magnetic induction heating of ferrite materials originates from their power loss in alternating magnetic field. Hysteresis loss and relaxation losses (neglecting eddy current loss) are the main contributors for the SAR in magnetic nanoparticles. Hysteresis loss occurs due to the irreversible magnetization in AC magnetic field, where reorientation is facile and domain wall displacement is responsible for the heat production. As particle size decreases, relaxation losses become dominant: (i) Neel relaxation occurs due to the spin of the magnetic moment (usually for size range of ≤15 nm) and (ii) Brownian relaxation is the shear stress induced by whole rotation of the particle in the surrounding fluid producing thermal energy.34 The time dependent temperature variation shows consistency in all the samples in both the cycles (Fig. 5), and the time taken to attain the threshold temperature (Tth: 43 °C) varies with x (i.e. Ni2+ and Zn2+ concentration) leading to variation of SAR values as tabulated in Table 2. Samples 3z and 4z could easily attain the threshold temperature at the minimal concentration of 2 mg ml−1, and 2z with 7 mg ml−1 in a time span of <15 min, whereas 1z could not reach the target even at the maximum nanoparticle concentration of 50 mg ml−1. The inability of the 1z sample to attain the required hyperthermic temperature is due to its low Ms and Keff value i.e. insufficient thermal energy dissipation. For sample 2z–4z, since Keff × volume ≈ ΔE (energy barrier) as illustrated in Fig. 6, the fluctuation of magnetic moment under the applied field and frequency is dependent on the energy barrier of the respective nanoparticles. Considering the soft magnetic characteristics of our nanoparticles with coercivity of <50 Oe and average magnetic sizes of <10 nm, and the finite size effect observed at 5 K, Neel relaxation mechanism (or Neel and Brownian simultaneously) is most likely the “dominant” source of heat generation.35 However, considering some particle size distributions, superposition of Neel relaxation and hysteresis losses cannot be ruled out in the generation of heat.
Specific absorption rate (SAR in W g−1) and time taken to reach the threshold temperature (Tth: 43 °C) by NixZn1−xFe2O4 nanoparticles.
| C = Hf = 5 × 10⁹ A m−1 s−1 (human tolerable range) | |||||
|---|---|---|---|---|---|
| 1z (x: 0.0) | 2z (x: 0.25) | 3z (x: 0.5) | 4z (x: 0.75) | ||
| NP conc. | 50 mg ml−1 (<50 mg ml−1 not shown) | 2 mg ml−1 | 7 mg ml−1 | 2 mg ml−1 | 2 mg ml−1 |
| Time taken to reach Tth | Unable to reach even after 30 min | Unable to reach within 30 min | 13 min | 11 min | 1.5 min |
| SAR (W g−1) | — | — | 19 | 75 | 347 |
| ILP (nH m2 kg−1) | — | — | 0.25 | 0.99 | 4.6 |
Fig. 6. Schematic representation of the correlation of anisotropy energy barrier (ΔE) with the specific absorption rate (SAR) and their magnetic size (Dmag) and surface spin disorder layer thickness (tcant).
The time taken to reach Tth gradually decreases with increasing concentration of Ni2+ ions. This shows a profound correlation of SAR with the saturation magnetization and the magnetic anisotropy energy. To ensure the reliability of our SAR measurement, a system-independent parameter called the intrinsic loss power (ILP) introduced by Pankhurst et al. was used:36
 |
10 |
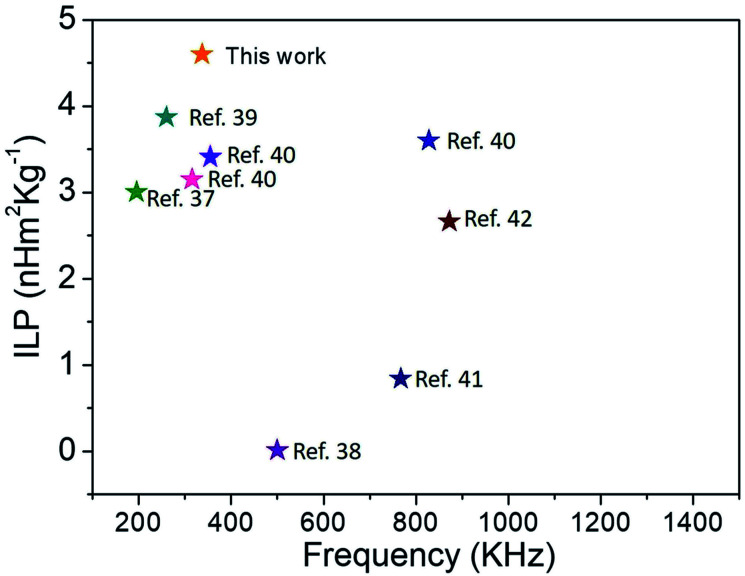
where, H is the applied field strength and f is the frequency. The ILP representation, however, is only applicable at low field strengths and low-frequency AC excitation. The ILP values are tabulated in Table 2. The ILP obtained for the 4z sample here is much greater compared to various reported values in the literature as shown in Fig. 7.37–42 Typical ILP values suitable for heating are in the range from 3 to 4 nH m2 kg−1, and therefore, our results indicate that the synthesized nanoparticles here have high efficiency as heating agents. The high values of SAR (347 W g−1) and ILP (4.6 nH m2 kg−1) in the case of 4z can be explained as a direct consequence of well crystallized nanoparticle with high saturation magnetization22 and easy Neel relaxation to dissipate reasonable amount of energy under the applied field and frequency as shown in Fig. 6.
Fig. 7. Comparison of our results with reported values in the literature: intrinsic loss power vs. frequency.
Conclusions
We have investigated the effect of structural and magnetic properties on heat generation in CTAB-NixZn1−xFe2O4 magnetic nanoparticles of different stoichiometric ratios. The substitution of Ni2+ ions with Zn2+ induces distribution of cations deviating from its equilibrium position in the crystal lattice. The samples exhibit a very soft magnetic characteristic (Hc < 50 Oe) with enhanced saturation magnetization as Ni2+ concentration increases. For samples Ni0.25Zn0.75Fe2O4 and Ni0.5Zn0.5Fe2O4, the effect of non-equilibrium cation distribution and the presence of some minor impure phase give rise to a high magnetocrystalline anisotropy, while it reduces in sample Ni0.75Zn0.25Fe2O4. A monotonic increase in the value of SAR and ILP (19 to 347 W g−1, and from 0.25 to 4.5 nH m2 kg−1) is posited to have resulted from a Neel relaxation mechanism determined by the respective anisotropy energy of the nanoparticles. This establishes the intimate association between the chemical composition, cation re-distribution, saturation magnetization, magnetic anisotropy and generation of heat. Under the suggested limit of C = Hf not exceeding ∼5 × 10⁹ A m−1 s−1, our magnetic nanoparticles particularly Ni0.75Zn0.25Fe2O4 show efficient and effective response to the desired temperature (43 °C) with minimal nanoparticle concentration. This study gives a clear perspective of the tunability of structural and magnetic parameters of a nanoparticle for their optimum performance as heat generating hyperthermic agent. Further studies of in vivo biocompatibility and toxicity are still required prior to the use of these magnetic nanoparticles.
Author contributions
RDRK designed and performed the experiments, PS and JPB contributed to the analysis and all authors contributed to manuscript preparation.
Conflicts of interest
The authors declare no competing financial interest.
Supplementary Material
Acknowledgments
We would like to thank the Micro and Nano Characterization Facility (MNCF), Centre for Nanoscience and Engineering (CeNSE), Indian Institute of Science for the use of their characterization facilities.
Electronic supplementary information (ESI) available. See DOI: 10.1039/d1na00153a
References
- Fayazzadeh S. Khodaei M. Arani M. Mahdavi S. R. Nizamov T. Majouga A. J. Supercond. Novel Magn. 2020;33:2227–2233. doi: 10.1007/s10948-020-05490-6. [DOI] [Google Scholar]
- Sharifi I. Shokrollahi H. Amiri S. J. Magn. Magn. Mater. 2012;324:903–915. doi: 10.1016/j.jmmm.2011.10.017. [DOI] [Google Scholar]
- Lu X. Liang G. Sun Q. Yang C. Mater. Lett. 2011;65:674–676. doi: 10.1016/j.matlet.2010.11.066. [DOI] [Google Scholar]
- Andersen H. L. Saura-Múzquiz M. Granados-Miralles C. Canévet E. Lock N. Christensen M. Nanoscale. 2018;10:14902–14914. doi: 10.1039/C8NR01534A. [DOI] [PubMed] [Google Scholar]
- Blanco-Gutiérrez V. Torralvo-Fernández M. J. Sáez-Puche R. J. Phys. Chem. C. 2010;114:1789–1795. doi: 10.1021/jp908395v. [DOI] [Google Scholar]
- Chinnasamy C. N. Narayanasamy A. Ponpandian N. Chattopadhyay K. Shinoda K. Jeyadevan B. Tohji K. Nakatsuka K. Furubayashi T. Nakatani I. Phys. Rev. B: Condens. Matter Mater. Phys. 2001;63:2–7. doi: 10.1103/PhysRevB.63.184108. [DOI] [Google Scholar]
- Blanco-Gutiérrez V. Urones-Garrote E. Torralvo-Fernández M. J. Sáez-Puche R. Chem. Mater. 2010;22:6130–6137. doi: 10.1021/cm101741n. [DOI] [Google Scholar]
- Dalal M. Mallick A. Mahapatra A. S. Mitra A. Das A. Das D. Chakrabarti P. K. Mater. Res. Bull. 2016;76:389–401. doi: 10.1016/j.materresbull.2015.12.028. [DOI] [Google Scholar]
- Kavas H. Baykal A. Toprak M. S. Köseoǧlu Y. Sertkol M. Aktaş B. J. Alloys Compd. 2009;479:49–55. doi: 10.1016/j.jallcom.2009.01.014. [DOI] [Google Scholar]
- Vadivel M. Babu R. R. Ramamurthi K. Arivanandhan M. Ceram. Int. 2016;42:19320–19328. doi: 10.1016/j.ceramint.2016.09.101. [DOI] [Google Scholar]
- Lu A. H. Salabas E. L. Schüth F. Angew. Chem., Int. Ed. 2007;46:1222–1244. doi: 10.1002/anie.200602866. [DOI] [PubMed] [Google Scholar]
- Nurul Ulya H. Taufiq A. Sunaryono S. IOP Conf. Ser. Earth Environ. Sci. 2019 [Google Scholar]
- Halikia I. Milona E. Can. Metall. Q. 1994;33:99–109. doi: 10.1179/cmq.1994.33.2.99. [DOI] [Google Scholar]
- Kumar G. Kotnala R. K. Shah J. Kumar V. Kumar A. Dhiman P. Singh M. Phys. Chem. Chem. Phys. 2017;19:16669–16680. doi: 10.1039/C7CP01993A. [DOI] [PubMed] [Google Scholar]
- Kumar L. Kumar P. Narayan A. Kar M. Int. Nano Lett. 2013;3:1–12. doi: 10.1186/2228-5326-3-1. [DOI] [Google Scholar]
- Ojha V. H. Kant K. M. Phys. B. 2019;567:87–94. doi: 10.1016/j.physb.2019.04.035. [DOI] [Google Scholar]
- Waldron R. D. Phys. Rev. 1955;99:1727–1735. doi: 10.1103/PhysRev.99.1727. [DOI] [Google Scholar]
- Nakagomi F. Silva S. W. Garg V. K. Oliveira A. C. Morais P. C. Franco Jr A. J. Solid State Chem. 2009;182:2423–2429. doi: 10.1016/j.jssc.2009.06.036. [DOI] [Google Scholar]
- da Silva S. W. Nakagomi F. Silva M. S. Franco A. Garg V. K. Oliveira A. C. Morais P. C. J. Nanopart. Res. 2012;14:798. doi: 10.1007/s11051-012-0798-4. [DOI] [Google Scholar]
- Satalkar M. Kane S. N. J. Phys.: Conf. Ser. 2016;755(1):01250. [Google Scholar]
- Shendruk T. N. Desautels R. D. Southern B. W. Van Lierop J. Nanotechnology. 2007;18(45):455704. doi: 10.1088/0957-4484/18/45/455704. [DOI] [Google Scholar]
- Maaz K. Mumtaz A. Hasanain S. K. Bertino M. F. J. Magn. Magn. Maters. 2010;322(15):2199–2202. doi: 10.1016/j.jmmm.2010.02.010. [DOI] [Google Scholar]
- Mandal K. Mitra S. P. Anil K. Europhys. Lett. 2006;75(4):618–623. doi: 10.1209/epl/i2006-10148-y. [DOI] [Google Scholar]
- Vázquez-Vázquez C. López-Quintela M. A. Buján-Núñez M. C. Rivas J. J. Nanopart. Res. 2011;13:1663–1676. doi: 10.1007/s11051-010-9920-7. [DOI] [Google Scholar]
- Devi E. C. Soibam I. J. Alloys Compd. 2019;772:920–924. doi: 10.1016/j.jallcom.2018.09.160. [DOI] [Google Scholar]
- Rakshit R. Mandal M. Pal M. Mandal K. Appl. Phys. Lett. 2014;104(9):092412. doi: 10.1063/1.4867706. [DOI] [Google Scholar]
- Micelles R. Seip C. T. Carpenter E. E. O'Connor C. J. John V. T. Li S. IEEE Trans. Magn. 1998;34:1111–1113. doi: 10.1109/20.706388. [DOI] [Google Scholar]
- Blanco-Gutierrez V. Saez-Puche R. Torralvo-Fernandez M. J. J. Mater. Chem. 2012;22:2992–3003. doi: 10.1039/C1JM14856G. [DOI] [Google Scholar]
- Naughton B. T. Clarke D. R. J. Am. Ceram. Soc. 2007;90:3541–3546. doi: 10.1111/j.1551-2916.2007.01980.x. [DOI] [Google Scholar]
- Bae S. Sang Won L. Takemura Y. Yamashita E. Kunisaki J. Zurn S. Chul Sung K. IEEE Trans. Magn. 2016;42(10):3566–3588. [Google Scholar]
- Raland R. D. Borah J. P. J. Phys. D: Appl. Phys. 2017;50:aa4e9a. [Google Scholar]
- Mérida F. Chiu-Lam A. Bohórquez A. C. Maldonado-Camargo L. Pérez M.-E. Pericchi L. Torres-Lugo M. Rinaldi C. J. Magn. Magn. Mater. 2015;394:361–371. doi: 10.1016/j.jmmm.2015.06.076. [DOI] [PMC free article] [PubMed] [Google Scholar]
- Wildeboer R. R. Southern P. Pankhurst Q. A. J. Phys. D: Appl. Phys. 2014;47(49):495003. doi: 10.1088/0022-3727/47/49/495003. [DOI] [Google Scholar]
- Dennis C. L. Ivkov R. Int. J. Hyperthermia. 2013;29:715–729. doi: 10.3109/02656736.2013.836758. [DOI] [PubMed] [Google Scholar]
- Deatsch A. E. Evans B. A. J. Magn. Magn. Mater. 2014;354:163–172. doi: 10.1016/j.jmmm.2013.11.006. [DOI] [Google Scholar]
- Kallumadil M. Tada M. Nakagawa T. Abe M. Southern P. Pankhurst Q. A. J. Magn. Magn. Mater. 2009;321:1509–1513. doi: 10.1016/j.jmmm.2009.02.075. [DOI] [Google Scholar]
- Demirci Dönmez C. E. Manna P. K. Nickel R. Aktürk S. Van Lierop J. ACS Appl. Mater. Interfaces. 2019;11:6858–6866. doi: 10.1021/acsami.8b22600. [DOI] [PubMed] [Google Scholar]
- Verde E. L. Landi G. T. Carrião M. S. Drummond A. L. Gomes J. A. Vieira E. D. Sousa M. H. Bakuzis A. F. AIP Adv. 2012;2:1–23. [Google Scholar]
- Iqbal Y. Bae H. Rhee I. Hong S. J. Korean Phys. Soc. 2016;68:587–592. doi: 10.3938/jkps.68.587. [DOI] [Google Scholar]
- Márquez G. Sagredo V. Guillén-Guillén R. IEEE Trans. Magn. 2019;55(12):5400207. [Google Scholar]
- Stefanou G. Sakellari D. Simeonidis K. Kalabaliki T. Angelakeris M. Dendrinou-Samara C. Kalogirou O. IEEE Trans. Magn. 2014;50:1–7. [Google Scholar]
- Lasheras X., Insausti M., Gil De Muro I., Garaio E., Plazaola F., Moros M., De Matteis L., De La Fuente J. M. and Lezama L., Chemical Synthesis and Magnetic Properties of Monodisperse Nickel Ferrite Nanoparticles for Biomedical Applications, 2016, vol. 120 [Google Scholar]
Associated Data
This section collects any data citations, data availability statements, or supplementary materials included in this article.


