Abstract
Silver nanoparticles (AgNPs) have attracted enormous interest because of their excellent antibacterial properties, low cytotoxicity and limited evidence for resistance. As a general trend, smaller nanoparticles are considered to have stronger antibacterial activity. In this work we investigate whether this trend is valid for the sub-10 nm region by designing and synthesising three types of sub-10 nm AgNPs (∼1.87, ∼2.93 and ∼6.53 nm) to reveal the influence of size, valence state and structure on the antibacterial potency of AgNPs. We found that NPs with a size of ∼2.93 nm having a high concentration of silver in the first valence state presented the highest bacterial killing potency as well as low cytotoxicity to mammalian cells. The new insights presented in this study open future avenues for the engineering of highly potent silver nanoantibiotics that can be incorporated into future advanced medical devices and therapies capable of protecting patients from infections.
The interplay between size and valence state in ∼3 nm silver nanoparticles resulted in the highest antibacterial effect against multi-drug resistant bacteria.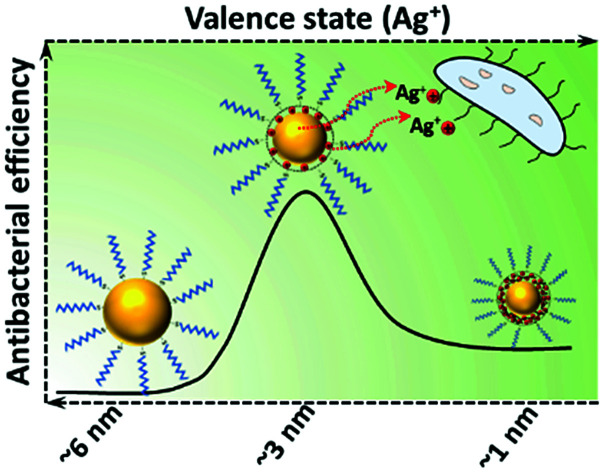
Introduction
The continuing rise of antimicrobial resistance has become one of the most significant medical challenges of our time.2 The urgent necessity to find a suitable alternative for conventional antibiotics has become the focus of extensive basic and applied research.3 In this respect, nanotechnology holds tremendous potential as demonstrated by many recent reports.4,5 Certainly, silver in the form of nanoparticles (NPs) is regarded as the benchmark nanoantibiotic due to its broad-spectrum activity, exceptionally limited cases of development of bacterial resistance and low cytotoxicity.6–9 The success of AgNPs is explained by a multifaceted mechanism of action consisting of the release of silver ions (Ag+) which bind to DNA, enzymes and other bacterial constituents, generation of reactive oxygen species (ROS) and enhancing the permeability of the bacterial membrane.10 However, several nanoscale parameters such as size, shape and surface structure are important for ensuring satisfactory antibacterial potency of AgNPs.11–13
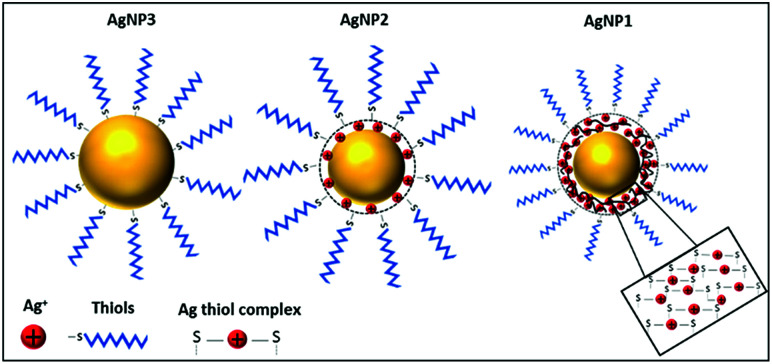
Here, we hypothesise that reduction of AgNP size below 3 nm could lead to the formation of a new class of nanoantibiotics through manipulating both the size and valence state of silver. NPs of this small size range are often termed nanoclusters (NCs). Unlike AgNPs, silver nanoclusters (AgNCs) have molecular-like properties and entirely different surface structures compared to their larger counterparts including discrete electronic transition, chirality, and photoluminescence.4,14,15 While the surface of AgNPs is dominated by reduced silver atoms and organic ligands, the NC surface consists of a layer of Ag+ ions often bound to organic ligands. For example, when thiols are used as capping ligands, the metallic core of the AgNCs is protected by Ag+–thiolate motifs (Scheme 1). The highly enriched Ag+ ion dominated surface, together with the ultra-small size and unique properties, makes AgNCs an attractive alternative to traditional AgNPs. In fact, a few recent studies suggested high antimicrobial potency of ultra-small AgNCs against a variety of microorganisms including multidrug-resistant bacteria.16,17 The transition from AgNPs to AgNCs, governed by size, leads to the evolution of different surface structures as well as new functionalities. An obvious consequence is that both the size and surface (or valence state of silver) structure would have an impact on their antibacterial properties.18 However, knowledge of the interplay between size and valence state is currently limited.
Scheme 1. Schematic illustration of the surface structure of the three different sized AgNPs.
In order to shed light on this dependence, here we developed a strategy to synthesize sub-10 nm AgNPs of three different sizes, i.e. ∼1.87, ∼2.93 and ∼6.53 nm, and studied their physicochemical properties and antibacterial potency against both Gram negative and Gram positive bacteria. The size and valence state of the purified AgNPs were verified by transmission electron microscopy (TEM) and X-ray photoelectron spectroscopy (XPS). We tested the antibacterial potency against five medically relevant bacterial strains, i.e. methicillin-resistant Staphylococcus aureus (MRSA), methicillin-susceptible Staphylococcus aureus (MSSA), Staphylococcus epidermidis, Pseudomonas aeruginosa and Escherichia coli. The trend in our antibacterial results did not corroborate the size dependency phenomena, rather it can be explained by the interplay between size and valence state.
Materials and methods
Materials
AgNO3 (99.99%), 2-mercaptosuccinic acid (MSA), sodium borohydride (NaBH4), resazurin sodium salt, nitric acid (HNO3), and sodium hydroxide (NaOH) were purchased from Sigma Aldrich. Hydrochloric acid (36%) was from Ajax Finechem Pty Ltd. For antibacterial assays, Mueller Hinton (MH) agar and broth were purchased from Oxoid. For cell viability studies, Dulbecco's Modified Eagle Medium (DMEM) and Phosphate Buffered Saline (PBS) were purchased from Gibco Life Technologies, Thermo Fisher Scientific. The other reagents used throughout the study were of analytical grade, commercially available, and used without further purification. All glassware and magnetic stirrers were soaked in aqua regia solution and then rinsed thoroughly with MilliQ water and nitrogen-dried before experiments. Ultrapure water with a resistivity of 18.2 MΩ (Millipore) was used in all studies.
Synthesis of AgNP1
1 ml of 20 mM AgNO3 was added into 7.4 ml of water under stirring. Next, 1 ml of 20 mM MSA was added to the AgNO3 solution under ice cold conditions to form Ag(i)–thiolate complexes. The mixture was stirred for 5 minutes, and then 0.6 ml of 0.05 M NaBH4 (prepared in 20% 1 M NaOH) was added into the solution under vigorous stirring. The reaction was allowed to proceed for another 2 h under stirring. The solution color changed from transparent to reddish brown, indicating the formation of small sized AgNPs (AgNP1).
Synthesis of AgNP2
For AgNP2, 1 ml of 20 mM AgNO3 and 1 ml of 20 mM MSA were first mixed in 7.7 ml of water under vigorous stirring (ice-cold conditions) to form Ag(i)–thiolate complexes. After stirring for 5 minutes, 0.3 ml of 0.05 M NaBH4 (prepared in 20% 1 M NaOH) was introduced into the reaction mixture. The reaction was allowed to continue for 24 h. The formation of AgNP2 was confirmed when the solution color changed from colorless to bright yellow.
Synthesis of AgNP3
AgNP3 was prepared following the procedure reported previously by our group,8 with slight modification. Briefly, 6 ml of 2 mM AgNO3 was mixed with 2.5 ml of 2 mM MSA under ice cold conditions. Then, 0.25 ml of 0.05 M NaBH4 added to the mixture in a dropwise manner under vigorous stirring. The solution color changed to dark brown immediately and the reaction was continued for another 24 h.
After synthesis, all three AgNPs were purified through dialysis (Pur-A-Lyzer™ Maxi Dialysis Kit; MWCO 3.5 kDa) against ultrapure water for 3 h. Finally, all the purified NPs solution were freeze dried and re-suspended in MQ water for subsequent experiments. The purified NPs were dissolved in dilute 2.8% HNO3 overnight and the silver concentration was determined by inductively coupled mass spectroscopy (Agilent 8800 Triple Quad ICP-MS).
Characterization
The optical properties of the as-prepared and purified AgNPs were characterized by using UV-vis spectroscopy (Varian Cary, USA). The primary size and morphology of AgNPs were determined by Transmission Electron Microscopy (TEM) (JEOL 3010, operating at 200 kV). TEM is used to precisely examine the core of small particles and determine their size distributions.19 Prior to TEM sample preparation, the nanoparticle solution was phase transferred to the organic phase (toluene) using acetyl trimethylammonium bromide (CTAB).20 Then a drop of AgNP suspension was placed on to the carbon coated copper grid and dried under vacuum.
XPS analysis
X-ray photoelectron spectroscopy (XPS) spectra were recorded using an AXIS Ultra DLD (Kratos Analytical, U.K.) equipped with a monochromatic Al Kα radiation source (hν, 1486.6 eV) at a power of 225 W. The elements present on the surface were identified from a survey spectrum recorded over the energy range of 0–1000 eV at a pass energy of 100 eV and a resolution of 0.5 eV. High resolution (0.1 eV) spectra were then recorded for photoelectron peaks at a pass energy of 20 eV to identify the valence states of silver. All binding energies were calibrated with respect to the aliphatic C 1s carbon peak at 285 eV. The processing and component fitting of the high-resolution spectra were performed using the latest version of CASA XPS software (version 2.3.19).
Antimicrobial activity
The antimicrobial effect of the prepared AgNPs was evaluated against both Gram negative and Gram-positive bacteria. The bacterial strains including methicillin resistant Staphylococcus aureus ATCC 19606 (MRSA), methicillin sensitive Staphylococcus aureus ATCC 25923 (MSSA), Escherichia coli 10P50, Staphylococcus epidermidis ATCC 190918 and Pseudomonas aeruginosa (PAO1) were inoculated onto Mueller Hinton (MH) Agar plates and incubated overnight at 37 °C. Individual colonies were isolated and grown overnight in MH broth and its optical density was adjusted to 0.5 McFarland standard to obtain 1 × 10⁸ colony forming units (CFU ml−1). The standard inoculum was further diluted for subsequent experiments.
Determination of the minimum inhibitory concentration (MIC)
To determine the minimum concentration to inhibit bacterial growth, the microdilution method was employed according to the guidelines of the Clinical and Laboratory Standards Institute.21,22 Briefly, MICs were determined by incubating the test organisms in 96 well flat bottom plates for 24 hours at 37 °C under aerobic conditions. After 24 h, 100 μl of MH broth was introduced into each well except the first column; the first column had the double strength MH broth to allow for 75% dilution once the AgNPs were added. An equal concentration of 100 μl AgNPs (180 μg ml−1) was added to the first column to perform 2-fold dilution across the plate. Briefly, 100 μl bacterial suspension (1 × 10⁶ CFU ml−1) was introduced into all wells except for the sterility control blank (last column). The final concentrations of AgNPs tested were from 90 to 0.7 μg ml−1. The initial absorbance was measured, and the plates were returned to the incubator at 37 °C for 18 h with moderate shaking (150 rpm). After overnight incubation the optical density was measured at 630 nm using a spectrophotometer (ELx800 Microplate Reader, BioTek, USA). A positive control consisted of wells in the absence of treatment and the negative control comprised MH broth only for sterility check. The time killing curve was obtained in the same way as the above method, except the absorbance was measured every hour using an automated ELX800 Microplate Reader at 37 °C. The MIC value of the silver solutions was determined to be the concentration corresponding to the last well in which microbial growth was not observed.
Disc diffusion assay
The disc diffusion method was performed using Mueller Hinton Agar (MHA) to measure the susceptibility of AgNPs against various common bacterial strains (bacterial strains shown above). After standardising the inoculum to 0.5 McFarland standard (1 × 10⁸ CFU ml−1), a sterile cotton swab was dipped into bacterial suspension and then spread uniformly on the agar surface. Sterilised filter paper discs (5 mm) were placed on the agar surface, then 60 μl of the AgNPs (90 μg ml−1) solution was added to the disc and incubated overnight at 37 °C and observed for the zone of inhibition after 18 hours.
Live dead assay
Bacterial cell viability was assessed using a LiveDead Baclight™ viability kit (Invitrogen, Thermo Fisher Scientific) using an Olympus FV3000 confocal laser scanning microscope (CLSM). The bacteria were grown on a 96 well plate as described in the MIC assay. Then the bacterial cells were treated with 0.5× MIC and at MIC concentrations of AgNPs and incubated overnight at 37 °C. The cells were collected and centrifuged at 6000 rpm for 5 min followed by two saline washes. The bacteria were stained with a live dead dye mixture of SYTO9 and propidium iodide (PI) using the recommended dilutions. The bacteria were incubated for 15 min before they were imaged by CLSM. Three images from triplicate experiments were taken for each sample, and the individual cells were counted using ImageJ software.
Cytotoxicity assay
To determine the cytotoxic effect of the AgNPs the conventional resazurin assay was performed. For this purpose, human foreskin fibroblasts (HFFs) were seeded in 96 well plates at a concentration of 2 × 10⁴ cells per well in 100 μl of DMEM, supplemented with 10% FBS and 5% penicillin streptomycin and incubated at 37 °C in 5% CO2 for 24 h. The cells were subsequently washed with 1× phosphate buffered saline (PBS) and incubated for 24 hours in a growth medium containing varying concentrations of AgNPs (90–0.7 μg ml−1). After 24 hours, the wells were washed with PBS and then 100 μl of 10% resazurin solution (stock 110 μg ml−1) was added into each well.8 To take into account the possible background fluorescence of the dye, the resazurin solution alone served as the negative control. The microplates were incubated for 2 h at 37 °C as described above. After 2 h of incubation, the fluorescence intensity of each well of the plate was measured using an excitation wavelength of 540 nm and the emission spectra of a 590 nm (BMG LabTech) plate reader. The percentage cell viability was calculated using the following formula. where Ftest is the fluorescence in cells exposed to the test solutions, Fblank is the fluorescence in a cell culture medium with no cells, and Fcontrol is the fluorescence in cells exposed to the cell culture medium only.
Statistical analysis
All results were expressed as mean ± SD (standard deviation) of three independent experiments. Any statistical analysis stated was performed by one-way analysis of variance (ANOVA) with the Tukey–Kramer test using GraphPad prism software (Version 7.03).
Results and discussion
The rationale for this study is depicted in Scheme 1. When the size of AgNPs is ∼1 nm (referred to as AgNP1), the molecular-like properties as well as Ag+-rich surface will be apparent. For larger AgNPs ∼6 nm and above (referred to as AgNP3), the metallic silver atoms at the surface will be protected by a monolayer of organic ligands. However, AgNPs with ∼3 nm size (referred to as AgNP2) would fall in the intermediate region, where NP-like properties such as plasmon resonance start to appear and properties of NCs diminish, and an interplay between size and valence state is expected. We choose an identical ligand, namely, 2-mercaptosuccinic acid (MSA), for the synthesis of all three NPs to rule out the possibility of any ligand effect on the antibacterial properties.
The synthesis of all three MSA protected AgNPs was accomplished by a simple one-pot chemical reduction method. Sodium borohydride (NaBH4) was used as a reducing agent. A key strategy to obtain small sized AgNPs (i.e., AgNP1 and AgNP2) was to introduce a small amount of sodium hydroxide in the NaBH4 solution during the synthesis.
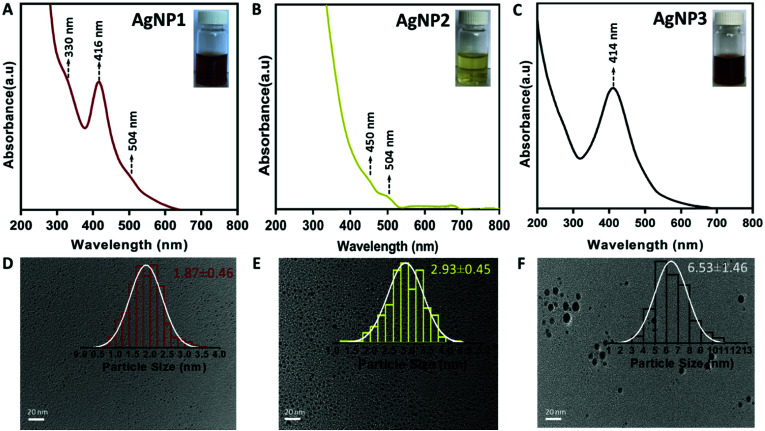
It is known that the hydrolysis of NaBH4 would be slower in a basic environment and at low temperature.1,23 Such a mild reduction environment facilitated the formation of small sized uniform AgNPs. Without sodium hydroxide, however, larger sized plasmonic AgNPs were formed (AgNP3). Following the synthesis, all three NPs were purified and characterized by various means. UV-vis absorption spectroscopy measurements were carried out to verify the optical features of the AgNPs. As shown in Fig. 1A, the UV-vis spectrum of AgNP1 displays three distinct absorption peaks at 330, 416 and 504 nm, which are similar to the characteristic molecule-like features of ultra-small NCs.24 On the other hand, AgNP3 exhibits a distinct plasmonic peak at ∼414 nm, indicating the formation of larger size NPs.21
Fig. 1. UV-vis spectra (inset: photograph) of (A) AgNP1, (B) AgNP2 and (C) AgNP3. TEM images (inset: size distribution) of (D) AgNP1, (E) AgNP2 and (F) AgNP3. Scale bar, 20 nm.
Interestingly, for AgNP2, both the characteristic plasmonic peak and the molecular-like optical features were absent in the UV-vis spectrum (Fig. 1B); rather a featureless spectrum having two small optical bands at ∼450 nm and ∼504 nm was observed. The solution of AgNP2 also displayed a light yellow color (inset, Fig. 1B), which was different from that of AgNP1 (reddish brown; inset of Fig. 1A) and AgNP3 (brown; inset of Fig. 1C). To verify the core size of these NPs, transmission electron microscopy (TEM) was carried out (Fig. 1D–F). The average size of AgNP1, AgNP2 and AgNP3 was 1.87 ± 0.46, 2.93 ± 0.45 and 6.53 ± 1.46 nm, respectively. The TEM images also confirmed the uniform size and high monodispersity of all three AgNPs. Taken together, both the UV-vis and TEM studies confirmed the formation of three different sized AgNPs, all in the sub-10 nm domain.
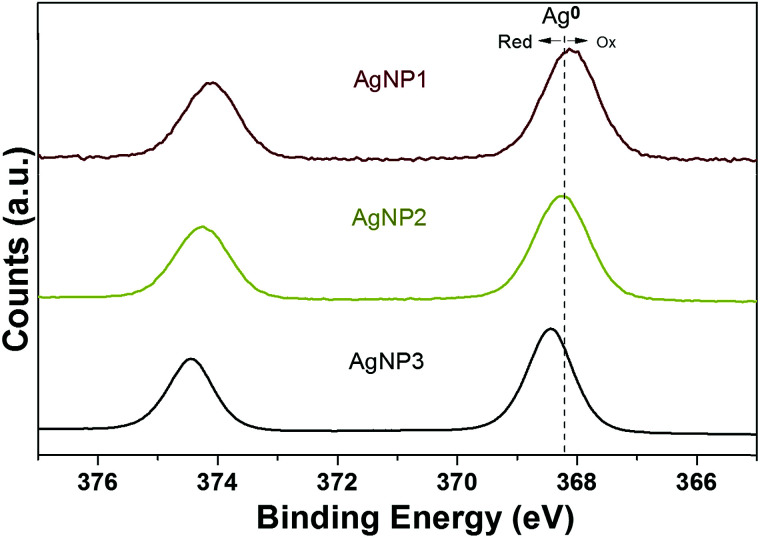
After the successful synthesis of these three distinct AgNPs with the same surface ligand, we used X-ray photoelectron spectroscopy (XPS) to analyze the valence states of silver. The binding energy peak of the Ag 3d5/2 of AgNP3 was at 368.2 eV, similar to that of metallic silver (Ag0) reported previously.25 This result indicates the presence of a high percentage of Ag0 on the surface of AgNP3. The result of XPS is also consistent with the UV-vis spectrum of AgNP3 depicting plasmon resonance band characteristics of noble metal nanoparticles. It is well established that upon oxidation the Ag 3d5/2 binding energy peak shifts to lower binding energy.26,27 In fact, as the size of NPs was reduced, the Ag 3d5/2 binding energy of AgNP1 and AgNP2 was shifted to 368.0 eV and 368.2 eV, respectively, suggesting the existence of oxidized silver (Ag+) at the particle surface (Fig. 2).
Fig. 2. Ag 3d XPS spectra of AgNP1 (red), AgNP2 (yellow) and AgNP3.
Deconvolution of the Ag 3d5/2 binding energy peak supported the spectral trends seen with reduction of particle size (Fig. S2†). AgNP1 contained the highest percentage of Ag+ (13.2%) while AgNP3 was made of almost 100% Ag0 (Table S1†). However, the XPS analysis of AgNP2 revealed an intermediate situation where the percentage of Ag0 (90.8%) was lower than in AgNP3 (98.1%) but higher than in AgNP1 (86.8%). In contrast, the percentage of Ag+ (9.2%) in AgNP2 was higher than in AgNP3 (1.9%). The data indicate an intermediate state in the case of AgNP2 which sits between NPs and NCs (also evidenced from our TEM study) and therefore, a synergy between the features of large size NPs (size-related properties) and ultra-small NCs (valence state properties) is expected.
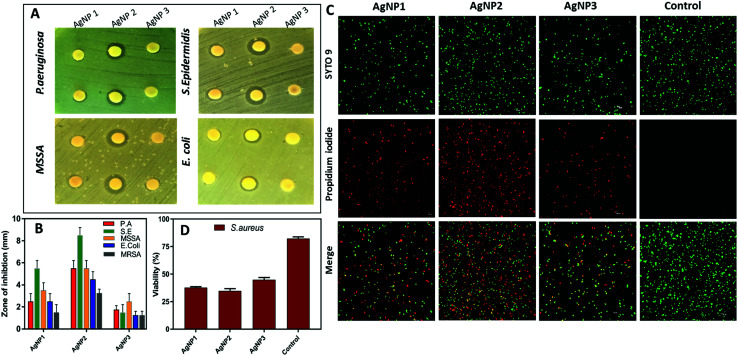
Next, the antibacterial activity of all three AgNPs was assessed against five medically relevant bacterial strains including (Gram positive) methicillin-resistant Staphylococcus aureus (MRSA), methicillin-susceptible Staphylococcus aureus (MSSA), Staphylococcus epidermidis, (Gram negative) Pseudomonas aeruginosa, and Escherichia coli. The measured zone of inhibition diameter (mm) around each disk for all AgNPs is summarized in Fig. 3A and B. As shown in Fig. 3A, significant differences were observed between these three AgNPs, where the smaller sized NPs (AgNPs 1 & 2) showed a greater zone of inhibition compared to AgNP3. In particular, AgNP2 demonstrated significantly higher antibacterial activity. Quantitatively, the zone of inhibition is presented in Fig. 3B. A significantly larger zone of inhibition diameter in the range of 3.5–9 mm was measured for AgNP2, compared to 1–6 mm for AgNP1 and 1–3 mm for AgNP3.
Fig. 3. (A) Disk diffusion assay showing the difference in inhibition of different AgNPs (90 μg ml−1) tested against P. aeruginosa, S. epidermidis, MSSA and E. coli (MRSA shown in Fig. S3†); data shown in duplicates. (B) The mean zone of inhibition diameter (mm) around the disk for all three AgNPs against P. aeruginosa, S. epidermidis, MSSA, E. coli and MRSA. (C) Qualitative evaluation of S. aureus viability based on live/dead assay verified by CLSM. (D) S. aureus viability post AgNP treatment mean ± SD, n = 3, scale bar, 10 μm.
We also determined the minimal inhibitory concentration (MIC) of the three types of AgNPs against the four medically relevant pathogens involved in this study. The results are summarized in Table 1. The range of MIC values for AgNP2 was 5.65–22.5 μg ml−1, which was lower compared to that for AgNP1 (5.65–45 μg ml−1) and AgNP3 (11.65–45 μg ml−1). These results are further supported by bacterial growth curve assays showing a dramatic inhibition of growth of S. epidermidis at 5.65 μg ml−1 AgNP1 and AgNP2 and 11.3 μg ml−1 AgNP3 (Fig. S3†). While the MIC values for all three sub-10 nm AgNPs synthesized in this study are lower compared to those for other reported AgNPs,28,29 a clear difference in the antibacterial efficacy among the three NPs was also evident. This demonstrates that the valence state of silver, in addition to the size of nanoparticles, plays an important role in defining the antibacterial properties of AgNPs.
MIC values (μg ml−1) of the three different AgNPs against the four bacterial strains.
| Samples | Minimum Inhibitory Concentration (MIC) | |||
|---|---|---|---|---|
| P. aeruginosa | S. epidermidis | E.coli | S.aureus | |
| AgNP1 | 5.65 | 5.65 | 22.5 | 45 |
| AgNP2 | 5.65 | 5.65 | 11.25 | 22.5 |
| AgNP3 | 11.25 | 11.25 | 22.5 | 45 |
We further confirmed the capacity of the AgNPs used in this study to kill bacteria by using the live/dead assay. S. aureus was used as a representative strain because of the high resistance to antimicrobials. The live/dead assay contains a green fluorescent dye, SYTO9, which can enter both live and dead bacteria and red fluorescent propidium iodide (PI) that can only enter through damaged or compromised bacterial membranes. As shown in Fig. 3C and D, a high percentage of S. aureus was positively stained with PI for AgNP1 and AgNP2 (∼60%), while half of the bacteria remain viable after the treatment with an equivalent concentration of AgNP3.
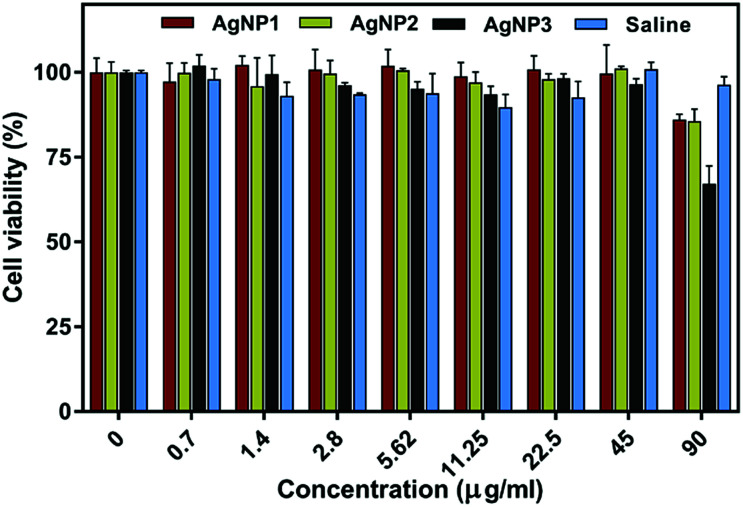
The potential cytotoxicity of the three types of NPs was studied in a culture of primary human foreskin fibroblasts (HFFs) using the resazurin assay. As shown in Fig. 4 HFFs remain metabolically active with no significant variation in cell viability (remaining above 90%) even when the cells were treated with 90 μg ml−1 AgNP1 and AgNP2. Only AgNP3 showed slightly decreased cell viability (∼70%) at 90 μg ml−1. In comparison, the MIC values for all three AgNPs against the four bacteria used in this study were much lower (in the range of 5–45 μg ml−1). Our cytotoxicity data demonstrate a good therapeutic window for effective treatment against bacteria without causing harm to mammalian cells and tissue.
Fig. 4. Effects of different concentrations of AgNPs and 0.9% saline on HFF viability after 24 h. Mean ± SD n = 3.
Remarkably, the antibacterial activity of the three types of AgNPs synthesized in this study follow neither a size-dependent trend nor can they be entirely related to the NP valence state. Rather, AgNPs with a size of ∼3 nm (AgNP2) showed the highest activity against all bacteria studied. One explanation could be that in this size regime, the surface Ag+ ions together with core Ag0 atoms of AgNP2 leach out in a more efficient manner compared to the case of larger sized AgNPs (AgNP3). In the case of ultra-small AgNPs (AgNP1), despite having a higher percentage of Ag+ ions and a smaller core, the effective release of Ag+ ions will be relatively low when compared to AgNP2 because the Ag+ exists as Ag+–thiolate motifs (see Scheme 1). These motifs are highly stable in solution and thus Ag+ from AgNP1 is only released through core leaching and therefore the concentration of these released Ag+ ions will be much lower compared to that in AgNP2. The highest antibacterial activity of AgNP2 demonstrates the importance of achieving the optimum interplay between nanoparticle size and silver valence state.
Conclusions
In summary, we designed three types of AgNPs in the sub-10 nm regime to demonstrate the influence of size, valence state and structure on the antibacterial potency of AgNPs. All AgNPs had high antibacterial activity against selected Gram negative and Gram positive medically relevant pathogens. However, nanoparticles with a size of ∼3 nm and high concentration of silver in the first valence state presented the highest bacterial killing potency. Additionally, the cytotoxicity tests with primary human cells demonstrated insignificant influence on cell viability even at concentrations significantly higher than the MIC. Our results demonstrate that the antibacterial efficacy of AgNPs is not limited to their size. It appears that the valence state of silver in the NPs may play an even more important role. This was particularly prominent for AgNP2 where the interplay between size and valence state had the most significant influence on antibacterial potency. The new insights presented in this study open future avenues for the engineering of highly potent silver nanoantibiotics that can be incorporated into future advanced medical devices and therapies capable of protecting patients from infections.
Conflicts of interest
There are no conflicts to declare.
Supplementary Material
Acknowledgments
KV thanks ARC for DP15104212, NHMRC for fellowship APP1122825 and Project grant APP1032738 and the Alexander von Humboldt Foundation for Fellowship for Experienced Researchers.
Electronic supplementary information (ESI) available. See DOI: 10.1039/c9na00017h
Notes and references
- Schlesinger H. I. Brown H. C. Hoekstra H. R. Hyde E. K. J. Am. Chem. Soc. 1953;75:215–219. doi: 10.1021/ja01097a057. [DOI] [Google Scholar]
- Brown E. D. Wright G. D. Nature. 2016;529:336–343. doi: 10.1038/nature17042. [DOI] [PubMed] [Google Scholar]
- Podolsky S. H. Palgrave Communications. 2018;4:124. doi: 10.1057/s41599-018-0181-x. [DOI] [Google Scholar]
- Zheng K. Yuan X. Goswami N. Zhang Q. Xie J. RSC Adv. 2014;4:60581–60596. doi: 10.1039/C4RA12054J. [DOI] [Google Scholar]
- Huh A. J. Kwon Y. J. J. Controlled Release. 2011;156:128–145. doi: 10.1016/j.jconrel.2011.07.002. [DOI] [PubMed] [Google Scholar]
- Rai M. Gade A. Biotechnol. Adv. 2009;27:76–83. doi: 10.1016/j.biotechadv.2008.09.002. [DOI] [PubMed] [Google Scholar]
- Vasilev K. Sah V. Anselme K. Ndi C. Mateescu M. Dollmann B. Martinek P. Ys H. Ploux L. Griesser H. J. Nano Lett. 2010;10:202–207. doi: 10.1021/nl903274q. [DOI] [PubMed] [Google Scholar]
- Taheri S. Cavallaro A. Christo S. N. Smith L. E. Majewski P. Barton M. Hayball J. D. Vasilev K. Biomaterials. 2014;35:4601–4609. doi: 10.1016/j.biomaterials.2014.02.033. [DOI] [PubMed] [Google Scholar]
- Chernousova S. Epple M. Angew. Chem., Int. Ed. 2013;52:1636–1653. doi: 10.1002/anie.201205923. [DOI] [PubMed] [Google Scholar]
- Carlson C. Hussain S. M. Schrand A. M. Braydich-Stolle L. K. Hess K. L. Jones R. L. Schlager J. J. J. Phys. Chem. B. 2008;112:13608–13619. doi: 10.1021/jp712087m. [DOI] [PubMed] [Google Scholar]
- Kim J. S. Kuk E. Yu K. N. Kim J.-H. Jeong D. H. Cho M.-H. Nanomedicine. 2007;3:95–101. doi: 10.1016/j.nano.2006.12.001. [DOI] [PubMed] [Google Scholar]
- Jose Ruben M. Jose Luis E. Alejandra C. Katherine H. Juan B. K. Jose Tapia R. Miguel Jose Y. Nanotechnology. 2005;16:2346–2353. doi: 10.1088/0957-4484/16/10/059. [DOI] [PubMed] [Google Scholar]
- Pal S. Tak Y. K. Song J. M. Appl. Environ. Microbiol. 2007;73:1712–1720. doi: 10.1128/AEM.02218-06. [DOI] [PMC free article] [PubMed] [Google Scholar]
- Cao Y. Guo J. Shi R. Waterhouse G. I. N. Pan J. Du Z. Yao Q. Wu L.-Z. Tung C.-H. Xie J. Zhang T. Nat. Commun. 2018;9:2379. doi: 10.1038/s41467-018-04837-x. [DOI] [PMC free article] [PubMed] [Google Scholar]
- Luo Z. Zheng K. Xie J. Chem. Commun. 2014;50:5143–5155. doi: 10.1039/C3CC47512C. [DOI] [PubMed] [Google Scholar]
- Yuan X. Setyawati M. I. Tan A. S. Ong C. N. Leong D. T. Xie J. NPG Asia Mater. 2013;5:e39. doi: 10.1038/am.2013.3. [DOI] [Google Scholar]
- Yuan X. Setyawati M. I. Leong D. T. Xie J. Nano Res. 2014;7:301–307. doi: 10.1007/s12274-013-0395-6. [DOI] [Google Scholar]
- Pal S. Yoon E. J. Tak Y. K. Choi E. C. Song J. M. J. Am. Chem. Soc. 2009;131:16147–16155. doi: 10.1021/ja9051125. [DOI] [PubMed] [Google Scholar]
- Feng Y. Yao Q. Li J. Goswami N. Xie J. Yang J. Nano Res. 2016;9:942–950. doi: 10.1007/s12274-015-0980-y. [DOI] [Google Scholar]
- Yuan X. Luo Z. Zhang Q. Zhang X. Zheng Y. Lee J. Y. Xie J. ACS Nano. 2011;5:8800–8808. doi: 10.1021/nn202860s. [DOI] [PubMed] [Google Scholar]
- Chowdhury N. R. MacGregor-Ramiasa M. Zilm P. Majewski P. Vasilev K. J. Colloid Interface Sci. 2016;482:151–158. doi: 10.1016/j.jcis.2016.08.003. [DOI] [PubMed] [Google Scholar]
- Mekkawy A. I. El-Mokhtar M. A. Nafady N. A. Yousef N. Hamad M. A. El-Shanawany S. M. Ibrahim E. H. Elsabahy M. Int. J. Nanomed. 2017;12:759–777. doi: 10.2147/IJN.S124294. [DOI] [PMC free article] [PubMed] [Google Scholar]
- Yuan X. Zhang B. Luo Z. Yao Q. Leong D. T. Yan N. Xie J. Angew. Chem., Int. Ed. 2014;126:4711–4715. doi: 10.1002/ange.201311177. [DOI] [PubMed] [Google Scholar]
- Bakr O. M. Amendola V. Aikens C. M. Wenseleers W. Li R. Dal Negro L. Schatz G. C. Stellacci F. Angew. Chem., Int. Ed. 2009;48:5921–5926. doi: 10.1002/anie.200900298. [DOI] [PubMed] [Google Scholar]
- Kaspar T. C. Droubay T. Chambers S. A. Bagus P. S. J. Phys. Chem. C. 2010;114:21562–21571. doi: 10.1021/jp107914e. [DOI] [Google Scholar]
- Chen T. Yang S. Chai J. Song Y. Fan J. Rao B. Sheng H. Yu H. Zhu M. Sci. Adv. 2017;3:e1700956. doi: 10.1126/sciadv.1700956. [DOI] [PMC free article] [PubMed] [Google Scholar]
- Mikhlin Y. L. Vishnyakova E. A. Romanchenko A. S. Saikova S. V. Zaikovskii V. I. Zharkov S. M. Appl. Surf. Sci. 2014;297:75–83. doi: 10.1016/j.apsusc.2014.01.081. [DOI] [Google Scholar]
- Zhou Y. Yang J. He T. Shi H. Cheng X. Lu Y. Small. 2013;9:3445–3454. doi: 10.1002/smll.201202455. [DOI] [PubMed] [Google Scholar]
- Agnihotri S. Mukherji S. Mukherji S. RSC Adv. 2014;4:3974–3983. doi: 10.1039/C3RA44507K. [DOI] [Google Scholar]
Associated Data
This section collects any data citations, data availability statements, or supplementary materials included in this article.


