
Fig. 1. DNA binding to cGAS induces the formation of liquid-like droplets in which cGAS is activated.
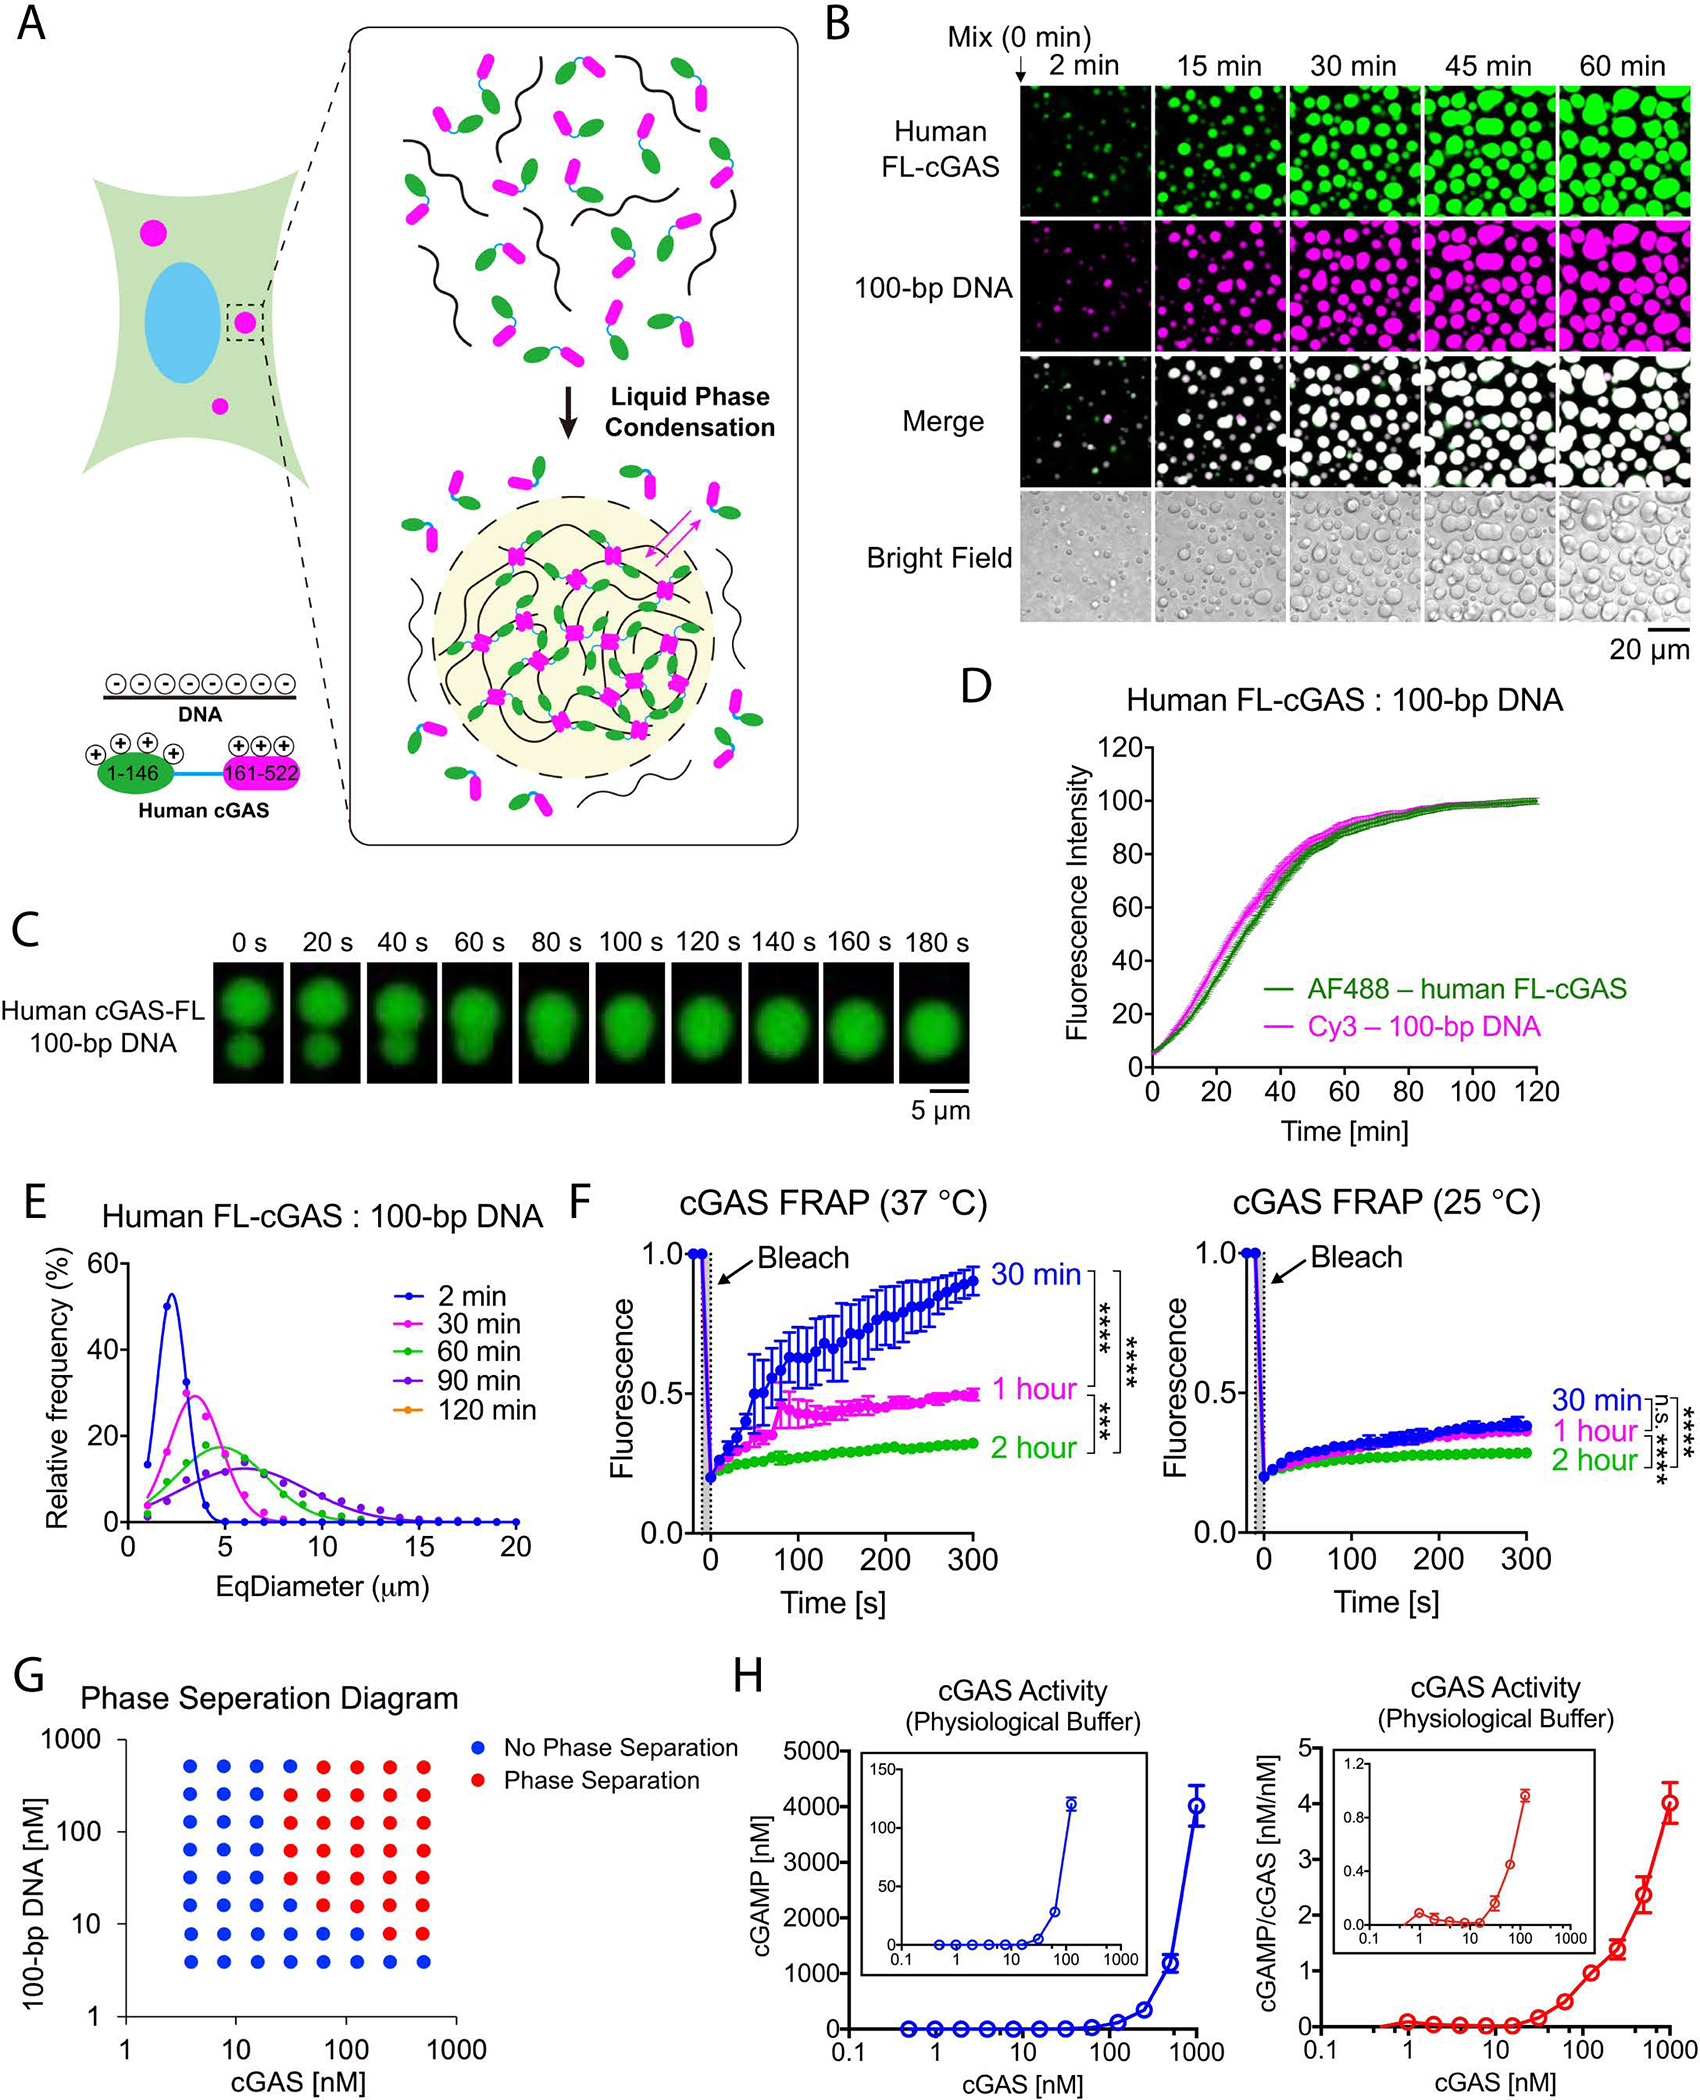
(A) Schematic of hypothetical cGAS–DNA interactions that drive liquid phase condensation. (B) Time-lapse imaging of cGAS–DNA phase separation. Liquid droplets formed after mixing 10 μM full-length human cGAS (3% Alexa 488-labeled) with 10 μM 100-bp DNA (2% Cy3-labeled) and matured over 60 min. The images shown are representative of all fields in the well. (C) Time-lapse micrographs of merging droplets that formed as described in (B). Data are representative of at least ten merging droplets. (D) Fluorescence intensities of cGAS–DNA liquid droplets forming over the time course of 120 min. Data were normalized to 100% by maximal fluorescence intensity. Values shown are means ± SD. N = 4 images. AF488: Alexa Fluor 488. (E) EqDiameter frequency distribution of cGAS–DNA liquid droplets formed at the indicated time points. EqDiameter: the diameter of a circle with the same area as the measured object. cGAS: 5 μM; DNA: 5 μM. (F) Fluorescence recovery after photobleaching (FRAP) of cGAS–DNA liquid droplets. Bleaching was performed at the indicated time points after cGAS (10 μM) and DNA (10 μM) were mixed, and the recovery was allowed to occur at 25 °C (left) or 37 °C (right). Time 0 indicates the start of recovery after photobleaching. Shown are the mean ± SD. N = 3 liquid droplets. One-way ANOVA; p-value: > 0.0332 (n.s.), 0.0332 (*), 0.0021 (**), 0.0002 (***), < 0.0001 (****). (G) Phase separation diagram of full-length human cGAS and 100-bp DNA at indicated concentrations. Blue dots: no phase separation; red dots: phase separation. (H) Left panel: cGAMP production by indicated concentrations of cGAS in the presence of ATP, GTP, and HT-DNA. cGAMP production at low cGAS concentrations is shown in the inset; right panel: normalized cGAMP production divided by cGAS concentrations. Shown are the mean ± SD. N = 3 assays. Data are representative of at least three independent experiments unless indicated otherwise.