Abstract
Enhancing the surface-enhanced Raman scattering (SERS) activity of semiconductor metal oxide nanostructures by controlling the morphology and oxygen vacancies towards trace detection of organics is of significant interest. In this study, MoO3 with a novel sea urchin morphology is synthesized employing chemical bath deposition and consists of hundreds of ∼15 μm long spikes originating from the core forming 20–40 micron globular structures. The spikes taper to form 20 nm sharp tips. SERS of rhodamine 6G (R6G) over MoO3 sea urchins has been investigated and compared to that of 1D h-MoO3 nanorod arrays. The SERS activity is morphology dependent and the sea urchin-like morphology exhibits higher SERS activity with an enhancement factor (EF) of the order 105 and a detection limit of 100 nM, while for h-MoO3 nanorods, the corresponding values are 103 and 1 μM, respectively. X-ray photoelectron spectroscopy reveals a high concentration of Mo+5 states in sea urchins indicating lattice oxygen vacancies. The observed EF is quite high for a metal oxide substrate and is attributed to the enhanced charge transfer between analyte molecules and the substrate promoted by the oxygen vacancies along with surface defects and hydroxyl groups on MoO3 sea urchins providing more active sites for the adsorption of probe molecules. The role of oxygen vacancies is confirmed by the lower EF value exhibited by the stoichiometric 1D h-MoO3. Raman mapping of a single sea urchin is achieved with good R6G intensity and indicates that the tips of spiky features are involved in SERS enhancement. The reusability of substrates is shown for repeated cycles of R6G adsorption by UV irradiation exploiting the photocatalytic activity of MoO3 nanostructures.
MoO3 micro-nanostructures with a sea urchin morphology are synthesized employing a single-step chemical bath deposition method at lower temperatures. MoO3 sea urchins are non-stoichiometric with oxygen vacancies and surface hydroxyl groups, highly suitable for single nanostructure-based SERS detection of dye molecules.
Introduction
Surface-enhanced Raman spectroscopy (SERS) has evolved as a sensitive and rapid analytical tool for the detection of various analyte molecules in several fields such as biology, chemistry, medicine and environment.1–4 Generally, the enormous enhancement in SERS by nanostructured materials is primarily attributed to two mechanisms such as electromagnetic enhancement arising from the interference of local surface plasmon resonance (LSPR) modes and chemical enhancement due to the interaction between analyte molecules and nanoparticles.3–5 Various noble metals such as Ag, Au, and Cu are commonly used as SERS substrates due to their intense localized SPR that covers the visible and infrared wavelength ranges. Nonetheless, high cost and scarcity of usage can limit the practical applications of these noble metal nanoparticles.6,7 Therefore, in recent years, extensive research has been focused on the development of low-cost semiconductor based SERS substrates such as porous ZnO,8 CuO,9 Cu2O superstructures,10 TiO2,11 Fe2O3,12 MoO3,13 and V2O5.14 However, it is still a significant challenge to prepare novel semiconductor nanostructures with high enhancement factors and lower detection limits comparable to those of noble metals.15,16 Semiconductors possess several advantages such as versatile, low-cost synthesis methods, tunable band structures, higher SERS uniformity along with chemical stability and biocompatibility when compared with noble metals, and particularly reusability.17–19 The SERS activity of semiconductor nanostructures is believed to follow a charge transfer mechanism, wherein the electrons get transferred from the adsorbed analyte to the semiconductor or vice versa when irradiated with visible light.15,16
Nanostructured MoO3 is an attractive material due to its unusual chemistry and electrochromism produced by multiple valence states. Molybdenum trioxide (MoO3) is a wide bandgap n-type semiconductor (bandgap ∼3.2 eV) and has been extensively explored for photocatalytic applications.20,21 Generally, crystalline MoO3 formed by MoO6 octahedrons exhibits three polymorphs: thermodynamically stable, orthorhombic α-MoO3 and metastable phases, hexagonal MoO3 (h-MoO3) and monoclinic MoO3 (β-MoO3).21,22 Recently, there has been great interest in exploring MoO3 nanostructures as SERS substrates since the report on local plasmons of MoO3−x nanostructures due to oxygen vacancies.23,24 Dong et al. reported an enhancement factor (EF) of 103 from 1D MoO3 for the 4-mercaptobenzoic acid analyte and theoretical studies confirmed that the enhanced SERS is mainly due to the charge transfer mechanism.13 The coupling of 1D MoO3 nanowires with Au NPs exhibited high SERS sensitivity to melamine showing a limit of detection of 0.01 ppb.25 The plasmonic MoO3−x@MoO3 nanosheets obtained by surface oxidation of MoO3−x revealed high EF values of 105 for the methylene blue (MB) analyte comparable to that observed for noble metal nanostructures.23 Wang et al. fabricated SERS substrates of MoO3 nanorods coated with a thin uniform layer of polymethacrylic acid with a thickness of 4 nm using the molecular imprinting method and achieved an EF of 104 for MB dye. The critical step here is the pretreatment of MoO3 nanorods with HNO3 to provide sufficient surface hydroxyl groups for the anchoring of polymethacrylic acid.24 Wu et al. reported a general route to transform non-SERS substrates into active SERS substrates by engineering the defects and achieved an EF of 1.8 × 10⁷ for rhodamine 6G (R6G) over α-MoO3−x nanobelts.19
The reported methods to prepare SERS active MoO3 nanostructures include the vapour transport method, hydrothermal synthesis, etc that require higher temperatures and post-thermal treatments.13,19,24 We have been exploring simple one-step synthesis protocols for obtaining novel 1D morphologies of MoO3 for improvement in SERS.26 In this article, we present the synthesis of hydrated MoO3 sea urchin nanostructures employing a simple chemical bath deposition method. Chemical bath deposition involves controlled precipitation of a compound from the reaction solution on a suitable substrate at lower temperatures. The present process facilitates easy synthesis and large area deposition on substrates at low cost. SERS application of MoO3 sea urchins is demonstrated using R6G as the model analyte and the performance is compared with that of vertical h-MoO3 nanorods. The stability and SERS of the sea urchins towards recyclability are studied. The potential application of single sea urchin for SERS is presented.
Experimental details
Materials
Ammonium heptamolybdate tetrahydrate, AHM (99.9%) and concentrated HNO3 (69%) were purchased from Merck.
Synthesis of MoO3 sea urchins
The synthesis of MoO3 sea urchins on Si or glass substrates was performed employing a chemical bath deposition method. The cleaned substrates were stuck on the glass slide and dipped inclinedly in a beaker containing 30 mL of 0.025 M AHM precursor solution and 15 mL of conc. HNO3 and heated at 90 °C for 3 h. After 3 h, the substrate was removed from the reaction medium and washed with deionized water and dried at 60 °C in an oven. For comparative SERS studies, we have synthesized vertically aligned hexagonal MoO3 nanorods employing the procedure reported by Singh et al.26 The seeded substrate from chemical bath deposition is subjected to further growth under microwave irradiation for 5 min (Fig. S1a†).
Characterization
Absorption spectra of the as-prepared samples dispersed in ethanol were recorded using a PerkinElmer Lambda 750 spectrophotometer. FT-IR spectra were obtained on pellets of KBr ground with MoO3 powder employing a PerkinElmer spectrum 1000 spectrometer. Raman spectra were acquired from the as-grown MoO3 on substrates using a confocal Raman microscope (Horiba Jobin Yvon-XploRa PLUS V2.1 Multiline). The diffractograms of the nanostructures were recorded using a Rigaku SmartLab diffractometer equipped with parallel beam optics and Cu Kα radiation (1.54 Å, 40 kV, and 30 mA) at a grazing angle of 0.3° was incident on the substrates. A field emission scanning electron microscope (FESEM) (TESCAN MIRA 3 LM) with a Quantax Energy Dispersive Spectroscope (Bruker) attachment was used to study the morphology of the synthesized samples and acquire the elemental composition. A FEI Tecnai (T20 S-TWIN TEM, 200 kV) equipment was used to acquire high resolution transmission electron microscope (HRTEM) images. X-ray photoelectron spectroscopy was performed using a Kratos AXIS Ultra Spectrometer with a spherical mirror analyzer.
SERS measurements
For SERS measurements, rhodamine 6G (R6G) was used as a probe molecule. R6G solutions of various concentrations were prepared in ethanol and 10 μL of R6G solution was drop casted on the substrates (5 mm × 5 mm) with MoO3 sea urchins and dried under ambient conditions. SERS spectra were acquired using a Horiba Jobin Yvon XploRA PLUS V2.1 Multiline confocal Raman microscope. An excitation laser of 532 nm was focused on the samples with a diameter of 0.9 μm through a 100× objective. The acquisition time was 30 s. Raman maps were acquired by scanning the samples under a microscope with a scan area of 12 μm × 12 μm (144 data points) and recording the spectrum at every single point. The integrated intensity of the Raman bands at 612 cm−1 and 1358 cm−1 was used to create Raman maps.
Results and discussion
MoO3 sea urchin nanostructures are synthesized by a simple chemical bath deposition method at lower temperatures, below 100 °C. AHM in the presence of concentrated nitric acid undergoes disproportionation to form MoO3. The schematic representation of the synthesis method is shown in Fig. S1a.† The formation of MoO3 can be expressed as the following reaction.27(NH4)6 Mo7O24·4H2O (aq.) + 6HNO3 → (H4N)x7MoO3−y [OH]z + 6NH4NO3 (aq.) + 7H2O
Initially, dissociation of AHM takes place to produce 6NH4+ and Mo7O24−6 ions. Mo7O24−6 in the presence of H+ ions produces a solid product of MoO3.27 MoO3 nuclei grow to form seeds and act as nucleation centres for further growth of the crystal according to the Ostwald ripening mechanism.27 This is further evident from the morphology study at various stages of the growth of sea urchins (Fig. S1b†). At the initial stage of the reaction, formation of amorphous seed nuclei from the assembly of MoO6 octahedral units is seen all over the surface of the Si substrate. As the reaction progresses (90 min), isolated plate like crystals are seen distributed over the substrate with less density indicating that there is a dissolution of some of the initial nuclei to favour the growth of stable ones. As the MoO6 growth units assemble, defects may also be generated that further favours intergrowth structures, seen as irregular aggregates of crystals at 120 min of reaction. The addition of further nuclei onto the irregular aggregates results in anisotropic growth radially in energetically favoured [001] orientation leading to the formation of spiky features.28 As the reaction further progresses, the nanostructures continue to grow and crystallize to attain a sea urchin morphology.28,29
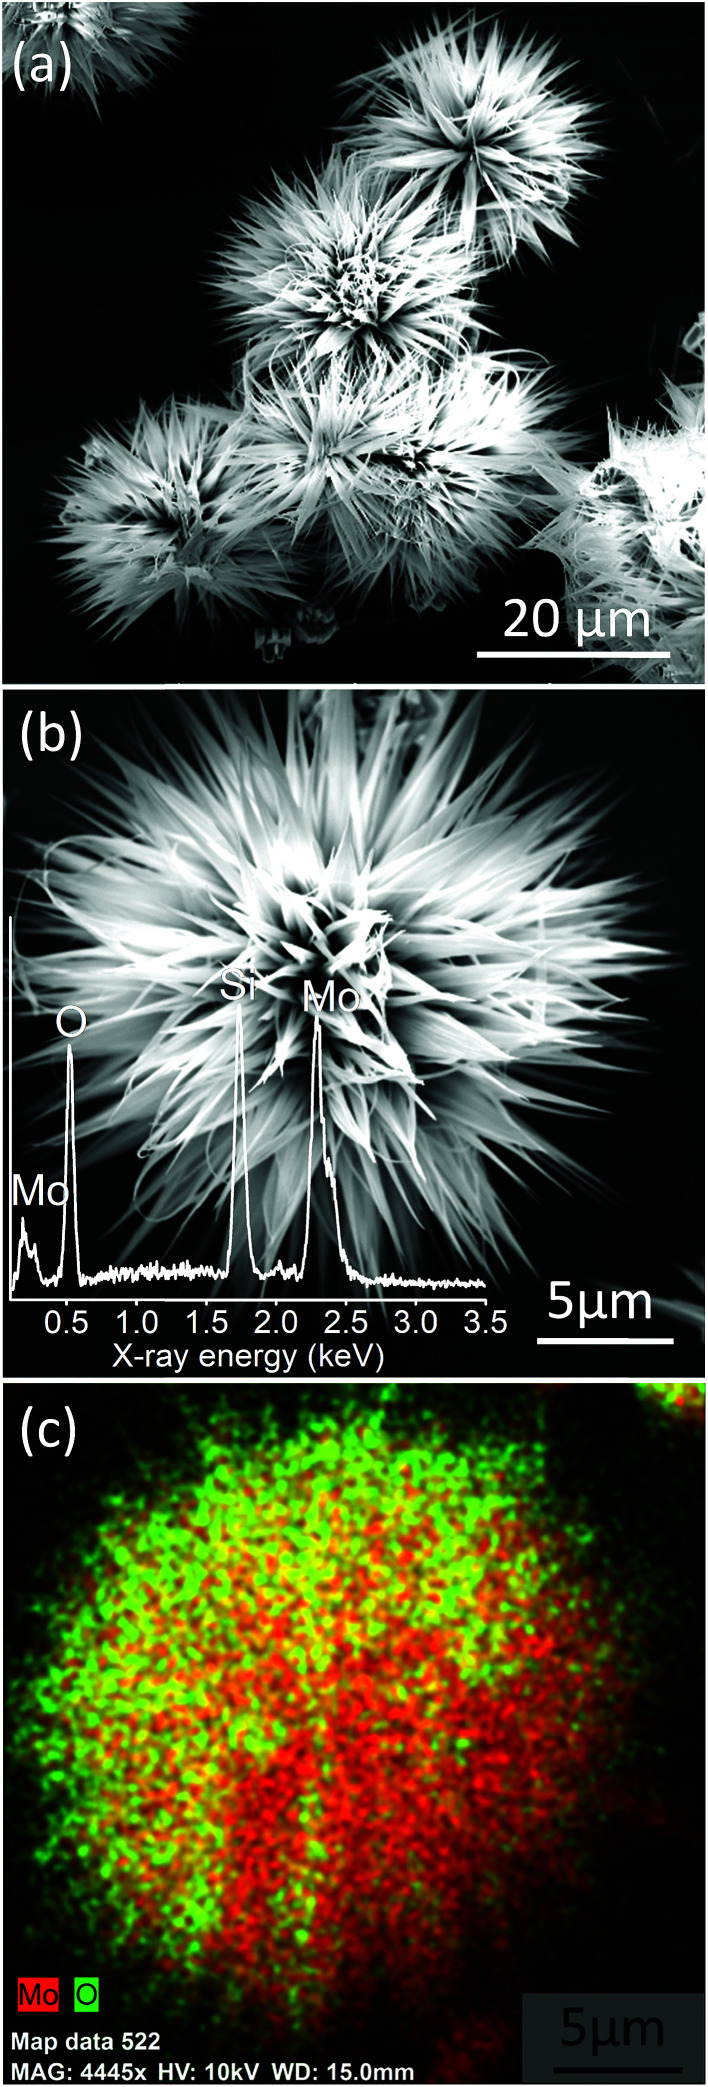
The surface morphology of MoO3 nanostructures synthesized employing chemical bath deposition has been examined by FESEM, and the images are given in Fig. 1. MoO3 exhibits an exquisite sea urchin morphology (Fig. 1a) with typical diameter in the range of 20–40 μm (Fig. S2a†). Fig. 1b shows the magnified image of a single MoO3 sea urchin. It can be seen that the micron-sized MoO3 sea urchins are formed by elongated spines with a length of ∼13 μm (Fig. S2b†) originating from a central core similar to the case of a sea urchin organism. The EDS spectra show the presence of both Mo and O (inset of Fig. 1b) and EDS maps of Mo L and O K levels acquired from a single MoO3 sea urchin (Fig. S3†) also show the uniform elemental composition across the micro-nanostructure. Fig. 1c displays the EDS composite map of Mo L (red) and O K (green) levels. The yellow colour is seen due to the overlap of red and green colours. It can be noticed from Fig. 1c that the tips are green in colour due to the availability of more –OH species and the middle core region is yellow in colour due to the presence of Mo and oxygen in an equimolar ratio. In some areas, the red colour can be seen due to the occurrence of more Mo species.
Fig. 1. (a) FESEM images of MoO3 sea urchins on a Si substrate synthesized by chemical bath deposition, (b) magnified image of a single MoO3 sea urchin; inset shows the EDS spectra and (c) EDS composite map of Mo L (red) and O K (green) levels from a single sea urchin. Yellow colour is seen due to the overlap of green and red in the same region (see Fig. S3†).
We have also synthesized vertically oriented and highly crystalline hexagonal MoO3 nanorods (Fig. S1a†) with a length of ∼5.5 μm and a diameter of ∼400 nm on a Si substrate in order to study the effect of the morphology and stoichiometry on the SERS performance. h-MoO3 nanorods are well characterized as reported in our previous article26 and further characterization data are given in the ESI (Fig. S4 to S8†).
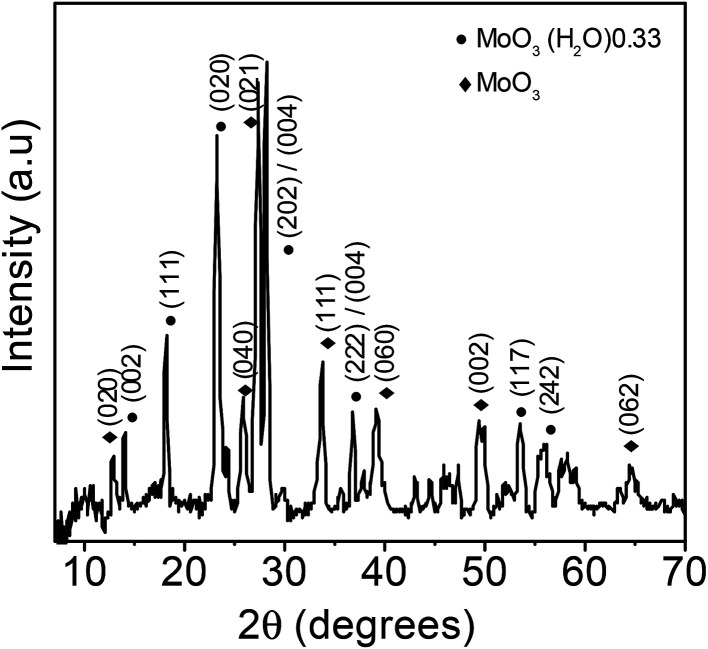
The XRD pattern of the MoO3 sea urchins shown in Fig. 2 reveals the presence of mixed phases of orthorhombic MoO3 with MoO3·0.33H2O composition (JCPDS no. 87-1205) and the α-MoO3 phase (JCPDF no. 89-5108). The peaks at 13.9° (002), 18.1° (111), 23.1° (020), 28.1° (202/004), 36.7° (222/024), 53.4° (117), and 55.9° (242) correspond to the MoO3·0.33H2O phase. For α-MoO3, the peaks are observed at 12.8° (020), 25.7° (040), 27.3° (021), 33.8° (111), 38.9° (060), and 49.2° (002). The intense and sharp peaks suggest that the as-synthesized MoO3 sea urchins are well crystallized. In the case of h-MoO3 rods, only peaks due to hexagonal crystallites are observed.26
Fig. 2. XRD pattern of MoO3 sea urchin structures.
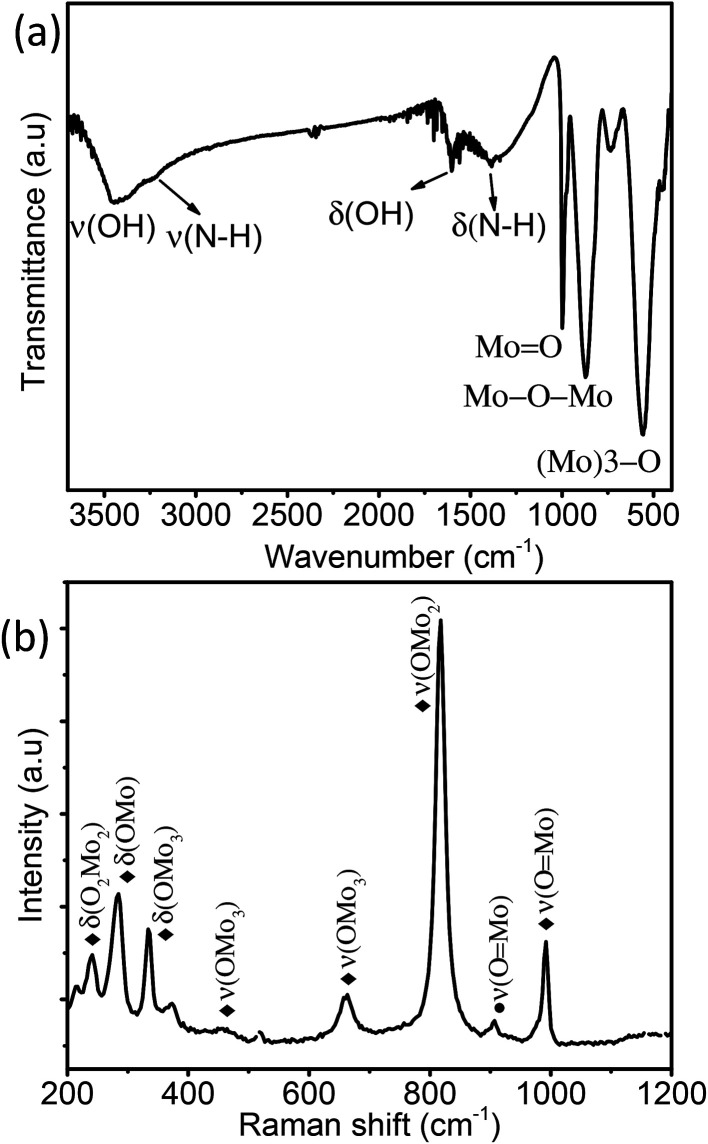
Fig. 3a displays the FT-IR spectra of MoO3 sea urchins and the strong bands observed at 1000 to 400 cm−1 correspond to the stretching and bending vibrations of Mo–O characteristic bonds. The peak at 990 cm−1 corresponds to the terminal Mo O bond stretching and that at 871 cm−1 is attributed to the stretching vibration of the Mo–O–Mo bond while the bending mode is observed at 570 cm−1. The stretching and bending of –OH associated with the surface hydroxyl groups and associated water are seen as broad peaks at 3448 cm−1 and 1615 cm−1, respectively.30–32 Low intensity broad peaks at 3242 cm−1 and 1400 cm−1 correspond to the stretching and bending vibrations of N–H of NH4+ groups.27,30,31 Raman spectra of MoO3 sea urchins are shown in Fig. 3b. The bands observed from 600–1000 and 200–400 cm−1 correspond to the stretching and deformation/lattice modes of MoO3, respectively. The most intense peak at 814 cm−1 corresponds to the OMo2 vibrations of α-MoO3 phases and that at 905 cm−1 corresponds to the ν(O Mo) vibrations of α-MoO3·0.33H2O phases.30–34 The peaks present at 995 and 336 cm−1 correspond to ν(O Mo) vibrations while the peaks at 662 and 286 cm−1 are attributed to the OMo3 vibrational modes of α-MoO3.30,31 Optical absorption spectra of MoO3 sea urchins and h-MoO3 nanorods given in Fig. S6† show band edge absorption at 317 nm.35 In the case of sea urchins, the tail of the absorption edge extends further into the visible region compared to that observed for h-MoO3 indicating the presence of intermediate energy levels and thus lowering the band gap to 2.8 eV in sea urchin structures.36 In addition, a broad absorption of lower intensity from the visible to the NIR region is observed in both cases, which also supports intermediate surface states and might arise from oxygen vacancies.23,36
Fig. 3. (a) FTIR spectra and (b) Raman spectra of the as-synthesized MoO3 sea urchin micro-nanostructures (♦ α-MoO3 and ● MoO3·0.33H2O).
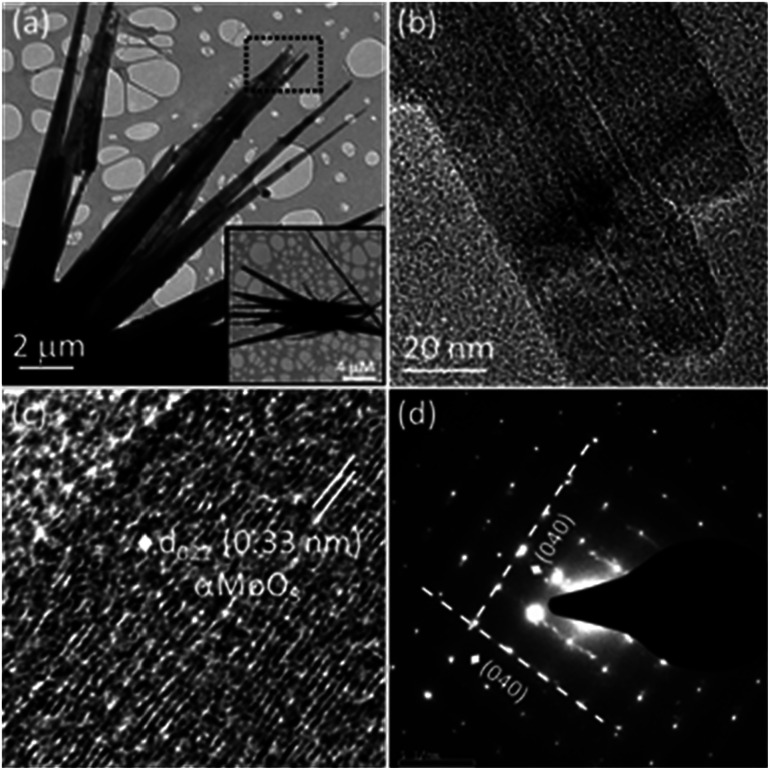
The morphology observed in the TEM image (Fig. 4a) is consistent with the FESEM image (Fig. 1). Fig. 4b displays the magnified view of MoO3 sea urchin spines/spikes. The average length of the spikes is around 14 μm and the spikes taper towards the end to form sharp tips with a diameter of ∼20 nm. A high-resolution image of the spiky tip is given in Fig. 4c. HRTEM image analysis indicates a d spacing of 0.33 nm corresponding to the (021) plane of α-MoO3. Fig. 4d displays the selected area diffraction pattern (SAED) from the tip of the MoO3 sea urchin spikes. The bright spots in SAED indicate the single crystalline nature of the mixed phases of MoO3. The well-defined diffraction spots correspond to the (040) planes of α-MoO3 indicating spike growth in the [001] direction.
Fig. 4. TEM images of MoO3 sea urchins: (a) low magnification image; inset shows the complete view of one sea urchin. (b) High magnification image of (a), (c) HRTEM image of a spine and (d) SAED pattern from the spines of sea urchins.
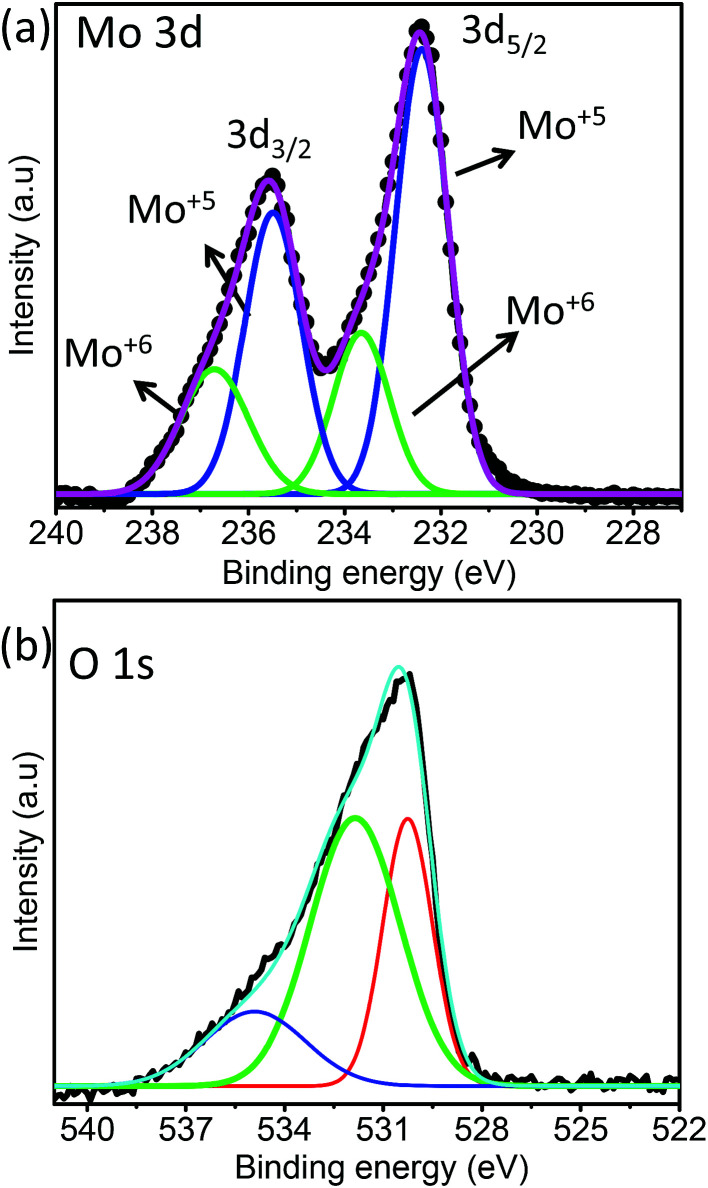
XPS analysis was performed to understand the surface states and vacancies present in the sea urchin structure. The survey spectra of MoO3 nanostructures (Fig. S7†) clearly show the major peaks due to Mo 2p, 3d and O 1s. Fig. 5 displays the deconvoluted Mo 3d and O 1s spectra. The doublet pattern for MoO3 nanostructures is due to the spin–orbit splitting of Mo 3d levels giving rise to Mo 3d5/2 and Mo 3d3/2 levels with an energy difference of 3.1 eV. The deconvolution of Mo 3d spectra reveals two pairs of doublets that correspond to a mixed valence state of MoO3 nanostructures. The peaks located at 232.4 and 235.5 eV correspond to 3d5/2 and 3d3/2 of Mo+5 and those at 233.6 and 236.7 eV corresponds to Mo+6, respectively, for MoO3 sea urchin nanostructures.37–39 It is evident that the concentration of the Mo+5 component in the hydrated MoO3 sea urchins is quite higher than that of Mo+6, indicating that the synthesized sea urchins are highly non-stoichiometric. This can be directly correlated with the presence of oxygen defects in the synthesized MoO3 sea urchins. In the literature, such oxygen defects are shown to be responsible for generating local surface plasmon modes in metal oxides for exploitation in SERS.19,23 Wu et al. reported a general route for the transformation of non-SERS metal oxide nanostructures into SERS active substrates by annealing in a vacuum at various temperatures to create oxygen defects, which introduces defect energy levels in the band gap of metal oxides. High SERS enhancement factors were achieved by controlling the oxygen defects for α-MoO3−x and V2O5−x from 0 to 0.05387x and 0 to 0.07933x, respectively.19 In order to compare and confirm the presence of a high concentration of Mo+5 in the synthesized sea urchins, we have also analyzed the XPS spectra of h-MoO3 nanorods wherein the concentration of Mo+6 is seen to be maximum as expected in the case of stoichiometric MoO3 (Fig. S8†). From the fitting analysis, the calculated atomic percentage of Mo+6 and Mo+5 for MoO3 nanostructures is given in Table 1.
Fig. 5. XPS of MoO3 sea urchin structures: (a) Mo 3d and (b) O 1s spectra.
XPS results for MoO3 nanostructures.
| MoO3 | Mo 3d | Atomic % | ||||
|---|---|---|---|---|---|---|
| Mo 3d5/2 (eV) | Mo 3d3/2 (eV) | Mo+6 | Mo+5 | |||
| Mo+5 | Mo+6 | Mo+5 | Mo+6 | |||
| MoO3 sea urchins | 232.4 | 233.6 | 235.5 | 236.7 | 33.47 | 66.53 |
| h-MoO3 nanorods | 232.1 | 233.1 | 235.1 | 236.2 | 91.50 | 08.50 |
The O 1s spectra given in Fig. 5b exhibit a broad asymmetric peak, which can be deconvoluted into three peaks for MoO3 sea urchins. The most intense peak at lower energy (530.3 eV) can be assigned to O2− forming strong Mo
O bonds. The binding energy 531.8 eV is related to surface hydroxyl groups and a broad peak at 534.9 eV corresponds to the H2O molecules.34,35 It can be noticed that the peak due to surface hydroxyl groups is as intense as that of the lattice oxygen for sea urchins and the ratio of integrated area, 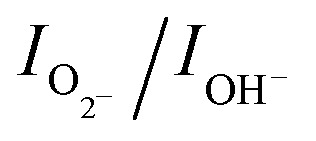 , is estimated to be 0.6. In the case of h-MoO3 nanorods, only peaks due to Mo
O bonds and surface hydroxyl groups are seen at 530.7 eV and 532.6 eV (Fig. S8b†), respectively and
 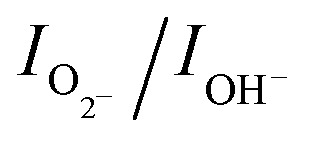 is ∼1.2. It can be deduced that the as-synthesized MoO3 sea urchins contain various oxygen vacancies and the electrons are trapped in such oxygen vacancies leading to Mo+5 intermediate states.19,23
SERS
SERS is being used as a powerful analytical tool for the detection of analyte molecules present in trace amounts. R6G is one of the highly fluorescent dyes and an active analyte for SERS studies due to its large Raman scattering cross-section43 and molecular resonance effect when irradiated with visible light.40–43
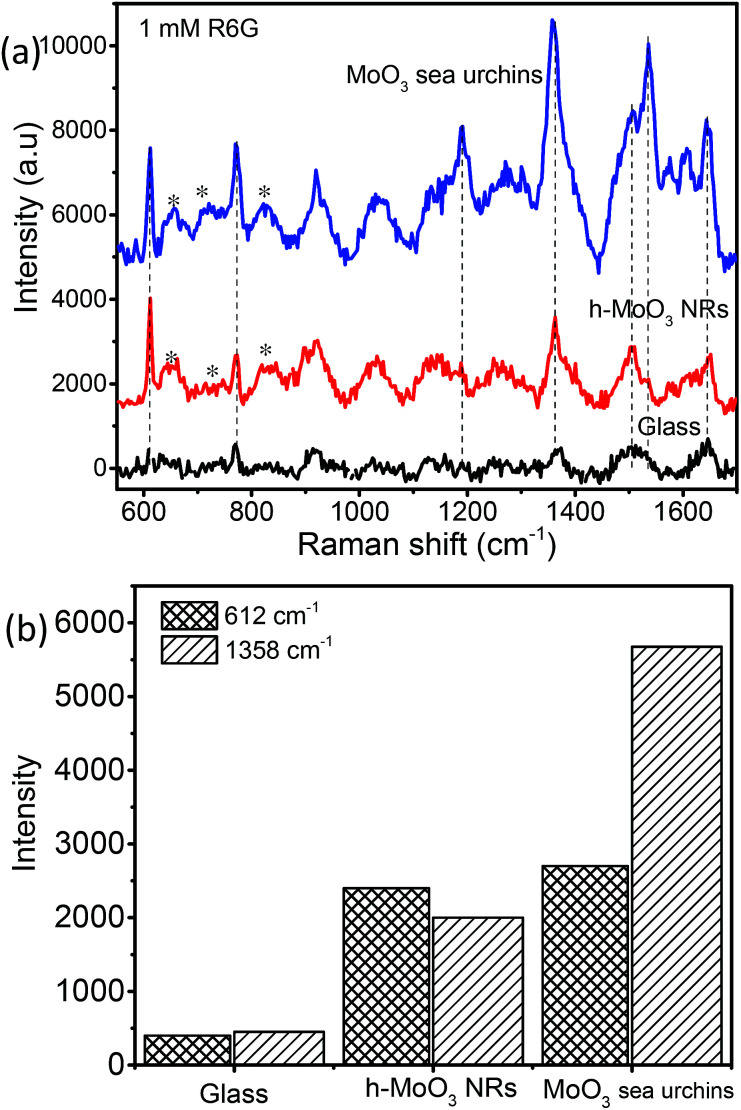
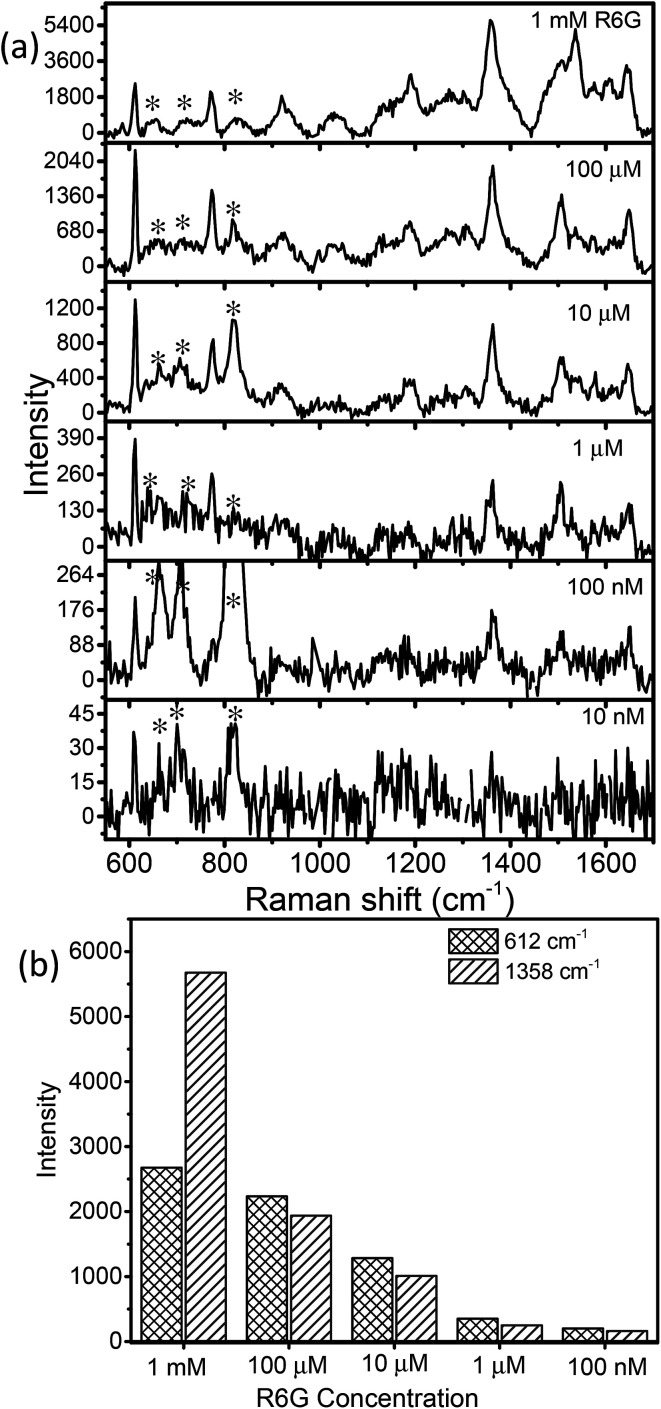
Fig. 6a displays the baseline corrected SERS spectra of 1 mM concentration of R6G on a glass substrate, and MoO3 sea urchin and h-MoO3 modified substrates. It is clear that R6G adsorbed on MoO3 nanostructures exhibits enhanced vibrational signatures when compared to the R6G coated glass substrate. The peak positions are well matched with the literature on R6G adsorbed over metal oxide substrates.10,14 The peaks at 612 cm−1 and 770 cm−1 are assigned to the in-plane bending mode of the C–C–C ring and out of plane bending motion of the C–H of the xanthene skeleton, respectively. The bands at 1190 cm−1 and 1358 cm−1 correspond to the C–C stretching and C–N stretching of the xanthene ring, respectively. The bands around 1504, 1536 and 1644 cm−1 are assigned to C–C stretching vibrations.41–44 In order to analyze the SERS effect, the intensities of 612 cm−1 and 1358 cm−1 peaks of 1 mM R6G over various MoO3 nanostructures are compared in Fig. 6b. It can be observed that the enhancement is much higher for MoO3 sea urchins than for vertical h-MoO3 nanorods indicating the effectiveness of the surface defects and morphological advantages in improving the SERS activity. Fig. 7 displays the SERS spectra of R6G adsorbed over a MoO3 sea urchin modified substrate for various concentrations ranging from 1 mM to 10 nm. The Raman intensity of R6G vibrations became weaker with decreasing concentration. However, all the Raman bands can still be discerned for concentrations up to 100 nM. For 10 nM concentration of R6G, only a peak at 612 cm−1 due to R6G is seen. Fig. 7b exhibits the intensity bar diagram for 612 cm−1 and 1358 cm−1 for various concentrations. For comparison, SERS spectra of various concentrations of R6G over h-MoO3 nanorods are shown in Fig. S9† and it can be noticed that Raman spectra due to R6G are observed only till 1 μM in the case of h-MoO3 nanorods. In all the SERS spectra, the peaks corresponding to MoO3 are denoted by asterisks.
Fig. 6. (a) SERS spectra of 1 mM R6G coated on various substrates on bare glass, h-MoO3 nanorods/Si and MoO3 sea urchins/glass and (b) Raman band intensity bar diagram (* denotes α-MoO3 Raman peaks).
Fig. 7. (a) SERS spectra of various concentrations of R6G coated on MoO3 sea urchin structures (* denotes α-MoO3 signatures) and (b) plot of R6G concentration versus Raman peak intensity (612 cm−1 and 1358 cm−1).
Estimation of the EF
The EF value of R6G on MoO3 nanostructures relative to R6G coated on glass (considered as a bulk sample) is calculated employing the formula 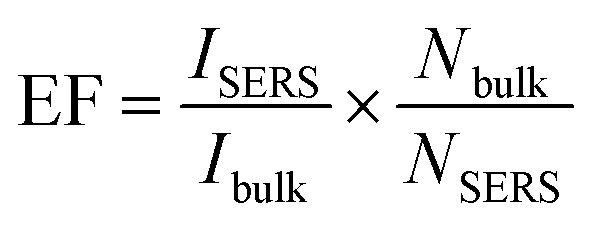 , where ISERS is the SERS intensity measured from the substrate and Ibulk is the normal Raman intensity measured for R6G on glass. Nbulk is the number of probe molecules under laser illumination in the bulk sample and NSERS is the number of probed molecules on the surface of the substrate. Nbulk has been calculated employing the following expression
 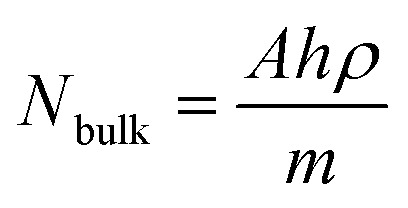 , where A is the area of the laser spot (0.407 μm2), h is the confocal depth of focus (2.63 μm), ρ is the density (1.26 g cm−3) and m is the molecular weight of the analyte (479.02 g mol−1). The value of Nbulk is estimated to be 2.81 × 10⁻¹⁵ moles. NSERS has been estimated according to the Park et al. procedure.42,43,45,46 The lowest concentration of R6G adsorbed on the surface of the MoO3 nanostructures such as sea urchins and vertically aligned nanorods is 100 nM (1 × 10⁻⁷ M) and 1 μM (1 × 10⁻⁶ M), respectively. Assuming that all R6G molecules get adsorbed on the surface of MoO3 structures, the number of moles of R6G contributing to the Raman signal is 1 × 10⁻¹² moles and 1 × 10⁻¹¹ moles (a volume of 10 μL was used) for MoO3 sea urchins and h-MoO3 nanorods, respectively. With the help of the laser spot size, the number of R6G molecules present under the laser illumination can be estimated employing the expression, NSERS = {(concentration (moles))/sampling area [π(3 mm)2]} × area of the laser spot size [π(0.36 μm)2].
Two signature bands of R6G such as 612 cm−1 and 1358 cm−1 were chosen for calculating the EF based on the enhancement in Raman intensities compared with that of R6G on glass. The ratio of ISERS/Ibulk calculated for various R6G bands on MoO3 sea urchins and vertically aligned nanorods is given in Table S1.† The EF obtained for MoO3 sea urchin structures is as high as ∼105 with a detection limit of 10−7 M for the R6G analyte while for h-MoO3 nanorods, the corresponding EF is 7.8 × 10³. The obtained EF of 105 for sea urchins is quite higher than the expected values from usual semiconductor nanostructures and are comparable to the reported high EFs from plasmonic MoO3−x@MoO3, MoO3 microspheres and amorphous ZnO nanocages.8,19,21 An EF value of 3.4 × 10⁵ for the R6G analyte over tungsten oxide nanostructures has been reported and the enhancement is attributed to the coupling between the surface oxygen states of tungsten oxide and vibrational states of analyte molecules.44 1D MoO3−x nanobelts are reported to exhibit an EF of 107.19 The SERS performances of various reported semiconductor nanostructures are listed in Table S2.†
Micrometer-sized sea urchins are visible under an optical microscope and we have explored the SERS from a single sea urchin. Raman mapping was performed over a 12 μm × 12 μm area of a single MoO3 sea urchin employing 100 μM R6G. Fig. 8 displays the Raman mapping images corresponding to the 612 cm−1 (green) and 1358 cm−1 (blue) peaks of R6G along with Raman spectra obtained in the tip as well as middle regions of the MoO3 sea urchin. Raman spectra collected at five random positions of the MoO3 sea urchin tips (spikes) and core are shown in Fig. S10.† The SERS map suggests that the tips (spikes) of the scattering substrates generate enhanced SERS intensity compared to the core region of the sea urchin.
Fig. 8. SERS intensity mapping of 100 μM R6G adsorbed on a single sea urchin MoO3 (a) 612 cm−1 peak (green); inset shows the optical image of a single MoO3 sea urchin with R6G (b) 1358 cm−1 peak (blue) and (c) SERS spectra of R6G in the tip and middle regions of the MoO3 sea urchin nanostructures.
The observed high SERS performance of MoO3 sea urchins may be ascribed to several factors: (1) charge transfer enhancement (CT), (2) local electric field of the hydrated species on the surface of the nanostructures, (3) intrinsic and surface oxygen vacancies and (4) resonance Raman from dye molecules. It is well known that in the CT mechanism, the molecule to substrate electron transfer is the main contribution for SERS from semiconductors. The mechanism involved is electronic coupling between the metal oxide and R6G molecules during irradiation of 532 nm light (Fig. S11†). The electrons get excited from the defect levels of MoO3 nanostructures and are transferred to the LUMO of R6G. Simultaneously, electrons also get excited from the HOMO to the LUMO level in the dye molecules especially with 532 nm laser excitation, which can be transferred to the conduction band of MoO3 levels.41,46–48 In the case of MoO3 sea urchins, the effect gets accentuated by the surface defects and oxygen vacancies present in the sea urchin tips promoting the adsorbate–adsorbent interactions. In addition to the charge transfer mechanism, contribution from local dipole moment due to the surface OH species of sea urchins can also result in the enhancement.49 The low-temperature wet chemical method employed for the synthesis promotes the formation of surface hydroxyls and oxygen vacancies in the case of hydrated MoO3 sea urchins19 and can be more concentrated at the tips of the spikes. Sea urchin shaped nanostructures are ideal for the performance improvement compared to regular nanorod morphologies. The sea urchins provide more surface area and binding sites in the form of abundant intrinsic and surface defects as well as hydrated species particularly at the tips that lead to adsorption of more analyte molecules. The sharp spikes (anisotropic morphology of semiconductors) also promotes the charge transfer from molecules to the substrate with the suppression of e–h recombination when irradiated with laser light.50
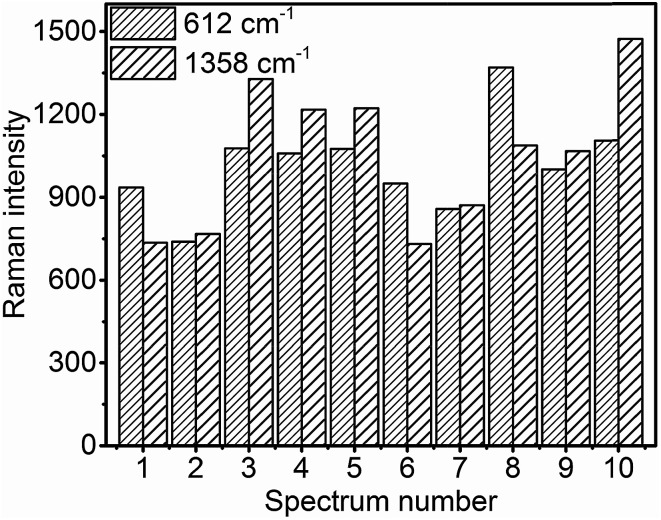
For practical SERS applications, the reproducibility of the measured data is important. In order to achieve reproducibility, the uniformity of the SERS substrates should be high. Fig. 9 shows the intensity bar diagram of 612 cm−1 and 1358 cm−1 peaks of 100 μM R6G obtained at 10 random positions across a 0.25 cm2 glass slide with MoO3 sea urchin structures. It is evident that the Raman counts are quite consistent from place to place across the sample surface (see Fig. S12†). The relative standard deviation (RSD) of the Raman signal intensity for 612 cm−1 and 1358 cm−1 of R6G is calculated to be 16.6% and 25.2%, respectively.
Fig. 9. Raman intensity bar diagram of 612 cm−1 and 1358 cm−1 peaks of R6G in the spike region of various MoO3 sea urchins across the substrate at 10 random positions.
Reusability
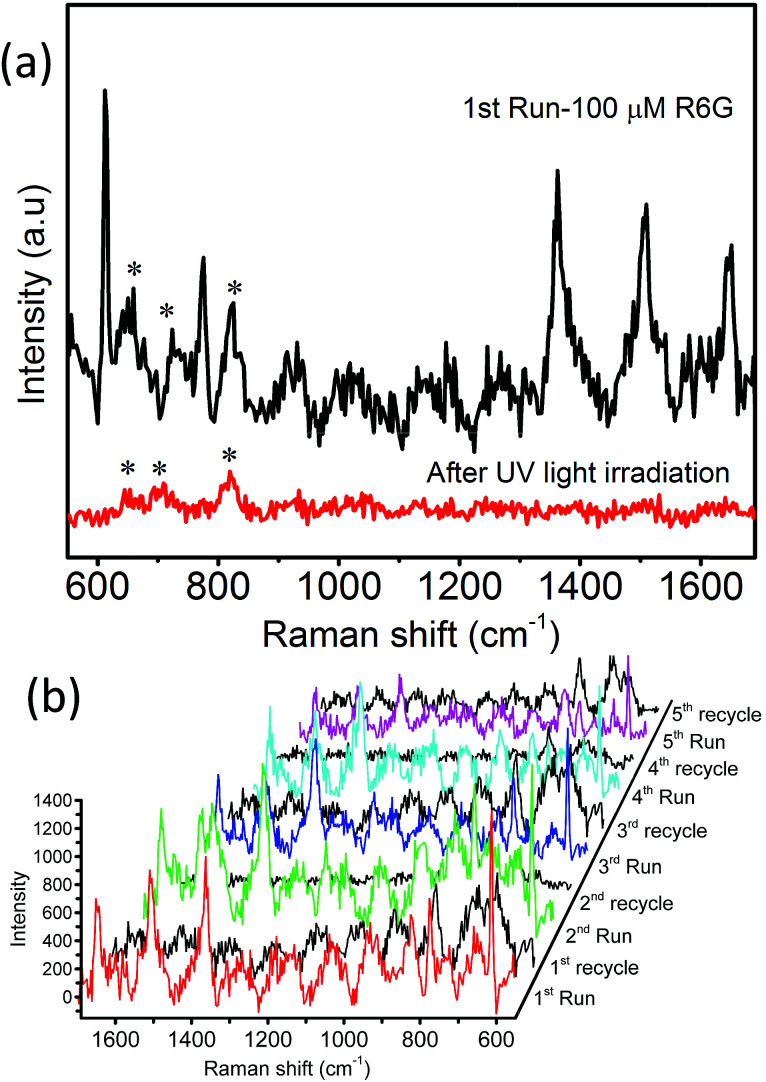
The reusability of the as-prepared MoO3 sea urchins as SERS substrates for fluorescent dyes was also tested. The photocatalytic degradation of dyes by semiconductor nanostructures is exploited for the renewal of substrates. For this, the substrates were irradiated with UV light (365 nm) under wet conditions for 30 min followed by cleaning the substrates with acetone and ethanol. Fig. 10a shows that the Raman signatures of R6G are highly diminished after irradiation with UV light. The photocatalytic degradation of R6G by MoO3 sea urchins is facilitated by the surface oxygen defects and sharp tips of sea urchin spikes resulting in efficient electron–hole separation. Moreover, the surface of MoO3 nanostructures has a strong affinity towards atmospheric O2 species. They can act as an active species by forming ˙O2− during the UV light illumination and help in the degradation of R6G dye molecules.23 The cleaned substrates were then reimmersed in the R6G solution for SERS measurement. Fig. 10b displays the Raman spectra from the five cycles of the reusability test. It can be seen that the MoO3 sea urchin substrates display no noticeable loss of SERS enhancement even after five cycles. The reusability of h-MoO3 nanorods as SERS substrates for R6G molecules was also tested and is shown in Fig. S13.†
Fig. 10. MoO3 sea urchins as renewable SERS substrates: (a) SERS of 100 μM R6G before and after UV treatment and (b) reusability of MoO3 sea urchin substrates for 100 μM R6G tested for five runs before and after UV treatment (* denotes α-MoO3 peaks).
Conclusions
We have achieved the synthesis of MoO3 micro-nanostructures with a sea urchin morphology employing a facile, low-cost chemical bath deposition method and demonstrated their potential application as SERS substrates for the detection of R6G molecules. Lower temperature synthesis routes introduce non-stoichiometric defects and vacancies and as a result, MoO3 sea urchins are composed of a high concentration of Mo+5 and surface hydroxyl groups compared to stoichiometric h-MoO3 nanorods. The SERS activity of the R6G molecules over MoO3 nanostructures mainly depends on the charge transfer interaction between the analyte and the substrate and the availability of oxygen vacancies and surface defects. The role of oxygen vacancies in SERS is supported by the lower EF value of ∼7.8 × 10³ obtained for 1D h-MoO3 vertical arrays compared to the high EF value, ∼1 × 10⁵, of MoO3 sea urchins. Raman mapping on a single sea urchin proves that the tips of sea urchin spikes contribute more to SERS enhancement. MoO3 sea urchin based SERS substrates are renewable by UV irradiation of dyes due to photodegradation catalysis of MoO3 nanostructures. The above nanostructures also hold the potential to serve as addressable SERS substrates.
Conflicts of interest
There are no conflicts to declare.
Supplementary Material
Acknowledgments
One of the authors, RPB, is grateful to the DST-inspire fellowship (IF160653) for financial assistance. The authors acknowledge AFMM and CeNSE at IISc, Bangalore, for TEM and XPS facilities.
Electronic supplementary information (ESI) available. See DOI: 10.1039/c9na00115h
References
- Cooney R. P. Reid E. S. Fleischmann M. Hendra P. J. J. Chem. Soc., Faraday Trans. 1977;73:1691–1698. doi: 10.1039/F19777301691. [DOI] [Google Scholar]
- Sharma B. Frontiera R. R. Henry A. I. Ringe E. Van Duyne R. P. Mater. Today. 2012;15:16–25. doi: 10.1016/S1369-7021(12)70017-2. [DOI] [Google Scholar]
- Schlücker S. Angew. Chem., Int. Ed. 2014;53:4756–4795. doi: 10.1002/anie.201205748. [DOI] [PubMed] [Google Scholar]
- Kumari G. Kandula J. Narayana C. J. Phys. Chem. C. 2015;119:20057–20064. doi: 10.1021/acs.jpcc.5b07556. [DOI] [Google Scholar]
- Zong C. Xu M. Xu L. J. Wei T. Ma X. Zheng X. S. Hu R. Ren B. Chem. Rev. 2018;118:4946–4980. doi: 10.1021/acs.chemrev.7b00668. [DOI] [PubMed] [Google Scholar]
- Ding S. Y. Yi J. Li J. F. Ren B. Wu D. Y. Panneerselvam R. Tian Z. Q. Nat. Rev. Mater. 2016;1:16021. doi: 10.1038/natrevmats.2016.21. [DOI] [Google Scholar]
- Lin X. M. Cui Y. Xu Y. H. Ren B. Tian Z. Q. Anal. Bioanal. Chem. 2009;394:1729–1745. doi: 10.1007/s00216-009-2761-5. [DOI] [PubMed] [Google Scholar]
- Wang X. Shi W. Jin Z. Huang W. Lin J. Ma G. Li S. Guo L. Angew. Chem., Int. Ed. 2017;56:9851–9855. doi: 10.1002/anie.201705187. [DOI] [PubMed] [Google Scholar]
- Wang Y. Hu H. Jing S. Wang Y. Sun Z. Zhao B. Zhao C. Lombardi J. R. Anal. Sci. 2007;23:787–791. doi: 10.2116/analsci.23.787. [DOI] [PubMed] [Google Scholar]
- Lin J. Shang Y. Li X. Yu J. Wang X. Guo L. Adv. Mater. 2017;29:1604797. doi: 10.1002/adma.201604797. [DOI] [PubMed] [Google Scholar]
- Musumeci A. Gosztola D. Schiller T. Dimitrijevic N. M. Mujica V. Martin D. Rajh T. J. Am. Chem. Soc. 2009;131:6040–6041. doi: 10.1021/ja808277u. [DOI] [PubMed] [Google Scholar]
- Fu X. Bei F. Wang X. Yang X. Lu L. Mater. Lett. 2009;63:185–187. doi: 10.1016/j.matlet.2008.09.027. [DOI] [Google Scholar]
- Dong B. Huang Y. Yu N. Fang Y. Cao B. Li Y. Xu H. Sun M. Chem.–Asian J. 2010;5:1824–1829. doi: 10.1002/asia.200900706. [DOI] [PubMed] [Google Scholar]
- Pan J. Li M. Luo Y. Y. Wu H. Zhong L. Wang Q. Li G. H. Appl. Surf. Sci. 2015;333:34–38. doi: 10.1016/j.apsusc.2015.01.242. [DOI] [Google Scholar]
- Zhang X. Yu Z. Ji W. Sui H. Cong Q. Wang X. Zhao B. J. Phys. Chem. C. 2015;119:22439–22444. doi: 10.1021/acs.jpcc.5b06001. [DOI] [Google Scholar]
- Yang L. Jiang X. Ruan W. Yang J. Zhao B. Xu W. Lombardi J. R. J. Phys. Chem. C. 2009;113:16226–16231. doi: 10.1021/jp903600r. [DOI] [Google Scholar]
- Ji W. Zhao B. Ozaki Y. J. Raman Spectrosc. 2016;47:51–58. doi: 10.1002/jrs.4854. [DOI] [Google Scholar]
- Tan X. Melkersson J. Wu S. Wang L. Zhang J. ChemPhysChem. 2016;17:2630–2639. doi: 10.1002/cphc.201600286. [DOI] [PubMed] [Google Scholar]
- Wu H. Wang H. Li G. Analyst. 2017;142:326–335. doi: 10.1039/C6AN01959E. [DOI] [PubMed] [Google Scholar]
- Wongkrua P. Thongtem T. Thongtem S. J. Nanomater. 2013;2013:79. [Google Scholar]
- Liu Y. Feng P. Wang Z. Jiao X. Akhtar F. Sci. Rep. 2017;7:1845. doi: 10.1038/s41598-017-02025-3. [DOI] [PMC free article] [PubMed] [Google Scholar]
- Bate N. Shi H. Chen L. Wang J. Xu S. Chen W. Li J. Wang E. Chem.–Asian J. 2017;12:2597–2603. doi: 10.1002/asia.201700951. [DOI] [PubMed] [Google Scholar]
- Tan X. Wang L. Cheng C. Yan X. Shen B. Zhang J. Chem. Commun. 2016;52:2893–2896. doi: 10.1039/C5CC10020H. [DOI] [PubMed] [Google Scholar]
- Wang L. Xu Y. Tan X. Tapas S. Zhang J. RSC Adv. 2017;7:36201–36207. doi: 10.1039/C7RA05547A. [DOI] [Google Scholar]
- Liang X. Zhang X. J. You T. T. Wang G. S. Yin P. G. Guo L. CrystEngComm. 2016;18:7805–7813. doi: 10.1039/C6CE01678B. [DOI] [Google Scholar]
- Singh K. K. Ramakrishnan V. Prabhu R. John N. S. CrystEngComm. 2017;19:6568–6572. doi: 10.1039/C7CE01531C. [DOI] [Google Scholar]
- Chithambararaj A. Sanjini N. S. Bose A. C. Velmathi S. Catal. Sci. Technol. 2013;3:1405–1414. doi: 10.1039/C3CY20764A. [DOI] [Google Scholar]
- Sui L. Song X. Cheng X. Zhang X. Xu Y. Gao S. Wang P. Zhao H. Huo L. CrystEngComm. 2015;17:6493–6503. doi: 10.1039/C5CE00693G. [DOI] [Google Scholar]
- O'Dwyer C. Navas D. Lavayen V. Benavente E. Ana M. A. S. Gonzalez G. Newcomb S. B. Torres C. M. S. Chem. Mater. 2006;18:3016–3022. doi: 10.1021/cm0603809. [DOI] [Google Scholar]
- Philip D. Aruldhas G. Ramakrishnan V. Pramana. 1988;30:129–133. doi: 10.1007/BF02846651. [DOI] [Google Scholar]
- Seguin L. Figlarz M. Cavagnat R. Lassègues J. C. Spectrochim. Acta, Part A. 1995;51:1323–1344. doi: 10.1016/0584-8539(94)00247-9. [DOI] [Google Scholar]
- Nazri G. A. Julien C. Solid State Ionics. 1992;53:376–382. doi: 10.1016/0167-2738(92)90403-C. [DOI] [Google Scholar]
- Atuchin V. V. Gavrilova T. A. Kostrovsky V. G. Pokrovsky L. D. Troitskaia I. B. Inorg. Mater. 2008;44:622. doi: 10.1134/S0020168508060149. [DOI] [Google Scholar]
- Hard F. Gerand B. Nowogrocki G. Figlarz M. Solid State Ionics. 1989;32:84–90. doi: 10.1016/0167-2738(89)90206-3. [DOI] [Google Scholar]
- Sreedhara M. B. Matte H. R. Govindaraj A. Rao C. N. R. Chem.–Asian J. 2013;8:2430–2435. doi: 10.1002/asia.201300470. [DOI] [PubMed] [Google Scholar]
- Madhavi V. Kondaiah P. Rayudu S. S. Hussain O. M. Uthanna S. Mater. Express. 2013;3:135–143. doi: 10.1166/mex.2013.1114. [DOI] [Google Scholar]
- Chiang T. H. Yeh H. C. J. Alloys Compd. 2014;585:535–541. doi: 10.1016/j.jallcom.2013.09.137. [DOI] [Google Scholar]
- Dupin J. C. Gonbeau D. Vinatier P. Levasseur A. Phys. Chem. Chem. Phys. 2000;2:1319–1324. doi: 10.1039/A908800H. [DOI] [Google Scholar]
- Diaz-Droguett D. E. Fuenzalida V. M. J. Nanosci. Nanotechnol. 2010;10:6694–6706. doi: 10.1166/jnn.2010.2520. [DOI] [PubMed] [Google Scholar]
- Jensen L. Schatz G. C. J. Phys. Chem. A. 2006;110:5973–5977. doi: 10.1021/jp0610867. [DOI] [PubMed] [Google Scholar]
- Kavitha C. Bramhaiah K. John N. S. Ramachandran B. E. Chem. Phys. Lett. 2015;629:81–86. doi: 10.1016/j.cplett.2015.04.026. [DOI] [Google Scholar]
- Bramhaiah K. Singh V. N. Kavitha C. John N. S. J. Nanosci. Nanotechnol. 2017;17:2711–2719. doi: 10.1166/jnn.2017.13431. [DOI] [PubMed] [Google Scholar]
- Kavitha C. Bramhaiah K. John N. S. Aggarwal S. R. Soc. Open Sci. 2017;4:170353. doi: 10.1098/rsos.170353. [DOI] [PMC free article] [PubMed] [Google Scholar]
- Cong S. Yuan Y. Chen Z. Hou J. Yang M. Su Y. Zhang Y. Li L. Li Q. Geng F. Zhao Z. Nat. Commun. 2015;6:7800. doi: 10.1038/ncomms8800. [DOI] [PMC free article] [PubMed] [Google Scholar]
- Park H. K. Yoon J. K. Kim K. Langmuir. 2006;22:1626–1629. doi: 10.1021/la052559o. [DOI] [PubMed] [Google Scholar]
- Hildebrandt P. Stockburger M. J. Phys. Chem. 1984;88:5935–5944. doi: 10.1021/j150668a038. [DOI] [Google Scholar]
- Liang X. Wang Y. S. You T. T. Zhang X. J. Yang N. Wang G. S. Yin P. G. Nanoscale. 2017;9:8879–8888. doi: 10.1039/C7NR01891F. [DOI] [PubMed] [Google Scholar]
- Tan E. Z. Yin P. G. You T. T. Wang H. Guo L. ACS Appl. Mater. Interfaces. 2012;4:3432–3437. doi: 10.1021/am3004126. [DOI] [PubMed] [Google Scholar]
- Tan X. Melkersson J. Wu S. Wang L. Zhang J. ChemPhysChem. 2016;17:2630–2639. doi: 10.1002/cphc.201600286. [DOI] [PubMed] [Google Scholar]
- Klimov V. I. J. Phys. Chem. B. 2006;110:16827–16845. doi: 10.1021/jp0615959. [DOI] [PubMed] [Google Scholar]
Associated Data
This section collects any data citations, data availability statements, or supplementary materials included in this article.


