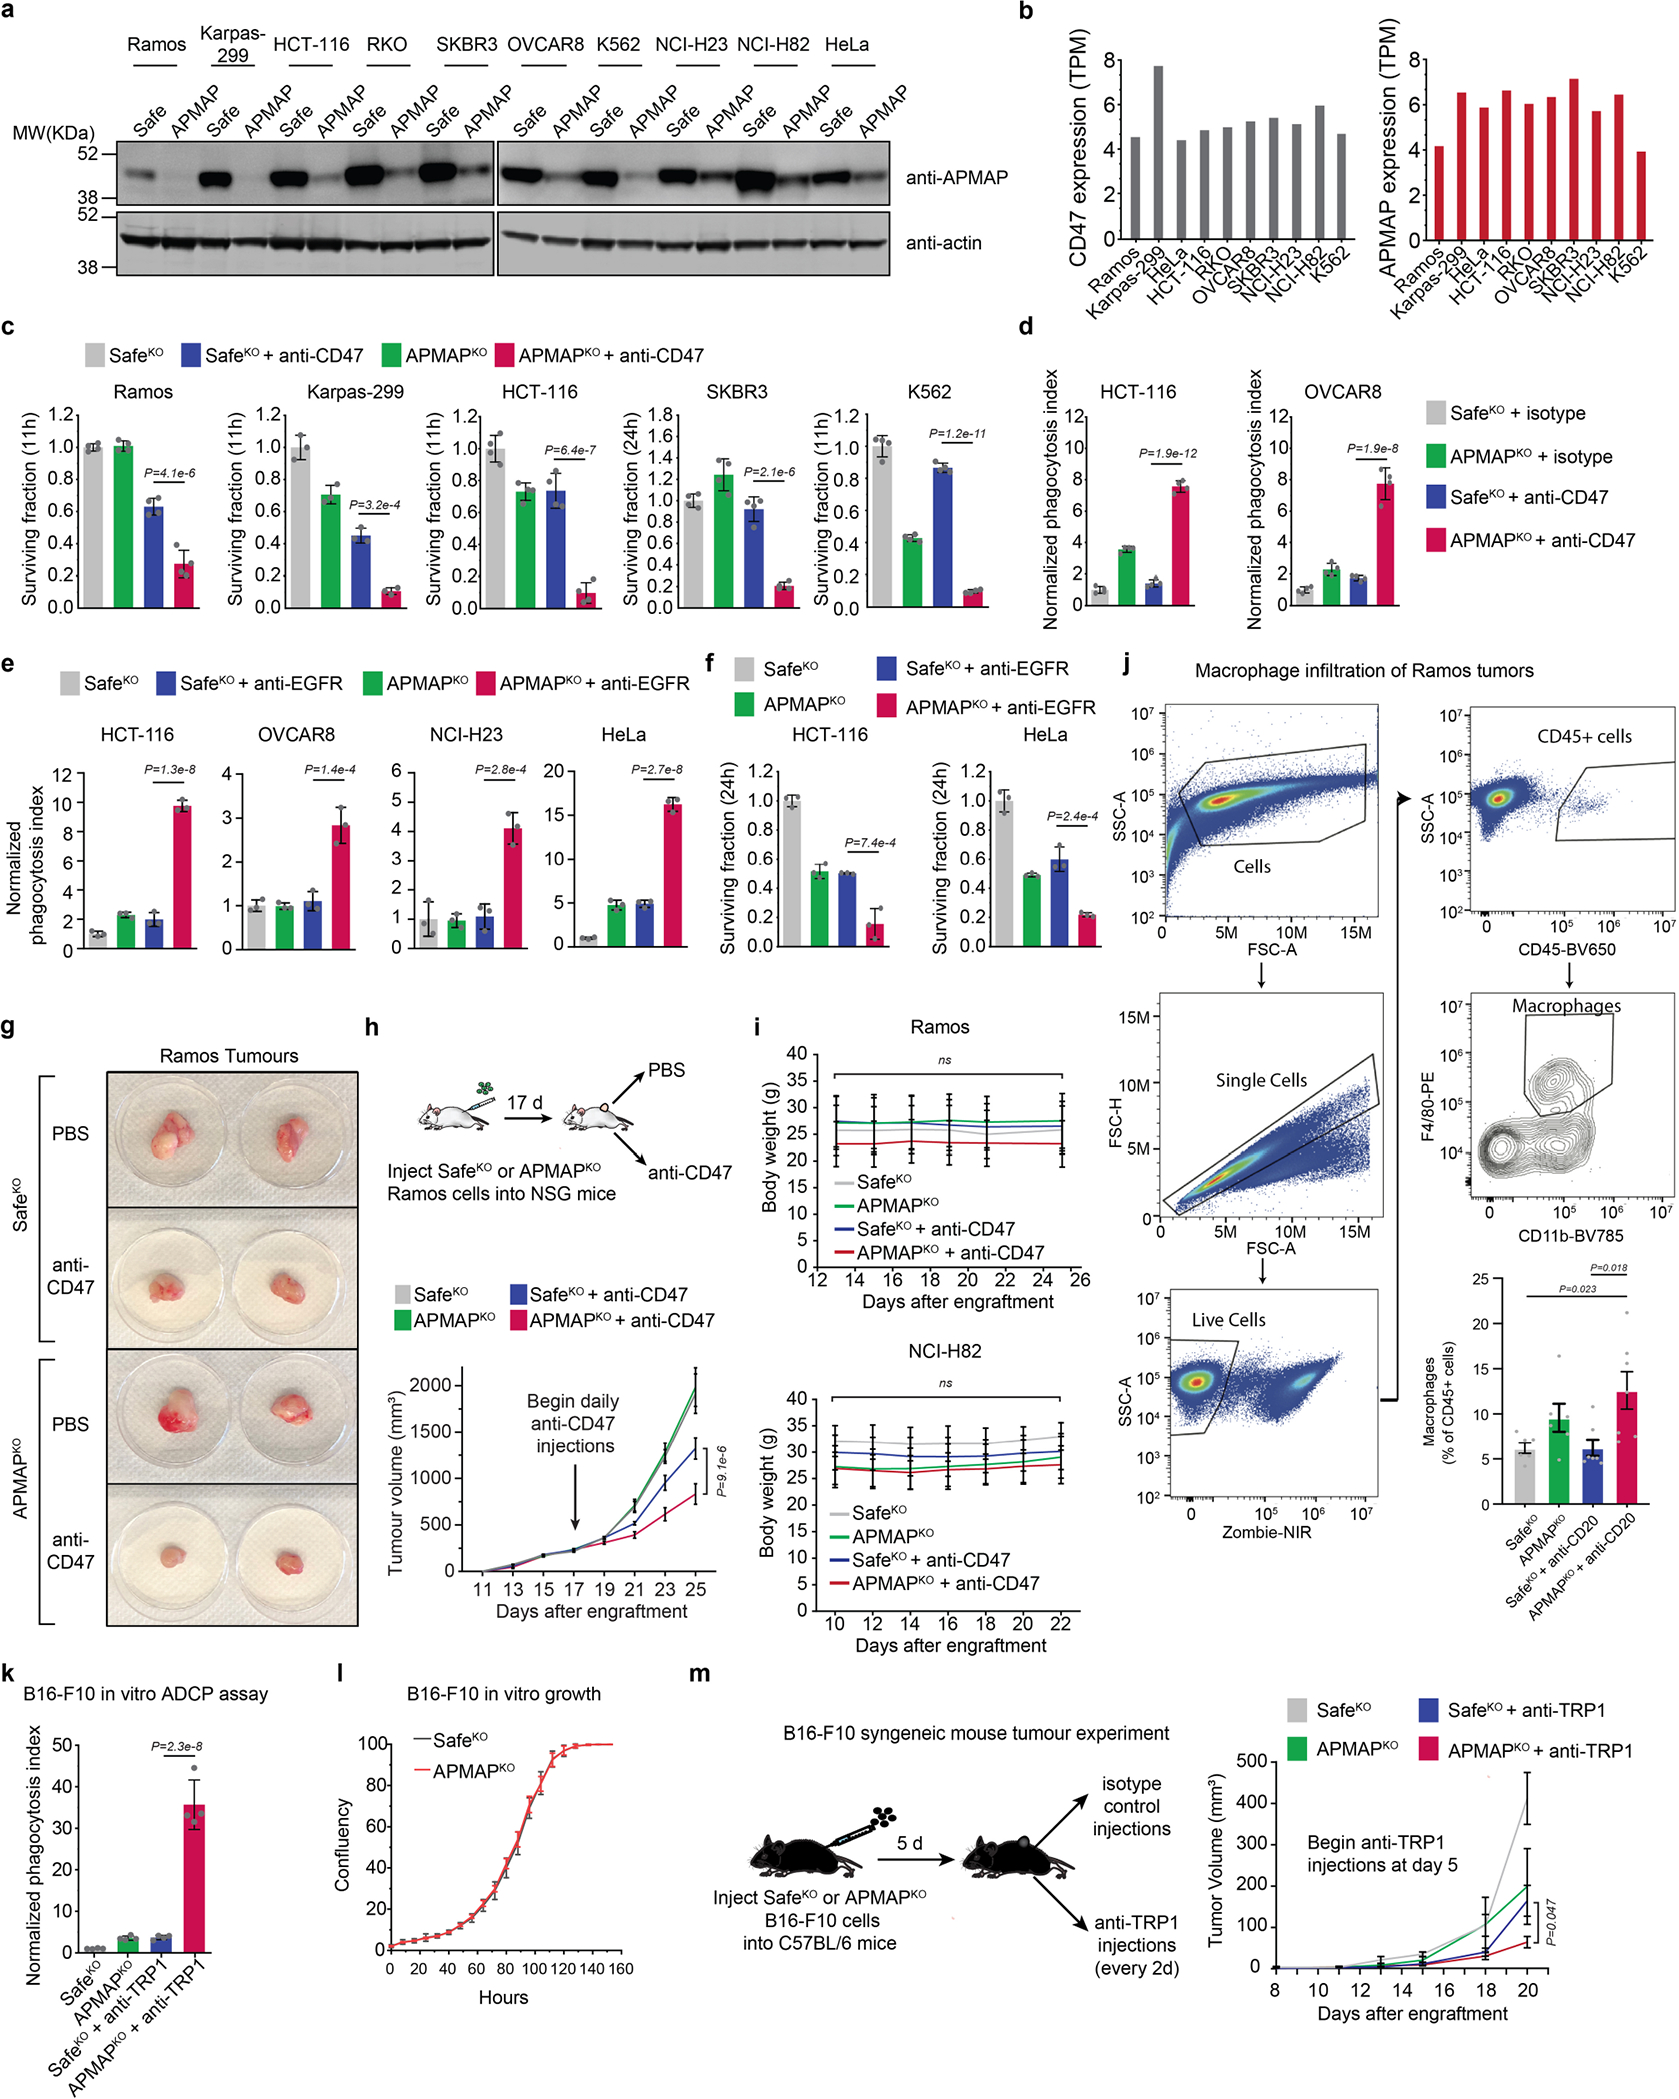
Extended Data Fig. 6 |. Evaluation of APMAP role in ADCP across diverse cancer cell lines and in syngeneic mice.

a, Levels of APMAP in ten cell lines measured by Western blot. All cell lines stably express Cas9 and were transduced with indicated sgRNAs. Actin served as loading control. Western blot to confirm knockout across all ten cell lines on one gel was performed once. For gel source data, see Supplementary Figure 1. b, Expression levels (TPM) of CD47 and APMAP in ten cell lines (data from CCLE). c, Survival measurements of selected (GFP+) cell lines in Fig. 3a, measured as percentage of GFP remaining after indicated number of hours of incubation with J774 macrophages in presence or absence of anti-CD47. Data represent mean +/− s.d. (n = 4 cell culture wells, except Karpas-299 (n = 3)). One-way ANOVA with multiple comparisons correction. d, Phagocytosis assays as in Fig. 3a, but with isotype control antibodies. Data represent mean +/− s.d. (n = 4 cell culture wells). One-way ANOVA with Bonferroni correction. e, Phagocytosis assay for uptake of pHrodo-labelled cells for indicated Cas9-expressing cell lines expressing indicated sgRNAs by J774 macrophages in the presence or absence of anti-EGFR/cetuximab antibodies. Phagocytosis index normalized to control (SafeKO) cells without anti-EGFR. Data represent mean +/− s.d. (n = 3 cell culture wells). One-way ANOVA with Bonferroni correction. f, Survival measurements of selected (GFP+) cell lines in Extended Data Fig. 6e, measured as percentage of GFP remaining after indicated number of hours of incubation with J774 macrophages in presence or absence of anti-EGFR. Data represent mean +/− s.d. (n = 3 cell culture wells). One-way ANOVA with Bonferroni correction. g, Representative photographs depicting Ramos tumours of indicated genotype extracted from NSG mice at 25 d following transplantation. h, SafeKO or APMAPKO Ramos cells were transplanted into NSG mice and allowed to form tumours. Mice were treated with anti-CD47 (B6H12, BioXCell) or PBS daily starting 17 d following transplantation, and tumour size was measured every 2 d. Data represent mean +/− s.e.m. (n = 5 (SafeKO groups) and 6 (APMAPKO groups)). Two-way ANOVA with Tukey correction (comparison between SafeKO/anti-CD47 and APMAPKO/anti-CD47 for final timepoint is shown). I, Mouse weights in Ramos (top) and NCI-H82 (bottom) xenograft experiments (Extended Data Fig. 6h, Fig. 3b). Data represent mean +/− s.d. Two-way ANOVA with Bonferroni correction (n = 5 (all NCI-H82 groups and Ramos SafeKO groups) and 6 (Ramos APMAPKO groups)). P-values are reported for the interaction between treatment groups. j, Single-cell suspensions were prepared from SafeKO or APMAPKO Ramos tumours treated with PBS or anti-CD20 (from experiment in Fig. 3c) and analysed for the presence of macrophages (CD45+/F4–80+/Cd11b+) as a percentage of all CD45+ cells. Gating strategy is shown (top/left). Data (bottom right) represent mean +/− s.e.m. (n = 6 (PBS groups) and 7 (antibody-treated groups)). One-way ANOVA with Tukey correction. k, Phagocytosis assay for uptake of pHrodo-labelled B16-F10 cells with indicated genotypes by J774 macrophages in the presence or absence of anti-TRP1 antibodies. Phagocytosis index normalized to control (SafeKO) cells without antibody. Data represent mean +/− s.d. (n = 4 cell culture wells). One-way ANOVA with Bonferroni correction. l, In vitro growth of B16-F10 cells of indicated genotypes, measured using time-lapse microscopy as total confluence per well over 6 d. Data represent mean +/− s.d. (n = 4 cell culture wells). m, SafeKO or APMAPKO B16-F10 cells were transplanted into syngeneic C57BL/6 mice and allowed to form tumours. Mice were treated with anti-TRP1 or mouse IgG2a isotype control antibody daily starting 5 d following transplantation, and tumour size was measured every 2 d. Data represent mean +/− s.e.m. (n = 7 for SafeKO groups, n = 6 for both APMAPKO groups). Two-way ANOVA with Tukey correction (comparison between SafeKO/anti-TRP1 and APMAPKO/anti-TRP1 for final timepoint is shown).
