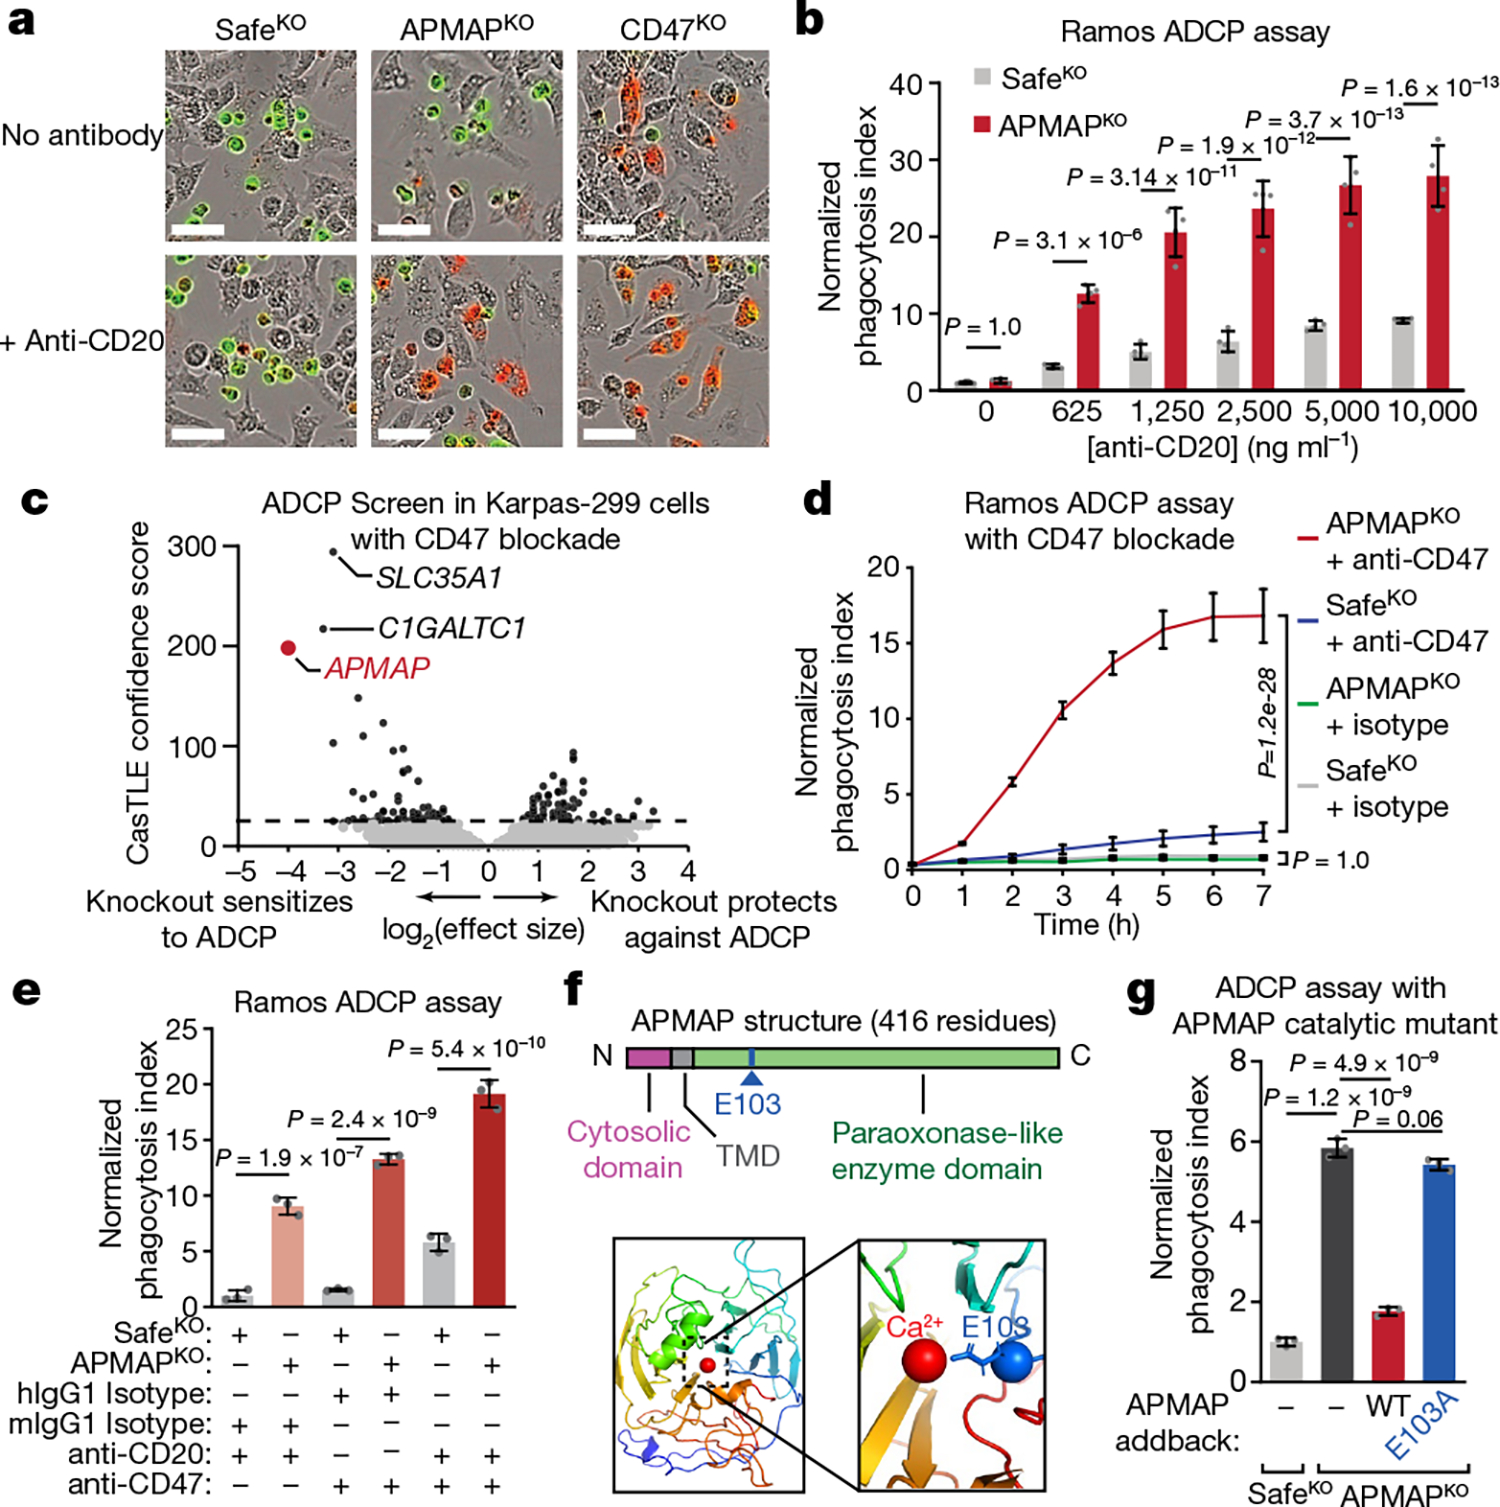
Fig. 2 |. APMAP loss synergizes with monoclonal antibodies and CD47 blockade to increase cancer cell susceptibility to phagocytosis.

a, Images of pHrodo-labelled GFP+ Ramos cells of indicated genotypes after 12 h incubation with J774 macrophages with or without anti-CD20. Scale bars, 50 μm. Representative of three biologically independent experiments. b, Phagocytosis assay for uptake of pHrodo-labelled Ramos cells with indicated genotypes by J774 macrophages with indicated concentrations of anti-CD20, normalized to control (SafeKO) cells in absence of anti-CD20 (n = 4 replicate wells). c, Volcano plot of genome-wide CRISPR knockout screen in Karpas299-Cas9 cells for resistance to treatment with anti-CD47 and macrophages. Dotted line indicates 5% FDR. d, Phagocytosis assay for uptake of pHrodo-labelled Ramos cells with indicated genotypes following incubation with J774 macrophages and anti-CD47 antibodies or mouse isotype control (mIgG1) antibodies, normalized to control (SafeKO) cells with isotype control antibody (n = 3 cell culture wells). e, Phagocytosis assay for uptake of pHrodo-labelled Ramos cells expressing indicated sgRNAs, incubated for 2 h with J774 macrophages and anti-CD20, anti-CD47, or human (hIgG1) or mouse (mIgG1) isotype control antibodies, normalized to signal in control (SafeKO) cells in anti-CD20 or mIgG1-isotype condition (n = 3 cell culture wells). f, Top, schematic of APMAP structure. Bottom left, APMAP homology model (residues 61–407) (Methods). Bottom right, magnified view of catalytic site of APMAP homology model, showing predicted positioning of residue E103 near the catalytic calcium ion. TMD, transmembrane domain. g, Phagocytosis assay for uptake of pHrodo-labelled indicated Ramos-Cas9 cells by J774 macrophages in the presence of anti-CD20 antibodies, normalized to control (SafeKO) cells (n = 3 cell culture wells). In b, d, e, g, data are mean ± s.d. One-way ANOVA (g) or two-way ANOVA (b, d, e) with Bonferroni correction.
