Abstract
Mechanical properties of porous graphene can be effectively tuned by tailoring the nanopore arrangement. Knowledge of the relationship between the porous structure and overall mechanical properties is thus essential for the wide potential applications, and the existing challenge is to efficiently predict and design the mechanical properties of porous graphene due to the diverse nanopore arrangements. In this work, we report on how the SISSO (Sure Independence Screening and Sparsifying Operator) algorithm can be applied to build a bridge between the mechanical properties of porous graphene and the uniform nanopore array. We first construct a database using the strength and work of fracture calculated by large-scale molecular dynamics simulations. Then the SISSO algorithm is adopted to train a predictive model and automatically derive the optimal fitting formulae which explicitly describe the nonlinear structure–property relationships. These expressions not only enable the direct and accurate prediction of targeted properties, but also serve as a convenient and portable tool for inverse design of the porous structure. Compared with other forecasting methods including several popular machine learning algorithms, the SISSO algorithm shows its advantages in both accuracy and convenience.
The SISSO algorithm is adopted to derive explicit formulae describing the structure–property relationship of porous graphene with a uniform nanopore array. This approach can effectively accelerate the mechanical design of porous graphene.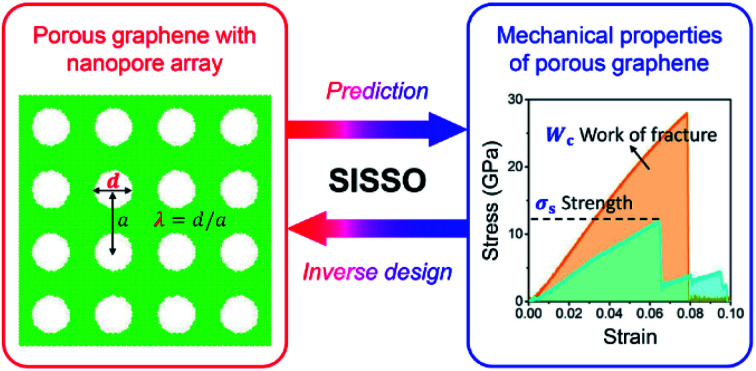
1. Introduction
Introducing nanopores or nanoholes on the two-dimensional graphene surface can efficiently control the electrical,1 thermal,2 and mechanical properties3 of graphene. With the improvement of fabrication technology, several experimental methods, such as electron-beam-drilling,4 nanoscale lithography,5 and chemical synthesis,6 have been developed to precisely tailor the size and arrangement of nanopores on porous graphene, so that nanopores can be designed into an array with customizable geometries.7,8 Porous graphene with a prepared nanopore array has great potential in diverse applications, such as field-effect transistors,7 electrochemical capacitors,9 thermal rectifiers,10 and DNA sequencing technology.11
As one of the most attractive applications, porous graphene has been recently highlighted as a promising material for next-generation filtration systems for seawater desalination12,13 and gas separation.14,15 For filtration applications, a large pressure difference is usually applied between both sides of the membrane to drive the directional motion of molecules. Therefore, porous graphene is required to be strong and tough enough to survive the high-pressure environment. It is well known that the mechanical properties of graphene are degenerated by the introduction of nanopores,3,16,17 although defect-free graphene has ultrahigh elastic modulus and tensile strength.17 Understanding the relationship between the geometries of the nanopore array and the overall mechanical properties of porous graphene can provide significant guidance to the design of porous graphene-based filter membranes with high performance and durability. Traditionally, the expressions of the structure–property relationship can be fitted from the experimental or computational results using some empirical methods and function forms. Although this estimation method using the fitting law is easy to be used in practical applications, errors are unavoidably induced for some problems with high nonlinearity as it is difficult to predefine an optimal function form for fittings. A state-of-the-art approach with high efficiency, reliability, and portability is thus required to find the structure–property relationship for this material.
Considering the diversity of the geometries of a nanopore array, it is very costly to experimentally characterize mechanical properties for all the possible configurations of porous graphene in the design space. Thus, it is desired to find a convenient approach for the efficient prediction of mechanical properties of porous graphene with arbitrary structural designs. All-atom molecular dynamics (MD) simulation, which tracks interactions of each atom in a system over time, can calculate the detailed mechanical properties of graphene-based materials with validated accuracy. Several studies have explored the effects of pore size, pore density, and grain boundaries on the elastic properties and fracture behaviors of porous graphene using the MD simulation method.3,16–18 However, MD simulation as a computational method is normally resource- and time-consuming, which is hard to adapt to the demand of rapid iteration in the design flow. In addition to the forward prediction, another challenge is how to conduct an efficient reverse design, i.e. determine the geometries of the nanopore array for targeted mechanical properties. Recently, Chen et al. proposed a nano-topology optimization method to design the nanostructures with atom-by-atom control.19 This method is still based on MD simulations and integrated with other relatively tedious processes, restricting its applications on the efficient reverse design of porous graphene. Theoretical models in fracture mechanics such as Griffith theory can describe the tensile strength of materials with a preexisting flaw, e.g., a hole or a notch, as a function of structural factors, which can directly guide the reverse mechanical design.20 Unfortunately, it is usually difficult to analyze the effect of multiple pores arranged in an array by using these theoretical models. Moreover, previous studies found that the classic Griffith theory partially fails for a pore diameter smaller than 8 Å.3,18
In recent years, the machine learning (ML) method has been applied to accelerate the design and discovery of materials.21–25 It is confirmed to be extremely efficient in material design problems with high complexity compared with traditional experimental and computational methods. For example, Wan et al. applied ML to search for porous graphene with optimized thermal conductivity.26 Ye et al. utilized a deep neural network to predict the mechanical properties of composites with arbitrary component distributions.27 Xiong et al. extracted descriptions of the mechanical properties of steels based on ML.28 Various ML algorithms have been applied to automatically extract the structure–property relationship. However, to the best of our knowledge, the popular ML algorithms, such as support vector regression, decision tree, random forest regression, and convolutional neutral network, cannot provide explicit expressions for the structure–property relationship as a clear guidance. In this paper, the SISSO (Sure Independence Screening and Sparsifying Operator) algorithm proposed by Ouyang et al.29 is used for the prediction and design of mechanical properties of porous graphene with a periodic pore array. It is one of the ML algorithms with the same processes of data training and testing as other popular ML approaches. It can automatically derive the fitting formulae without predefined function forms for the structure–property relationship, which can break through the restrictions above.
2. Database construction
2.1. Atomic model generation for porous graphene with a uniform nanopore array
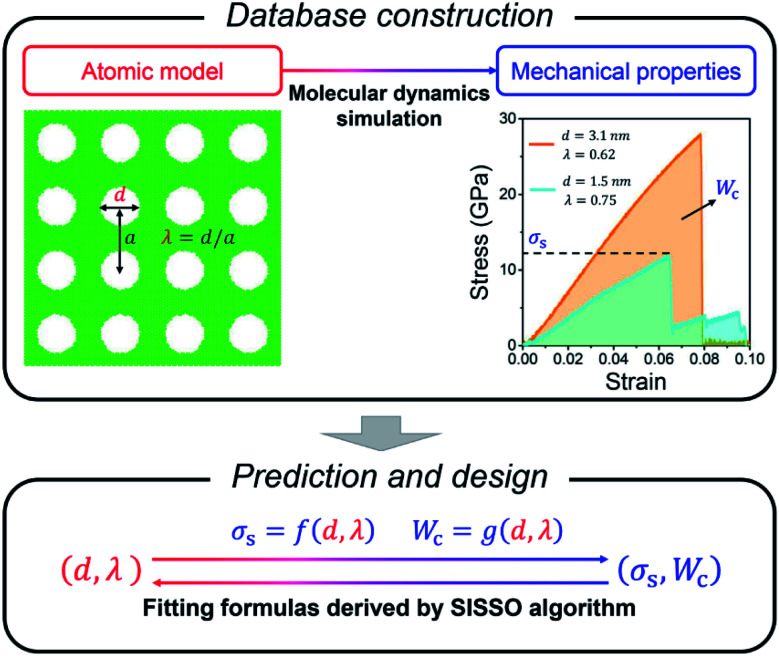
In this paper, we focus on porous graphene with circular nanopores that are uniformly arranged into a square lattice pattern, as shown in Fig. 1. The geometry of such a nanopore array is determined by two independent structural variables, d and λ. d is the pore diameter, and λ is the ratio between d and lattice period a, as depicted in Fig. 1. We here choose λ as one feature since it can be regarded as the measurement of porosity that is more frequently used in porous material systems. For pores arranged in a uniform square array, the porosity can be represented by λ as πλ2/4. Moreover, the ratio between the pore radius and strip width is adopted in the expression of the Griffith model developed for the fracture strength of a strip with a central hole.20 Using the geometry ratio λ as a variable of the SISSO-derived formula can maintain the formal similarity to this classic model. Initially, atomic models of pristine monolayer graphene with a fixed size of 20 nm × 20 nm are constructed with periodic boundary conditions applied, which are as large as possible to satisfy the requirement of a representative volume element (RVE) for infinite materials. Then pores with diameter d are introduced by calculating the coordinates of the pore centers and then removing the carbon atoms around the pore centers within circular domains of the diameter d. The connectivity of the remaining domains is guaranteed and no crack is allowed in the initial configurations. For the n × n pore array, the lattice number n can be calculated by using L/a = Lλ/d, where L is the length of the square simulation area. We make grids on the lattice number and porosity instead of d and λ to generate a database for the convenience of atomic model construction due to the fixed width of atomic models. Then corresponding values of d and λ can be derived from the above relationships. The intervals of lattice number and porosity in the sampling grids are 1 and 0.05, respectively. The lattice number and porosity are distributed between [1, 10] and [0.05, 0.5], respectively. Thus, d varies from ∼0.5 nm to ∼16 nm and λ varies from ∼0.25 to ∼0.8 in the database.
Fig. 1. Framework of the proposed SISSO-assisted approach for the prediction and design of mechanical properties of porous graphene.
2.2. Calculations of mechanical properties by molecular dynamics simulations
MD simulations are performed via the Large-scale Atomic/Molecular Massively Parallel Simulator (LAMMPS)30 to calculate the mechanical properties of porous graphene samples generated above. The interactions between carbon atoms are described by the adaptive intermolecular reactive empirical bond order (AIREBO) potential,31 which has been widely used and confirmed in graphene-based material systems.32–34 The original parameter of the carbon–carbon cutoff distance in the potential is modified to be 2.0 Å to avoid a known non-physical post-hardening phenomenon.35,36 The timestep is set at 0.5 fs during the overall simulation. The graphene sheet is initially aligned in an atomic plane. All the atomic models are first optimized by using the conjugate gradient minimization algorithm, followed by the equilibrium process under an NPT ensemble at 300 K and 0 atm for 100 ps. The uniaxial elongation is performed along the armchair direction of graphene. During the uniaxial tension process, the simulation box deforms along the tensile direction with a given strain rate of 10−4 ps−1. Meanwhile, the simulation box shows fluctuating sizes perpendicular to the tensile direction according to the barostat (0 atm), which releases stress to simulate the typical uniaxial tension process. All atomic coordinates are remapped with the deformation of the simulation cell as the periodic boundary condition. No restrictions are applied to the movement of atoms in any direction. The overall temperature of the simulation systems remains at 300 K during the uniaxial stretch. The atomic-level tensile stress is calculated via the virial theorem and averaged over the entire simulation cell. In the stress calculation, the thickness of graphene is assumed to be 3.4 Å based on the literature.37
Stress–strain (σ–ε) curves are obtained with increasing uniaxial tension until the porous graphene samples are destroyed and completely lose their load-bearing capacities, where σ and ε are the normal stress and engineering strain (i.e. the ratio of the elongation to the initial length) along the tensile direction. Strength and work of fracture are chosen as the targeted properties in this study. As shown in Fig. 1, the strength σs is taken from the peak value of the σ–ε curve, and the work of fracture Wc can be evaluated by using the area under the σ–ε curve as 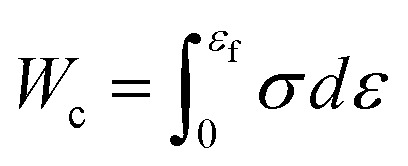 . Here, εf is the ultimate fracture strain where porous graphene is destroyed by tension. The higher strength and work of fracture indicate stronger and tougher porous graphene, which is desirable in many applications. Mechanical properties of pristine graphene without defects and holes are first examined. The calculated strength and ultimate strain along the armchair direction are 94 GPa and 0.12, respectively, showing good agreement with reported MD results.38 Besides, the simulation results agree well with the reported experimental values of strength of 60–99 GPa39,40 and Young's modulus of ∼1 TPa,39 respectively. This indicates that our model settings and the potential file adopted in MD simulations are reliable for the following mechanical simulations of porous graphene.
2.3. Database structure
After atomic model generations and MD simulations, we construct a database containing 95 data samples for the SISSO model training, limited by our computing resource. Each data sample comprises two independent variables, d and λ, as well as two associated targeted properties, the strength and work of fracture of porous graphene. The two variables are also termed as two features in ML.
3. SISSO algorithm and implementation
3.1. Multi-task SISSO algorithm
Multi-task SISSO algorithm29 is employed to efficiently provide the appropriate fitting formulae without predefined function forms for the nonlinear structure–property relationship. Using these formulae obtained, prediction and inverse design tasks can be easily achieved. The formulae automatically derived by the SISSO model are highly portable, showing great convenience in practical engineering applications. Here we focus on the effect of the structural geometries of the square pore array on the mechanical properties of porous graphene, including the two independent features d and λ. More variables can be generated by the combinations of d and λ and added into the SISSO model. For conventional ML analysis, we should perform the feature (variable) selection before model training when too many variables exist to avoid overfitting. In fact, here we manually screen the two independent variables from a geometrical view, which is equivalent to the feature selection process. Many previous studies have verified the applicability of SISSO algorithm for diverse problems with multiple variables.29,41 More variables that determine the mechanical properties, such as the size of graphene sheets42 and temperature,43 could be considered in future studies.
The SISSO algorithm combines sure independence screening (SIS) with the sparsifying operator (SO) to select a subspace of descriptors with the largest linear correlation with the targeted property. SIS constructs descriptors by iteratively applying a set of algebraic operators Θ on the two primary features (termed Ψ0), and then the SO evaluates all possible combinations of SIS-constructed descriptors and yields the optimal solution relying on the L0 regularization, which penalizes the number of nonzero coefficients. Multi-task SISSO algorithm can search for descriptors that predict multiple targets. Detailed parameter settings of these algorithms are discussed in the next section.
3.2. k-fold cross-validation
For the general implementation of ML, a dataset should be split into two groups, a training set to fit the model and a testing set to evaluate the model, which avoids overfitting. However, the train-test-split method is not suitable for the small database in this study that only contains 95 samples. The material data that can be obtained in the actual problems are commonly limited (only a hundred or even dozens). Thus, it is a big issue to find a fundamental interplay and establish a predictive model using a small database via ML approaches. The k-fold cross-validation test is thus adopted to avoid overfitting for the following implementation of SISSO algorithm.
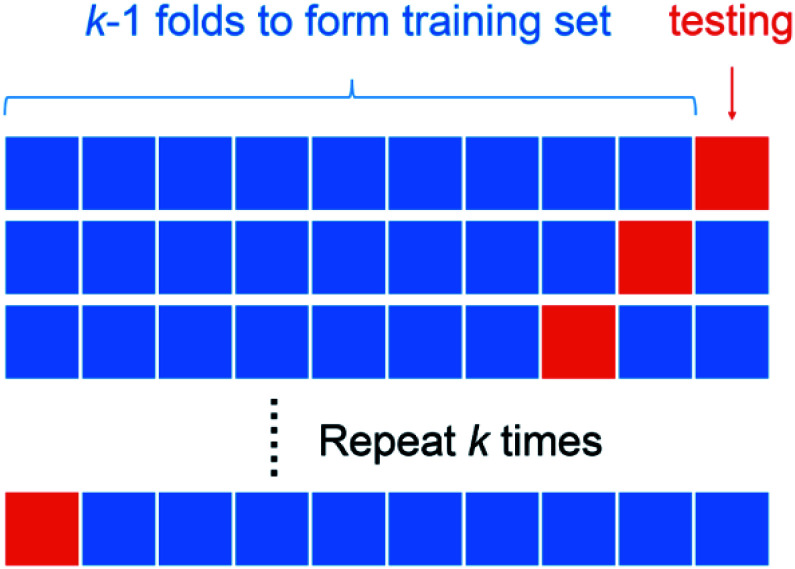
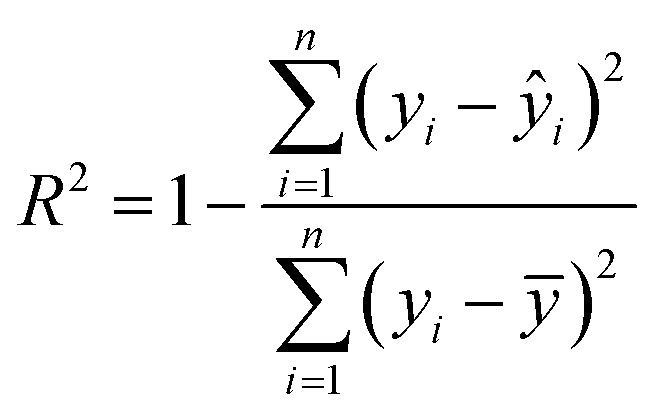
The idea of the k-fold cross-validation test is illustrated in Fig. 2. A small dataset is randomly and evenly divided into k groups of samples, termed folds. (k − 1) folds are selected as the training set to train a SISSO model, and the one fold remaining serves as the testing set to evaluate the trained model. This process will be repeated k times and each time a different fold is selected as the testing set. The cross-validation performance is measured by finally averaging the R2 for these k-times trained models. R2 is expressed as
 |
1 |
where yi and ŷi are the real value and predicted result of the sample i, respectively, and ȳ is the average of all the real values. A higher R2 means better performance, and the R2 for a perfect model is equal to 1. By using this method, each data point in the small database can be fully utilized for model training and more information can be gained from the limited data, which enhances the performance of the trained SISSO model in our study. Such processing has widely been confirmed to achieve effective and accurate ML models with a small database (dozens to hundreds of data points) in many previous studies.44,45 10-fold cross-validation suggested by the empirical evidence is utilized here. Since strength and work of fracture are considered in this work, the averaged R2 of two targets is used for comprehensive performance evaluation of SISSO model in the following discussion.
Fig. 2. Schematic of the k-fold cross-validation test.
4. Results and discussion
4.1. Atomic simulation results
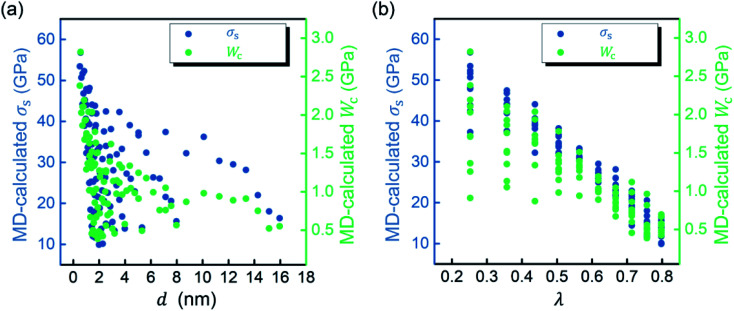
The strength and work of fracture obtained from MD simulations for all porous graphene samples are shown in Fig. 3. It is observed that introducing the pores causes the degeneration of strength when compared with the value of pristine graphene as revealed by many experimental studies.46 Overall, the strength and work of fracture increase with decreasing d and λ, but show more variability at a lower d and λ. For example, the strength varies over a wide range from ∼10 GPa to ∼53 GPa with the variation as high as ∼430% at d = ∼2 nm. The largest and smallest work of fracture are ∼0.9 GPa and ∼2.8 GPa at λ = ∼0.25, respectively, showing a significant variation of ∼211%. Decreasing d or λ individually may not always enhance the mechanical performance of porous graphene. This indicates that the mechanical properties of porous graphene strongly depend on the integrated geometries of the nanopore array, motivating the present study to explore a convenient and accurate tool for the prediction and description of the structure–property relationship.
Fig. 3. Strength (σs) and work of fracture (Wc) calculated by molecular dynamics (MD) simulations versus (a) d and (b) λ. Here, d and λ describe the geometry of porous graphene with a square pore array and circular pores. d is the pore diameter and λ is the ratio between pore diameter and lattice period.
4.2. Performance of SISSO model for predictions of mechanical properties
The SISSO algorithm29 is introduced to automatically generate the optimal fitting formulae which describe the relationship between the geometries of the nanopore array and overall mechanical properties. In this work, we applied
| Θ = (+, −, ×, ÷, exp, ln, √, −1, 2, 3) | 2 |
on Ψ0 one, two three, and four times to generate four descriptor spaces Ψ1, Ψ2, Ψ3 and Ψ4, respectively. The size of the descriptor space grows rapidly with the number of times of Θ application. Only 20 descriptors have been constructed by SIS in Ψ1, while around 645 million descriptors exist in Ψ4. Besides, SO searches for the Ω-tuples of descriptors in each space maximize the value of R2. The values of Ω are set as 1, 2, 3, and 4 for examinations in this work.
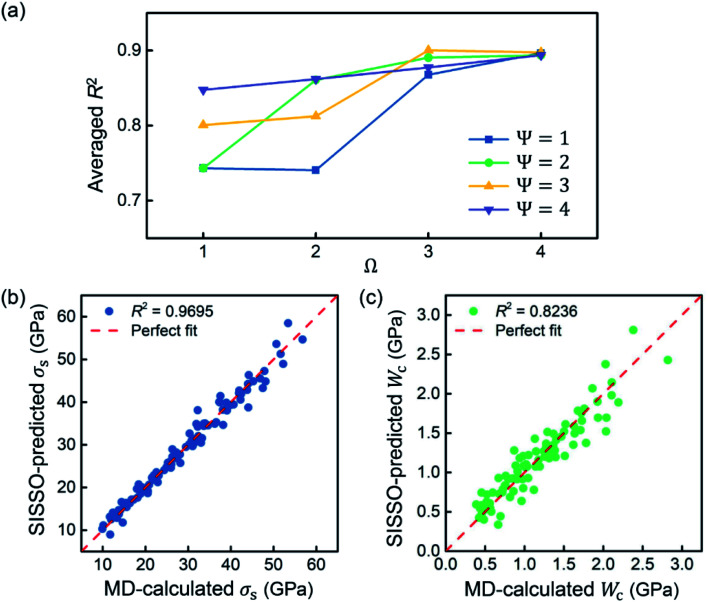
In general, a simpler model with smaller Ψ and Ω but greater predictive power is preferred to avoid overfitting, and it is easier to use in practical applications. Based on comparisons between the performance under different Ψ and Ω shown in Fig. 4a, Ψ = 1 and Ω = 4 are suggested to be sufficient for prediction accuracy, which are taken for the generation of fitting formulae in this study. The 10-fold cross-validation reveals that the best descriptors for predicting strength and work of fracture are λ, 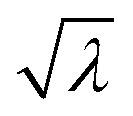 , d−1, and λ/d. The final-obtained optimal fitting formulae follow the forms as
 |
3 |
 |
4 |
Fig. 4. (a) Performance of the SISSO model with different values of Ψ and Ω. Predictions of (b) strength (σs) and (c) work of fracture (Wc) by using the fitting formulae derived from the SISSO model against real values calculated by molecular dynamics (MD) simulations.
The fitting parameters pi and qi (i = 1, …, 5) are listed in Table 1. To balance the dimensions between both the sides, these fitting parameters in eqn (3) and (4) should have units. Although the physical meanings of these units of the fitting parameters remain unclear, the fitting formulae obtained by the SISSO model can be still of great significance to the direct predictions of targeted properties for practical engineering applications.
Parameters of fitting formulae generated by the SISSO model.
| i = 1 | i = 2 | i = 3 | i = 4 | i = 5 | |
|---|---|---|---|---|---|
| p i | −226.1 GPa | 263.3 GPa | 20.86 GPa nm | −43.50 GPa nm | −37.61 GPa |
| q i | −12.82 GPa | 17.36 GPa | 1.585 GPa nm | −2.477 GPa nm | −4.679 GPa |
The strength and work of fracture predicted from eqn (3) and (4) are plotted against the MD-calculated results in Fig. 4b and c, respectively, which are uniformly distributed within a narrow range near the diagonal in a dashed line representing the perfect prediction. The R2 for the predictions of strength and work of fracture are 0.9695 and 0.8236, respectively. The average R2 of the SISSO model is 0.8966. Hair et al. proposed a rule of thumb that R2 values of 0.75, 0.50 and 0.25 are described as substantial, moderate and weak, respectively.47 Thus, the SISSO model with R2 > 0.8 here can guarantee the performance in most application scenarios. It is believed that these equations generated from the SISSO model provide accurate descriptions of the nonlinear structure–property relationship for the design of porous graphene.
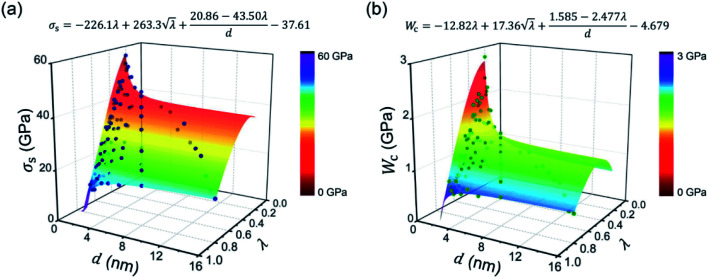
We depict the function surfaces of eqn (3) and (4) in Fig. 5a and b, respectively, which agree well with the distributions of the original data points. It is observed that the strength and work of fracture are not monotonic functions of d or λ, and the effects of d and λ are coupled due to the existence of λ/d in their expressions. Since the parameters p3, p4 and q3, q4 have opposite signs, σs and Wc decrease with increasing d at a small λ, while they show inverse evolutions at a large λ. At λ ≈ 0.48 and λ ≈ 0.64, the d-involved terms are eliminated from the expressions of σs and Wc, respectively. For these cases, σs and Wc are insensitive to the varying pore size. In addition, σs and Wc increase with λ at a small d, while they show optimized values within the λ ranging from 0 to 1 at a large d. It can be clearly seen from Fig. 5 that σs and Wc show their peaks at the regions with small d and λ, while roughly exhibiting decreasing tendencies with d and λ in general. This phenomenon revealed by the two formulae is reasonable since many studies have verified that more pores/defects induced in graphene would cause the deterioration of mechanical properties.3,46
Fig. 5. Function surfaces of (a) strength (σs) and (b) work of fracture (Wc) generated from the SISSO model. The distributions of the original data points are also plotted. Here, d is the pore diameter and λ is the ratio between the pore diameter and pore period.
4.3. Applications of SISSO model for the inverse design of mechanical properties
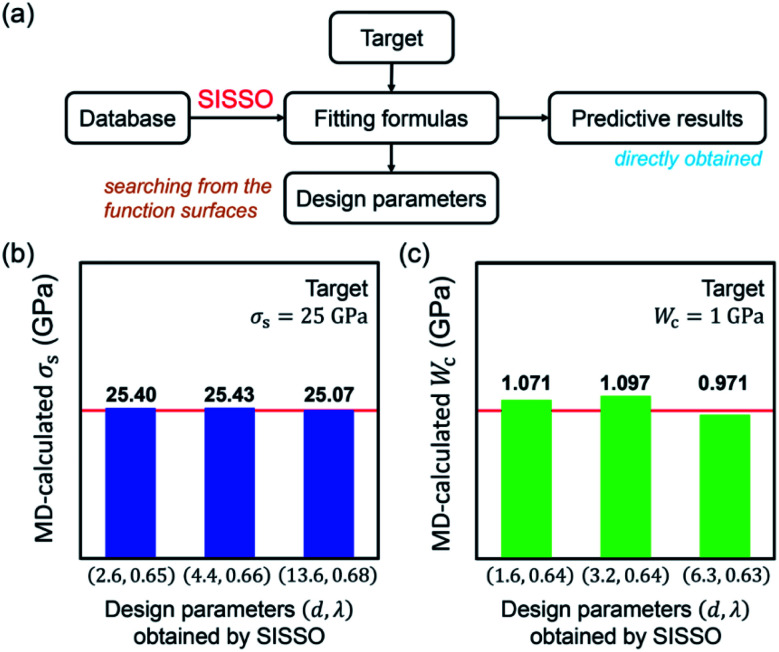
As long as the fitting formulae are derived, inverse structural design of the nanopore array could be convenient. Eqn (3) and (4) describe the mechanical properties as the functions of geometries of pore arrays, which can also help us to inversely find the specified geometries for the given targeted properties. By using numerical methods, the solutions of λ and d can be easily obtained from the function surfaces of σs and Wc plotted in Fig. 5. The flow chart of the inverse design is plotted in Fig. 6a. For example, take σs = 25 GPa or Wc = 1 GPa as the targeted mechanical properties. There exist multiple combinations of d and λ in the function surfaces that can satisfy the design objectives. We choose three groups of geometrical parameters of the pore array for each target. Then corresponding atomic models are constructed and MD simulations are conducted to verify the accuracy of the design parameters obtained. Fig. 6b and c exhibit the detailed structural features designed for the targets and the MD-calculated results for validations. Obviously, all the porous graphene samples with pore arrays designed by the SISSO model achieve the targeted σs and Wc. Slight errors are observed, which can be accepted since a perfect design is almost impossible in practical situations. This indicates the success of inverse design using the fitting formulae derived by the SISSO model. Compared with some ML approaches for inverse design, such as adaptive learning,21 convolutional neural network,25 and backpropagation,23 the fitting formulae generated by the SISSO model possess tremendous advantages in portability and efficiency, without limitations of the working environment and computing resources.
Fig. 6. (a) Flow chart of the prediction of targeted properties and inverse design of the array structure using the SISSO algorithm. (b and c). Design parameters of the nanopore array obtained by the SISSO model and the validation results calculated by molecular dynamics (MD) simulations for targets σs = 25 GPa and Wc = 1 GPa (red lines), respectively.
4.4. Comparison between SISSO algorithm and other forecasting methods
Furthermore, we chose several other typical forecasting methods available in the python library scikit-learn48 to compare with the SISSO algorithm used in this study to examine the predictive performance (see the ESI† for detailed settings and results of these methods used for comparison).
Linear regression (LR),49 which is one of the most basic and well-understood methods to build a relationship between different quantities, is first employed to fit linear models based on the least squared approximation. Fig. S1a and b† plot the predicted results of LR models in all test sets against the MD-calculated values of strength and work of fracture, respectively. It is found that the linear models cannot predict targeted properties with d and λ well. The averaged R2 is 0.7294, in which R2 = 0.8974 for strength and R2 = 0.5613 for work of fracture. The performance of LR is much worse than that of SISSO algorithm. In general, strong and tough porous graphene materials are needed for many applications, while the proposed linear models perform badly especially in predicting high strength and high work-of-fracture, as observed from the scattered data points in Fig. S1.† This also implies the nonlinear nature of the structure–property relationship studied in this work.
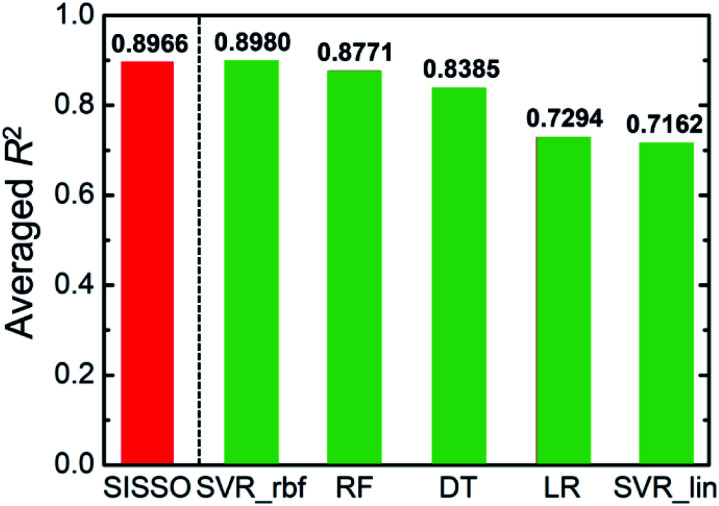
We further introduced four popular ML algorithms, support vector regression with the linear function (SVR_lin) and radial basis function (SVR_rbf), decision tree (DT), as well as random forest regression (RF), to construct more powerful predictive models. Fig. 7 shows the summary of averaged R2 for all the ML algorithms given above and the SISSO model. The value of averaged R2 of SISSO algorithm (0.8966) exceeds those of SVR_lin (0.7162), DT (0.8385) and RF (0.8771), and it is slightly behind that of SVR_rbf (0.8980). The feature importance of two fed features can be given by the RF model. As shown in Fig. S4,† the importance of λ is higher than d in RF. Applying the SISSO algorithm, we know from Fig. 5 that the mechanical properties are more sensitive to λ than d in general, since varying λ brings larger fluctuations in σs and Wc. Such contrast becomes more significant when d is large. The different feature importance of λ compared to d obtained from the SISSO model is similar to that obtained from RF. Besides, the fitting formulae derived by the SISSO model can provide more detailed quantitative information about the relationship between features and targets that cannot be directly obtained by RF. The above comparisons indicate that the SISSO algorithm not only serves as a more convenient and portable tool for the inverse structure design of a pore array, but also predicts mechanical properties with comparable and even higher accuracy, when compared with other ML algorithms.
Fig. 7. Comparison between the averaged R2 of SISSO algorithm used in this study and other forecasting methods, including support vector regression with the linear function (SVR_lin) and radial basis function (SVR_rbf), decision tree (DT), random forest regression (RF) as well as linear regression (LR).
5. Conclusions
In this study, we develop a SISSO-assisted approach for the mechanical design of porous graphene, where strength and work of fracture are set as the targeted properties. The optimal fitting formulae are automatically derived from the SISSO model for the explicit description of the nonlinear structure–property relationship. These expressions not only provide direct and accurate predictions of these targeted properties according to the geometrical arrangement of nanopore array but also serve as a useful guideline for the inverse design of porous structure. Compared with other forecasting methods including several popular ML algorithms, the SISSO algorithm is comparably accurate, portable, efficient and convenient. With reliable data gathered from experimental characterization studies and a larger amount of data samples, the performances like accuracy can be further improved. In addition, this proposed idea can be applied to design other physical properties related to the geometries of the nanopore array for porous two-dimensional materials.
Author contributions
AW – conceptualization, methodology, formal analysis, writing – original draft; HY – conceptualization, funding acquisition, writing – review and editing; ZG – formal analysis, writing – review and editing; JX – methodology, writing – original draft.
Conflicts of interest
There are no conflicts to declare.
Supplementary Material
Acknowledgments
This work was supported by the National Natural Science Foundation of China (Grant No. 11974003) and Fund of State Key Laboratory of Information Photonics and Optical Communications (Beijing University of Posts and Telecommunications), P. R. China (IPOC2020ZT01).
Electronic supplementary information (ESI) available. See DOI: 10.1039/d1na00457c
References
- Şahin H. Ciraci S. Structural, mechanical, and electronic properties of defect-patterned graphene nanomeshes from first principles. Phys. Rev. B: Condens. Matter Mater. Phys. 2011;84:035452. doi: 10.1103/PhysRevB.84.035452. [DOI] [Google Scholar]
- Yarifard M. Davoodi J. Rafii-Tabar H. In-plane thermal conductivity of graphene nanomesh: A molecular dynamics study. Comput. Mater. Sci. 2016;111:247–251. doi: 10.1016/j.commatsci.2015.09.033. [DOI] [Google Scholar]
- Liu Y. Chen X. Mechanical properties of nanoporous graphene membrane. J. Appl. Phys. 2014;115:034303. doi: 10.1063/1.4862312. [DOI] [Google Scholar]
- Storm A. J. Chen J. H. Ling X. S. Zandbergen H. W. Dekker C. Fabrication of solid-state nanopores with single-nanometre precision. Nat. Mater. 2003;2:537–540. doi: 10.1038/nmat941. [DOI] [PubMed] [Google Scholar]
- Bell D. C. Lemme M. C. Stern L. A. Williams J. R. Marcus C. M. Precision cutting and patterning of graphene with helium ions. Nanotechnology. 2009;20:455301. doi: 10.1088/0957-4484/20/45/455301. [DOI] [PubMed] [Google Scholar]
- Bieri M. Treier M. Cai J. Aït-Mansour K. Ruffieux P. Gröning O. Gröning P. Kastler M. Rieger R. Feng X. Porous graphenes: two-dimensional polymer synthesis with atomic precision. Chem. Commun. 2009:6919–6921. doi: 10.1039/B915190G. [DOI] [PubMed] [Google Scholar]
- Bai J. Zhong X. Jiang S. Huang Y. Duan X. Graphene nanomesh. Nat. Nanotechnol. 2010;5:190–194. doi: 10.1038/nnano.2010.8. [DOI] [PMC free article] [PubMed] [Google Scholar]
- Schmidt M. E. Iwasaki T. Muruganathan M. Haque M. Van Ngoc H. Ogawa S. Mizuta H. Structurally Controlled Large-Area 10 nm Pitch Graphene Nanomesh by Focused Helium Ion Beam Milling. ACS Appl. Mater. Interfaces. 2018;10:10362–10368. doi: 10.1021/acsami.8b00427. [DOI] [PubMed] [Google Scholar]
- Yu X. Park H. S. Sulfur-incorporated, porous graphene films for high performance flexible electrochemical capacitors. Carbon. 2014;77:59–65. doi: 10.1016/j.carbon.2014.05.002. [DOI] [Google Scholar]
- Wang H. Hu S. Takahashi K. Zhang X. Takamatsu H. Chen J. Experimental study of thermal rectification in suspended monolayer graphene. Nat. Commun. 2017;8:15843. doi: 10.1038/ncomms15843. [DOI] [PMC free article] [PubMed] [Google Scholar]
- Schneider G. F. Kowalczyk S. W. Calado V. E. Pandraud G. Zandbergen H. W. Vandersypen L. M. K. Dekker C. DNA Translocation through Graphene Nanopores. Nano Lett. 2010;10:3163–3167. doi: 10.1021/nl102069z. [DOI] [PubMed] [Google Scholar]
- Cohen-Tanugi D. Grossman J. C. Water Desalination across Nanoporous Graphene. Nano Lett. 2012;12:3602–3608. doi: 10.1021/nl3012853. [DOI] [PubMed] [Google Scholar]
- Celebi K. Buchheim J. Wyss R. M. Droudian A. Gasser P. Shorubalko I. Kye J.-I. Lee C. Park H. G. Ultimate Permeation Across Atomically Thin Porous Graphene. Science. 2014;344:289. doi: 10.1126/science.1249097. [DOI] [PubMed] [Google Scholar]
- Jiang D.-e. Cooper V. R. Dai S. Porous Graphene as the Ultimate Membrane for Gas Separation. Nano Lett. 2009;9:4019–4024. doi: 10.1021/nl9021946. [DOI] [PubMed] [Google Scholar]
- Sun C. Zhu S. Liu M. Shen S. Bai B. Selective Molecular Sieving through a Large Graphene Nanopore with Surface Charges. J. Phys. Chem. Lett. 2019;10:7188–7194. doi: 10.1021/acs.jpclett.9b02715. [DOI] [PubMed] [Google Scholar]
- Cohen-Tanugi D. Grossman J. C. Mechanical Strength of Nanoporous Graphene as a Desalination Membrane. Nano Lett. 2014;14:6171–6178. doi: 10.1021/nl502399y. [DOI] [PubMed] [Google Scholar]
- Hu L. Wyant S. Muniz A. R. Ramasubramaniam A. Maroudas D. Mechanical behavior and fracture of graphene nanomeshes. J. Appl. Phys. 2015;117:024302. doi: 10.1063/1.4905583. [DOI] [Google Scholar]
- Zhang T. Li X. Kadkhodaei S. Gao H. Flaw Insensitive Fracture in Nanocrystalline Graphene. Nano Lett. 2012;12:4605–4610. doi: 10.1021/nl301908b. [DOI] [PubMed] [Google Scholar]
- Chen C.-T. Chrzan D. C. Gu G. X. Nano-topology optimization for materials design with atom-by-atom control. Nat. Commun. 2020;11:3745. doi: 10.1038/s41467-020-17570-1. [DOI] [PMC free article] [PubMed] [Google Scholar]
- Anderson T. L., Fracture Mechanics: Fundamentals and Applications, CRC press, Boca Raton, FL, 1991 [Google Scholar]
- Hanakata P. Z. Cubuk E. D. Campbell D. K. Park H. S. Accelerated search and design of stretchable graphene kirigami using machine learning. Phys. Rev. Lett. 2018;121:255304. doi: 10.1103/PhysRevLett.121.255304. [DOI] [PubMed] [Google Scholar]
- Gu G. X. Chen C.-T. Richmond D. J. Buehler M. J. Bioinspired hierarchical composite design using machine learning: simulation, additive manufacturing, and experiment. Mater. Horiz. 2018;5:939–945. doi: 10.1039/C8MH00653A. [DOI] [Google Scholar]
- Chen C.-T. Gu G. X. Generative Deep Neural Networks for Inverse Materials Design Using Backpropagation and Active Learning. Adv. Sci. 2020;7:1902607. doi: 10.1002/advs.201902607. [DOI] [PMC free article] [PubMed] [Google Scholar]
- Xiong J. Zhang T.-Y. Shi S.-Q. Machine learning prediction of elastic properties and glass-forming ability of bulk metallic glasses. MRS Commun. 2019;9:576–585. doi: 10.1557/mrc.2019.44. [DOI] [Google Scholar]
- Gu G. X. Chen C.-T. Buehler M. J. De novo composite design based on machine learning algorithm. Extreme Mech. Lett. 2018;18:19–28. doi: 10.1016/j.eml.2017.10.001. [DOI] [Google Scholar]
- Wan J. Jiang J.-W. Park H. S. Machine learning-based design of porous graphene with low thermal conductivity. Carbon. 2020;157:262–269. doi: 10.1016/j.carbon.2019.10.037. [DOI] [Google Scholar]
- Ye S. Li B. Li Q. Zhao H.-P. Feng X.-Q. Deep neural network method for predicting the mechanical properties of composites. Appl. Phys. Lett. 2019;115:161901. doi: 10.1063/1.5124529. [DOI] [Google Scholar]
- Jie X. Tong-Yi Z. SHI S.-Q. Machine Learning of Mechanical Properties of Steels. Sci. China: Technol. Sci. 2020;63:1247–1255. doi: 10.1007/s11431-020-1599-5. [DOI] [Google Scholar]
- Ouyang R. Curtarolo S. Ahmetcik E. Scheffler M. Ghiringhelli L. M. SISSO: A compressed-sensing method for identifying the best low-dimensional descriptor in an immensity of offered candidates. Phys. Rev. Mater. 2018;2:083802. doi: 10.1103/PhysRevMaterials.2.083802. [DOI] [Google Scholar]
- Plimpton S. Fast Parallel Algorithms for Short-Range Molecular Dynamics. J. Comput. Phys. 1995;117:1–19. doi: 10.1006/jcph.1995.1039. [DOI] [Google Scholar]
- Stuart S. J. Tutein A. B. Harrison J. A. A reactive potential for hydrocarbons with intermolecular interactions. J. Chem. Phys. 2000;112:6472–6486. doi: 10.1063/1.481208. [DOI] [Google Scholar]
- Wei A. Liu Q. Yao H. Li Y. Li Y. Principles and Mechanisms of Strain-Dependent Thermal Conductivity of Polycrystalline Graphene with Varying Grain Sizes and Surface Hydrogenation. J. Phys. Chem. C. 2018;122:19869–19879. doi: 10.1021/acs.jpcc.8b03393. [DOI] [Google Scholar]
- Li Y. Datta D. Li Z. Anomalous mechanical characteristics of graphene with tilt grain boundaries tuned by hydrogenation. Carbon. 2015;90:234–241. doi: 10.1016/j.carbon.2015.04.019. [DOI] [Google Scholar]
- Wei Y. Wu J. Yin H. Shi X. Yang R. Dresselhaus M. The nature of strength enhancement and weakening by pentagon–heptagon defects in graphene. Nat. Mater. 2012;11:759–763. doi: 10.1038/nmat3370. [DOI] [PubMed] [Google Scholar]
- Pei Q. X. Zhang Y. W. Shenoy V. B. A molecular dynamics study of the mechanical properties of hydrogen functionalized graphene. Carbon. 2010;48:898–904. doi: 10.1016/j.carbon.2009.11.014. [DOI] [PubMed] [Google Scholar]
- Shenderova O. A. Brenner D. W. Omeltchenko A. Su X. Yang L. H. Atomistic modeling of the fracture of polycrystalline diamond. Phys. Rev. B: Condens. Matter Mater. Phys. 2000;61:3877–3888. doi: 10.1103/PhysRevB.61.3877. [DOI] [Google Scholar]
- Huang Y. Wu J. Hwang K. C. Thickness of graphene and single-wall carbon nanotubes. Phys. Rev. B: Condens. Matter Mater. Phys. 2006;74:245413. doi: 10.1103/PhysRevB.74.245413. [DOI] [Google Scholar]
- Zhao H. Min K. Aluru N. R. Size and Chirality Dependent Elastic Properties of Graphene Nanoribbons under Uniaxial Tension. Nano Lett. 2009;9:3012–3015. doi: 10.1021/nl901448z. [DOI] [PubMed] [Google Scholar]
- Cao K. Feng S. Han Y. Gao L. Hue Ly T. Xu Z. Lu Y. Elastic straining of free-standing monolayer graphene. Nat. Commun. 2020;11:284. doi: 10.1038/s41467-019-14130-0. [DOI] [PMC free article] [PubMed] [Google Scholar]
- Mazilova T. I. Sadanov E. V. Mikhailovskij I. M. Tensile strength of graphene nanoribbons: An experimental approach. Mater. Lett. 2019;242:17–19. doi: 10.1016/j.matlet.2019.01.051. [DOI] [Google Scholar]
- Bartel C. J. Sutton C. Goldsmith B. R. Ouyang R. Musgrave C. B. Ghiringhelli L. M. Scheffler M. New tolerance factor to predict the stability of perovskite oxides and halides. Sci. Adv. 2019;5:eaav0693. doi: 10.1126/sciadv.aav0693. [DOI] [PMC free article] [PubMed] [Google Scholar]
- Shen Z. Ye H. Zhou C. Kröger M. Li Y. Size of graphene sheets determines the structural and mechanical properties of 3D graphene foams. Nanotechnology. 2018;29:104001. doi: 10.1088/1361-6528/aaa612. [DOI] [PubMed] [Google Scholar]
- Zhao H. Aluru N. Temperature and strain-rate dependent fracture strength of graphene. J. Appl. Phys. 2010;108:064321. doi: 10.1063/1.3488620. [DOI] [Google Scholar]
- Zhang Y. Wen C. Wang C. Antonov S. Xue D. Bai Y. Su Y. Phase prediction in high entropy alloys with a rational selection of materials descriptors and machine learning models. Acta Mater. 2020;185:528–539. doi: 10.1016/j.actamat.2019.11.067. [DOI] [Google Scholar]
- Zou C. Li J. Wang W. Y. Zhang Y. Lin D. Yuan R. Wang X. Tang B. Wang J. Gao X. Integrating data mining and machine learning to discover high-strength ductile titanium alloys. Acta Mater. 2021;202:211–221. doi: 10.1016/j.actamat.2020.10.056. [DOI] [Google Scholar]
- Liu L. Qing M. Wang Y. Chen S. Defects in Graphene: Generation, Healing, and Their Effects on the Properties of Graphene: A Review. J. Mater. Sci. Technol. 2015;31:599–606. doi: 10.1016/j.jmst.2014.11.019. [DOI] [Google Scholar]
- Hair J. F. Ringle C. M. Sarstedt M. PLS-SEM: Indeed a silver bullet. J. Mark. Theory Pract. 2011;19:139–152. doi: 10.2753/MTP1069-6679190202. [DOI] [Google Scholar]
- Pedregosa F. Varoquaux G. Gramfort A. Michel V. Thirion B. Grisel O. Blondel M. Prettenhofer P. Weiss R. Dubourg V. Scikit-learn: Machine learning in Python. J. Mach. Learn. Res. 2011;12:2825–2830. [Google Scholar]
- Montgomery D. C., Peck E. A. and Vining G. G., Introduction to Linear Regression Analysis, John Wiley & Sons, Hoboken, New Jerrsy, 2012 [Google Scholar]
Associated Data
This section collects any data citations, data availability statements, or supplementary materials included in this article.


