

Abstract
Background
Inflammation contributes to poor behavioral, functional, and clinical outcomes in cancer survivors. We examined whether standard cancer treatments—radiation and chemotherapy—led to acute and persistent changes in circulating markers of inflammation in breast cancer patients.
Methods
A total of 192 women diagnosed with early stage breast cancer provided blood samples before and after completion of radiation and/or chemotherapy and at 6-, 12-, and 18-month posttreatment follow-ups. Samples were assayed for circulating inflammatory markers, including tumor necrosis factor-α (TNF-α) and interleukin (IL)–6, downstream markers of their activity (soluble TNF receptor type II [sTNF-RII], C reactive protein), and other inflammatory mediators (IL-8, interferon-γ [IFN-γ]). Analyses evaluated within-group changes in inflammatory markers in 4 treatment groups: no radiation or chemotherapy (n = 39), radiation only (n = 77), chemotherapy only (n = 18), and chemotherapy with radiation (n = 58).
Results
Patients treated with chemotherapy showed statistically significant increases in circulating concentrations of TNF-α, sTNF-RII, IL-6, and IFN-γ from pre- to posttreatment, with parameter estimates in standard deviation units ranging from 0.55 to 1.20. Those who received chemotherapy with radiation also showed statistically significant increases in IL-8 over this period. Statistically significant increases in TNF-α, sTNF-RII, IL-6, IFN-γ, and IL-8 persisted at 6, 12, and 18 months posttreatment among patients treated with chemotherapy and radiation (all P < .05). Patients treated with radiation only showed a statistically significant increase in IL-8 at 18 months posttreatment; no increases in any markers were observed in patients treated with surgery only.
Conclusions
Chemotherapy is associated with acute increases in systemic inflammation that persist for months after treatment completion in patients who also receive radiation therapy. These increases may contribute to common behavioral symptoms and other comorbidities in cancer survivors.
Conventional cancer treatments, including radiation therapy (RT) and chemotherapy (CT), were developed based on their ability to destroy malignant cells. These treatments also have pronounced and persistent effects on the immune system. Although initial work focused primarily on their immunosuppressive effects, there is now compelling evidence that treatment-related changes in tumor-infiltrating lymphoid and myeloid cells play an important role in treatment efficacy (1,2). In particular, destruction of cancer cells by RT and CT can elicit danger signals that enhance tumor-directed immune responses (3,4). Activation of local and systemic inflammatory responses is a key component of the response to cell damage, and there is evidence that both RT and CT can activate inflammatory pathways in the tumor microenvironment and in the periphery (5,6).
Induction of inflammation may have beneficial effects, acting as a link between the innate and adaptive immune systems and potentially enhancing the antitumor immune response (7). However, inflammation can also have negative consequences for functional, behavioral, and clinical outcomes. For example, inflammation has been associated with skin alterations (8,9), pain (10), fatigue (11-13), cognitive problems (14,15), and overall symptom burden (16,17) in cancer patients during and in the immediate aftermath of RT and/or CT. Inflammation may be particularly problematic if it persists beyond the acute phase of treatment. Indeed, patients with clinical elevations in systemic markers of inflammation (eg, C reactive protein [CRP]) after treatment completion are at increased risk for cancer recurrence (18) and mortality (19,20). Chronic inflammation is also known to contribute to a wide range of diseases that are relevant for cancer survivors, including cardiovascular disease, diabetes, and dementia (21).
To date, research on immune effects of cancer therapies has primarily been conducted in mouse models and there is limited characterization of the systemic inflammatory response in the clinical context, particularly among cancer survivors. Longitudinal studies that have followed patients from pre- to mid- or to posttreatment have shown increases in some inflammatory markers (eg, interleukin [IL]–6, soluble tumor necrosis factor [TNF] receptors) (11,12,17,22,23) but not others (eg, CRP) (9,24), with inconsistent results across reports depending on the type of treatment, patient population, and assay platform. Few studies have followed patients from diagnosis into survivorship to examine longer-term effects of treatment on inflammatory processes. One study conducted with breast cancer patients found increases in IL-6 and 2 chemotactic cytokines (monocyte chemoattractant protein [MCP]-1, macrophage inflammatory protein [MIP]-1β) from pre- to post-CT that declined to below baseline over a 2-year follow-up (FU); the other 14 markers assessed showed either no change or a decrease over time (25). A longitudinal study of colorectal cancer patients also showed decreases in 10 inflammatory cytokines from pretreatment to 12-month FU (26). A study conducted with breast cancer patients found increases in ex vivo production of inflammatory cytokines from stimulated immune cells after adjuvant therapy that persisted over the following year (27). Thus, although RT and CT are widely assumed to have proinflammatory effects, empirical evidence to support changes in key inflammatory markers in the aftermath of cancer treatment is surprisingly limited.
The purpose of the current study was to conduct an in-depth evaluation of treatment effects on circulating inflammatory markers in a contemporary sample of breast cancer patients. Women were assessed before adjuvant therapy, at completion of RT and/or CT, and at 6-, 12-, and 18-month posttreatment FUs, allowing examination of acute and more persistent effects on inflammatory activity. We focused on circulating inflammatory markers as these are known to be relevant for behavioral and clinical outcomes in breast cancer survivorship, including the canonical proinflammatory cytokines TNF-α and IL-6 as well as downstream markers of their activity, soluble TNF receptor type II (sTNF-RII) and CRP. We also assessed IL-8, a proinflammatory chemokine relevant for cancer (28), and interferon (IFN)–γ, which activates macrophages, increases proinflammatory cytokine production (29), and may play a proinflammatory role in the cancer context (5).
Methods
Patients and Procedures
Patients were recruited from oncology practices between January 2013 and July 2015 to participate in a prospective, longitudinal study of cancer-related fatigue (RISE study) (30,31). Inclusion criteria were: 1) diagnosed with stage 0-IIIA breast cancer; 2) had not yet started adjuvant or neoadjuvant therapy with RT, CT, or endocrine therapy (ET); and 3) were English proficient. Primary recruitment sites were the University of California, Los Angeles, and Cedars Sinai Medical Center in Los Angeles.
Participants completed up to 5 study assessments from diagnosis to 18 months posttreatment. Baseline assessments were conducted after diagnosis and before receipt of (neo)adjuvant therapy with RT, CT, or ET. The baseline assessment typically occurred after surgery, with the exception of women treated with neoadjuvant CT. Posttreatment assessments were conducted after completion of RT and/or CT for women who received those therapies to capture acute treatment-related changes in inflammatory markers; these assessments were targeted to occur 2 weeks after treatment completion. Of note, women who did not receive RT and/or CT did not complete a posttreatment assessment. FU assessments were conducted at 6, 12, and 18 months posttreatment to capture more persistent changes in inflammation. For women who did not receive RT or CT, the FUs were scheduled at 6, 12, and 18 months after the baseline assessment. At each assessment, participants completed online questionnaires and provided blood samples. The institutional review boards at the University of California, Los Angeles, and Cedars Sinai Medical Center in Los Angeles approved the study, and all participants provided written informed consent.
The RISE study enrolled 270 patients and had excellent retention, with at least 90% of eligible women completing each of the posttreatment assessments (31). To be included in the current analyses, women had to have provided at least 1 blood sample for inflammatory assays and have data available for key demographic and/or clinical covariates. A total of 196 RISE study patients agreed to blood sampling and provided valid data for inflammatory markers; 4 of these women were missing key covariates, resulting in an analytic sample of 192 (71% of enrolled sample). Figure 1 shows the sample size at each assessment.
Figure 1.
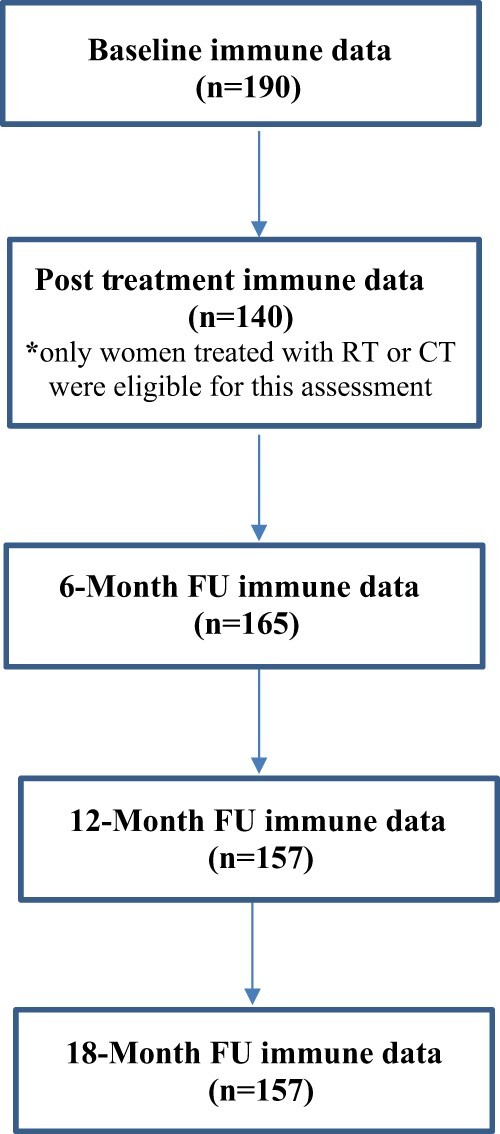
RISE study flow chart (n = 192). Flow chart indicating the number of patients who provided data for inflammatory markers at each assessment. Two women did not provide inflammatory data at baseline but provided samples at later assessments. CT = chemotherapy; FU = follow-up; RT = radiotherapy.
Measures
Demographic characteristics were obtained from self-report at baseline and included age, race and ethnicity, marital status, income, education, and employment status.
Disease and treatment-related information was obtained from medical record abstraction and included cancer stage, type of surgery received (mastectomy or lumpectomy), and type of adjuvant therapy received (RT, CT, and/or ET). Participants completed the Charlson Comorbidity Scale (32) to assess chronic medical conditions.
Immune analyses focused on the canonical proinflammatory cytokines TNF-α and IL-6, downstream markers of their activity (sTNF-RII and CRP), IL-8, and IFN-γ. Briefly, following collection of whole blood samples in EDTA, plasma aliquots were stored at −80°C until assayed utilizing V-PLEX Custom Human Cytokine Proinflammatory Panel (Meso Scale Discovery, Rockville, MD, USA) for TNF-α, IL-6, IL-8, and IFN-γ, and Human Quantikine enzyme-linked immunoassay (ELISA) (R&D Systems, Minneapolis, MN, USA) for CRP and sTNF-RII. Further details are in the Supplementary Methods (available online). Inflammatory markers were log-transformed prior to analyses to address skewness.
Statistical Analyses
The primary study aim was to examine effects of RT and/or CT on circulating inflammatory markers. Analyses focused on changes in inflammatory markers in 4 treatment groups: no RT or CT, RT only, CT only, and CT with RT. Baseline characteristics were compared among treatment groups using χ2 tests and analysis of variance. Linear mixed models were used to test changes from baseline in inflammatory markers at each assessment point within each treatment group by fitting models for each marker that included assessment time point, treatment group, and their interaction. Inflammatory markers were standardized for analyses using the standard deviation of log-transformed variables at baseline. Parameter estimates from mixed models are presented in standard deviation units and can be interpreted using benchmarks for Cohen d effect size estimates (values of 0.2 indicating small effects, 0.5 indicating medium effects, and 0.8 indicating large effects). The models also included fixed effects for age, body mass index (BMI), cancer stage, time since diagnosis, enrollment surgery type, interim surgery (time varying, yes or no), use of ET (time varying, yes or no), and a random effect for participant. Sensitivity analyses additionally controlled for presence of inflammatory conditions from the Charlson Comorbidity Scale. All statistical tests were 2-sided, and a P value of less than .05 was used to determine statistical significance. Analyses were performed in SAS 9.4 and Stata 15.1.
Results
Sample Characteristics
As shown in Table 1, study participants were on average aged 55 years, primarily White, employed, and married, with no comorbidities. The most common treatment was RT only (n = 77; 40%), followed by CT with RT (n = 58; 30%), no RT or CT (n = 39; 20%), and CT only (n = 18; 9%). Among those treated with CT (with or without RT), 19 (25%) received neoadjuvant therapy. Of note, a minority (9%) of women in this sample were treated with anthracycline-based CT, in contrast to previous clinical (25) and preclinical (33) research. Most (62.5%) women in the sample were treated with ET, and all had surgery at some point in the treatment trajectory. On average, women completed the baseline assessment approximately 2 months after diagnosis (though this varied by treatment group) and approximately 1 month after surgery.
Table 1.
Characteristics of participants by treatment group
| Characteristic | Overall | No RT or CT | RT only | CT only | CT with RT | P a |
|---|---|---|---|---|---|---|
| (n = 192) | (n = 39) | (n = 77) | (n = 18) | (n = 58) | ||
| Demographic and general health | ||||||
| Mean age (SD), y | 55.1 (11.0) | 55.5 (9.4) | 57.4 (11.5) | 50.7 (9.7) | 53.3 (11.2) | .05 |
| Mean BMI (SD), kg/m2 | 25.4 (5.7) | 23.8 (4.5) | 25.7 (5.9) | 25.5 (5.7) | 25.9 (6.1) | .31 |
| Race, No. (%) | ||||||
| Asian | 21 (10.9) | 2 (5.1) | 6 (7.8) | 2 (11.1) | 11 (19.0) | .01 (for White vs non-White women) |
| Black | 8 (4.1) | 0 (0) | 2 (2.6) | 3 (16.7) | 3 (5.2) | |
| Other | 19 (9.9) | 3 (7.7) | 7 (9.0) | 3 (16.7) | 6 (10.3) | |
| White | 144 (75.0) | 34 (87.2) | 62 (80.5) | 10 (55.6) | 38 (65.5) | |
| Hispanic, No. (%) | 20 (10.4) | 2 (5.1) | 8 (10.4) | 4 (22.2) | 6 (10.3) | .28 |
| Annual household income (n = 3 missing), No. (%) | ||||||
| Less than $60K | 47 (24.8) | 7 (18.9) | 21 (27.6) | 8 (44.4) | 11 (19.0) | .37 |
| $60-$100K | 40 (21.2) | 10 (27.0) | 15 (19.4) | 2 (11.1) | 13 (22.4) | |
| $100K or more | 102 (53.9) | 20 (54.1) | 40 (52.6) | 8 (44.4) | 34 (58.6) | |
| Education, No. (%) | ||||||
| College or less | 133 (67.7) | 27 (69.2) | 48 (62.3) | 15 (83.3) | 40 (69.0) | .38 |
| Postgraduate | 62 (32.3) | 12 (30.8) | 29 (37.6) | 3 (16.7) | 18 (31.0) | |
| Employed, No. (%) | 124 (64.6) | 22 (56.4) | 48 (62.3) | 12 (66.7) | 42 (72.4) | .41 |
| Married, No. (%) | 126 (65.6) | 25 (64.1) | 49 (63.6) | 10 (55.6) | 42 (72.4) | .54 |
| Charlson Comorbidity Scale, No. (%) | ||||||
| 0 | 151 (78.6) | 31 (79.5) | 61 (79.2) | 14 (77.8) | 45 (77.6) | .99 (for 0 vs. 1 or more) |
| 1 | 29 (15.1) | 6 (15.4) | 10 (13.0) | 1 (5.6) | 12 (20.7) | |
| ≥2 | 12 (6.2) | 2 (5.1) | 6 (7.8) | 3 (16.6) | 1 (1.7) | |
| Disease and treatment related | ||||||
| Stage, No. (%) | ||||||
| 0 or I | 116 (60.4) | 34 (87.2) | 62 (80.5) | 7 (38.9) | 13 (22.4) | <.001 |
| II, III, or neoadjuvant | 76 (39.6) | 5 (12.8) | 15 (19.5) | 11 (61.1) | 45 (77.6) | |
| Surgery type at enrollment, No. (%) | ||||||
| None (neoadjuvant) | 19 (9.9) | 0 (0.0) | 0 (0.0) | 3 (16.7) | 16 (27.6) | <.001 (for none or lump vs UM vs BM) |
| Lumpectomy | 114 (59.4) | 5 (12.8) | 73 (94.8) | 5 (27.8) | 31 (53.5) | |
| Unilateral mastectomy | 18 (9.4) | 9 (23.1) | 2 (2.6) | 4 (22.2) | 3 (5.2) | |
| Bilateral mastectomy | 41 (21.4) | 25 (64.1) | 2 (2.6) | 6 (33.3) | 8 (13.8) | |
| Number of surgeries postenrollment, No. (%) | ||||||
| 0 | 137 (71.4) | 23 (59.0) | 74 (96.1) | 7 (38.9) | 33 (56.9) | <.001 |
| 1 | 43 (22.4) | 16 (41.0) | 3 (3.9) | 4 (22.2) | 20 (34.5) | |
| 2 | 12 (6.3) | 0 (0) | 0 (0.0) | 7 (38.9) | 5 (8.6) | |
| Receipt of neoadjuvant chemotherapy, No. (%) | 19 (9.9) | N/A | N/A | 3 (16.7) | 16 (27.6) | .35 (for CT only vs CT with RT) |
| Chemotherapy type (n = 1 missing), No. (%) | ||||||
| TC | 42 (56.0) | N/A | N/A | 9 (50.0) | 33 (57.9) | .56 (for CT only vs CT with RT) |
| TCH | 9 (12.0) | 2 (11.1) | 7 (12.3) | |||
| ACT | 9 (12.0) | 2 (11.1) | 7 (12.3) | |||
| Other | 15 (20.0) | 5 (27.8) | 10 (17.5) | |||
| Receipt of endocrine therapy, No. (%) | 120 (62.5) | 18 (46.2) | 56 (72.7) | 9 (50.0) | 37 (63.8) | .03 |
| Months from diagnosis to baseline assessment, M (SD) | 2.1 (1.2) | 2.8 (1.6) | 1.9 (0.7) | 2.3 (1.7) | 1.8 (0.9) | <.001 |
| Days from enrollment surgery to baseline assessment (n = 171), M (SD)b | 33.3 (23.7) | 36.1 (30.3) | 31.0 (15.9) | 35.6 (49.6) | 34.0 (14.7) | .71 |
| Months from baseline to post-tx assessment (n = 140), M (SD)c | 4.3 (2.6) | N/A | 2.2 (0.8) | 5.2 (1.3) | 6.9 (1.7) | <.001 |
Omnibus P values are from χ2 tests (categorical variables) and analysis of variance (continuous variables). ACT = doxorubicin (Adriamycin), cyclophosphamide (Cytoxan), docetaxel (Taxotere); BMI = body mass index; CT = chemotherapy; RT = radiation therapy; post-tx = posttreatment; TC = docetaxel (Taxotere), cyclophosphamide (Cytoxan); TCH = docetaxel (Taxotere), carboplatin, trastuzumab (Herceptin); N/A = not applicable.
This variable excludes women treated with neoadjuvant CT as they did not receive surgery prior to study enrollment and completion of the baseline assessment.
This variable excludes women who did not receive CT or RT as they did not complete a posttreatment assessment.
Treatment groups differed in expected ways on demographic, disease, and treatment-related characteristics. Women treated with CT (with or without RT) were statistically significantly younger than those treated with RT only and were more likely to be non-White and have higher stage disease than those who did not receive CT. Women treated with RT (with or without CT) were more likely to have had a lumpectomy (vs mastectomy) than those who did not receive RT. Those treated with RT only had the lowest rate of additional surgeries, whereas those treated with CT only had the highest rate.
Inflammatory Markers
Medians and interquartile ranges for raw values of inflammatory markers at each assessment are shown by treatment group in Table 2. Mean levels and standard errors of adjusted, log-transformed values of inflammatory markers at each assessment are displayed in Figure 2, A-F. These values were obtained from the mixed models and are adjusted for covariates but not standardized.
Table 2.
Median (and IQR) levels of inflammatory markers for each treatment group at each assessmenta
| Treatment group | No. | Inflammatory marker, median (IQR) |
|||||
|---|---|---|---|---|---|---|---|
| TNF-α, pg/mL | sTNFR-II, 1000 pg/mL | IL-6, pg/mL | CRP, mg/L | IL-8, pg/mL | IFN-γ, pg/mL | ||
| No RT or CT | |||||||
| Baseline | 39 | 2.1 (1.8-2.6) | 2.3 (1.8-2.8) | 0.6 (0.4-1.2) | 1.5 (0.4-4.0) | 7.1 (5.1-8.4) | 6.9 (4.8-12.2) |
| 6-month FU | 33 | 2.1 (1.8-2.5) | 2.0 (1.8-2.3) | 0.6 (0.5-0.8) | 1.0 (0.6-2.1) | 6.6 (5.2-9.1) | 6.0 (4.2-10.0) |
| 12-month FU | 32 | 2.0 (1.7-2.4) | 2.0 (1.7-2.3) | 0.6 (0.5-0.9) | 0.9 (0.6-3.7) | 7.1 (5.6-8.9) | 5.3 (4.3-8.4) |
| 18-month FU | 32 | 2.1 (1.9-2.4) | 2.1 (2.0-2.5) | 0.6 (0.4-1.0) | 1.6 (0.8-3.1) | 7.3 (5.3-9.4) | 6.2 (4.2-9.2) |
| RT only | |||||||
| Baseline | 77 | 2.0 (1.7-2.4) | 2.0 (1.7-2.5) | 0.7 (0.5-1.0) | 1.4 (0.6-3.2) | 7.0 (5.0-9.2) | 6.1 (4.6-9.9) |
| Post-tx | 74 | 2.0 (1.7-2.7) | 2.1 (1.8-2.5) | 0.8 (0.5-1.2) | 1.3 (0.3-3.0) | 7.1 (5.1-9.0) | 8.1 (4.7-14.6) |
| 6-month FU | 65 | 2.0 (1.7-2.6) | 2.1 (1.7-2.4) | 0.7 (0.5-1.0) | 0.9 (0.4-3.0) | 7.5 (5.7-9.9) | 5.8 (4.5-9.4) |
| 12-month FU | 63 | 2.0 (1.6-2.6) | 2.0 (1.7-2.4) | 0.7 (0.4-1.0) | 1.0 (0.3-2.1) | 7.4 (6.0-9.8) | 6.3 (3.8-9.1) |
| 18-month FU | 64 | 2.0 (1.8-2.5) | 2.0 (1.7-2.3) | 0.7 (0.4-1.2) | 1.0 (0.4-3.0) | 8.6 (7.0-9.7) | 6.0 (4.6-9.2) |
| CT only | |||||||
| Baseline | 17 | 1.8 (1.6-2.4) | 2.0 (1.6-2.3) | 0.6 (0.3-0.8) | 1.6 (1.0-3.8) | 6.1 (4.5-8.8) | 7.2 (3.0-11.6) |
| Post-tx | 14 | 2.7 (2.0-2.8) | 2.5 (2.0-3.5) | 1.1 (0.6-1.9) | 1.3 (0.4-5.2) | 8.9 (5.8-11.2) | 10.4 (6.0-15.2) |
| 6-month FU | 14 | 2.2 (1.8-2.2) | 2.0 (1.6-2.3) | 0.6 (0.5-0.8) | 0.7 (0.4-0.9) | 8.8 (6.0-11.6) | 6.9 (5.4-11.9) |
| 12-month FU | 12 | 2.1 (1.9-2.3) | 1.8 (1.6-2.5) | 0.7 (0.4-1.0) | 0.8 (0.3-1.4) | 8.4 (6.2-14.9) | 8.7 (6.9-14.7) |
| 18-month FU | 13 | 2.1 (2.0-2.5) | 2.0 (1.7-2.4) | 0.6 (0.4-0.9) | 0.8 (0.4-1.4) | 9.8 (7.8-12.4) | 7.9 (4.8-9.5) |
| CT with RT | |||||||
| Baseline | 57 | 1.7 (1.0-2.2) | 1.7 (1.4-2.2) | 0.5 (0.3-0.8) | 1.5 (0.6-4.5) | 5.8 (4.3-8.8) | 3.6 (0.4-6.3) |
| Post-tx | 52 | 2.2 (1.7-2.7) | 2.2 (1.8-3.1) | 0.6 (0.5-1.2) | 1.2 (0.5-3.4) | 6.9 (5.0-9.6) | 8.5 (4.9-15.8) |
| 6-month FU | 53 | 2.1 (1.8-2.6) | 2.2 (1.6-2.5) | 0.6 (0.4-1.0) | 1.0 (0.4-3.1) | 7.6 (5.8-10.1) | 6.4 (4.4-8.6) |
| 12-month FU | 50 | 2.0 (1.6-2.4) | 2.1 (1.6-2.5) | 0.5 (0.4-0.9) | 0.9 (0.5-4.0) | 6.8 (5.9-9.1) | 6.3 (4.5-8.6) |
| 18-month FU | 48 | 2.3 (1.8-2.6) | 2.1 (1.5-2.7) | 0.7 (0.4-1.1) | 1.5 (0.5-3.2) | 8.0 (6.5-9.9) | 6.7 (5.0-8.7) |
Medians and IQRs in this table are based on raw values for all markers; log-transformed variables were used in analyses. CRP = C reactive protein; CT = chemotherapy; FU = follow-up; IFN = interferon; IL = interleukin; IQR = interquartile range; post-tx = posttreatment; RT = radiation therapy; TNF = tumor necrosis factor; sTNF-RII = soluble TNF receptor type II.
Figure 2.

Changes in inflammatory markers over time by treatment group. Panels show adjusted mean levels of log-transformed (A) TNF-α, (B) sTNF-RII, (C) IL-6, (D) CRP, (E) IL-8, and (F) IFN-γ at each assessment point from baseline (pretreatment) to 18-month posttreatment FU. The 4 treatment groups are no CT or RT, RT only, CT only, and CT with RT. The posttreatment assessment was only completed by patients who received RT and/or CT and thus was not completed by no CT or RT group. BL = baseline; CRP = C reactive protein; CT = chemotherapy; FU = follow-up; IFN = interferon; IL = interleukin; MO = month; post-tx = posttreatment; RT = radiotherapy; TNF = tumor necrosis factor; sTNF-RII = soluble TNF receptor type II.
There were baseline (pretreatment) differences in adjusted values of several markers by treatment group. Controlling for relevant covariates (age, BMI, race, disease stage, time since diagnosis, enrollment surgery type), women scheduled to receive CT with RT had statistically significantly lower levels of TNF-α, sTNF-RII, and IL-6 at baseline than those scheduled to receive RT only (for all 3 markers) or those scheduled to receive neither RT or CT (for TNF-α and IL-6).
Changes in Inflammatory Markers Within Each Treatment Group
Primary analyses focused on within-group changes over time in each treatment group. Standardized adjusted parameter estimates from mixed models testing changes from baseline within each treatment group are shown in Table 3. These estimates represent the change in the log-transformed outcome variable due to a 1-unit increase in the predictor, in standard deviation units of the outcome. All models included relevant covariates (age, BMI, race, disease stage, time since diagnosis, surgery type at enrollment, interim surgery, and receipt of ET). Sensitivity analyses that included an indicator for presence of inflammatory conditions yielded the same pattern of results.
Table 3.
Parameter estimates from mixed models testing changes from baseline in inflammatory markers over the assessment period within each treatment groupa
| Predictors | Inflammatory marker |
|||||||||||
|---|---|---|---|---|---|---|---|---|---|---|---|---|
| TNF-α |
sTNFR-II |
IL-6 |
CRP |
IL-8 |
IFN-γ |
|||||||
| Estimate | P b | Estimate | P b | Estimate | P b | Estimate | P b | Estimate | P b | Estimate | P b | |
| Age, y | .03 | <.001 | .02 | <.001 | .02 | <.001 | .01 | .008 | .01 | .07 | .001 | .77 |
| BMI, kg/m2 | .03 | .002 | .05 | <.001 | .06 | <.001 | .09 | <.001 | .02 | .05 | .004 | .42 |
| Months since diagnosis | .00 | .96 | .02 | .69 | −.04 | .38 | .00 | .93 | −.04 | .39 | −.05 | .06 |
| Stage (II, III, neoadj vs 0, I) | .06 | .64 | .17 | .20 | .18 | .09 | .13 | .30 | .02 | .91 | .07 | .36 |
| Race (White vs non-White) | −.10 | .38 | .11 | .39 | −.07 | .49 | .06 | .58 | −.03 | .83 | −.03 | .72 |
| Surgery type enrollment (ref: lump) | ||||||||||||
| None (neoadjuvant) | .29 | .14 | .41 | .06 | −.09 | .58 | .28 | .17 | −.09 | .69 | −.19 | .12 |
| Unilateral mastectomy | −.09 | .66 | .08 | .72 | −.05 | .75 | −.11 | .59 | .11 | .60 | −.22 | .07 |
| Bilateral mastectomy | .27 | .11 | .16 | .39 | .08 | .59 | .18 | .29 | .20 | .28 | −.10 | .32 |
| Interim surgery | −.01 | .92 | −.04 | .61 | .23 | .02 | .08 | .34 | .07 | .54 | .01 | .96 |
| Estrogen, AI | −.06 | .27 | −.06 | .34 | −.05 | .47 | .08 | .26 | .02 | .81 | −.08 | .19 |
| Estrogen, SERM | .01 | .83 | .09 | .23 | −.14 | .11 | −.43 | <.001 | .06 | .53 | .02 | .80 |
| Within-group effects by treatment group, difference from baseline | ||||||||||||
| No RT or CT | ||||||||||||
| 6-month FU | −.06 | .56 | −.26 | .02 | −.17 | .25 | −.28 | .03 | −.15 | .35 | −.06 | .65 |
| 12-month FU | −.19 | .06 | −.55 | <.001 | −.14 | .33 | −.15 | .24 | −.16 | .30 | −.18 | .17 |
| 18-month FU | −.05 | .65 | −.16 | .16 | −.24 | .08 | .02 | .87 | .05 | .77 | −.17 | .21 |
| RT only | ||||||||||||
| Post-tx | .07 | .33 | .12 | .13 | .14 | .15 | −.01 | .92 | −.02 | .88 | .14 | .11 |
| 6-month FU | .06 | .40 | −.01 | .88 | .11 | .30 | −.02 | .86 | .10 | .39 | −.04 | .72 |
| 12-month FU | .04 | .60 | .02 | .85 | −.08 | .46 | −.09 | .33 | .22 | .07 | −.06 | .58 |
| 18-month FU | .10 | .20 | .00 | .99 | .08 | .47 | .03 | .78 | .40 | .001 | −.03 | .75 |
| CT only | ||||||||||||
| Post-tx | .74 | <.001 | .98 | <.001 | .66 | .003 | −.04 | .86 | .30 | .23 | .52 | .01 |
| 6-month FU | .46 | .003 | .26 | .13 | .05 | .80 | −.35 | .07 | .49 | .04 | .38 | .06 |
| 12-month FU | .32 | .04 | −.09 | .64 | .08 | .73 | −.60 | .002 | .68 | .006 | .54 | .01 |
| 18-month FU | .37 | .02 | .09 | .63 | −.11 | .63 | −.47 | .02 | .78 | .001 | .25 | .22 |
| CT with RT | ||||||||||||
| Post-tx | .89 | <.001 | .90 | <.001 | .52 | <.001 | −.10 | .31 | .33 | .01 | 1.20 | <.001 |
| 6-month FU | .78 | <.001 | .46 | <.001 | .36 | .002 | −.30 | .004 | .48 | <.001 | .92 | <.001 |
| 12-month FU | .69 | <.001 | .42 | <.001 | .27 | .02 | −.26 | .01 | .42 | .001 | .85 | <.001 |
| 18-month FU | .81 | <.001 | .38 | <.001 | .39 | .001 | −.25 | .02 | .56 | <.001 | .96 | <.001 |
Inflammatory markers are standardized by standard deviation of log-transformed values at baseline. Demographic, medical, and disease-related predictors are included in all models. Interim surgery and endocrine therapy are time-varying predictors equal to 1 if participant received them during interval between assessments and 0 otherwise. AI = aromatase inhibitor; BMI = body mass index; CRP = C reactive protein; CT = chemotherapy; FU, follow-up; IFN = interferon; IL = interleukin; neoadj = neoadjuvant; lump, lumpectomy; post-tx = posttreatment; RT = radiation therapy; SERM = selective estrogen receptor modifier; TNF = tumor necrosis factor; sTNF-RII = soluble TNF receptor type II.
P values are from 2-sided Wald tests.
No RT or CT Group (n = 39)
No statistically significant changes from baseline were observed in IL-6, TNF-α, IL-8, or IFN-γ among women who did not receive RT or CT. There was a statistically significant decrease in sTNF-RII at 6- and 12-month FU and a statistically significant decrease in CRP at 6-month FU relative to baseline. Of note, this group did not complete a posttreatment assessment, as they did not receive RT or CT.
RT Only Group (n = 77)
Among women treated with RT (but not CT), no statistically significant changes from baseline were observed in TNF-α, sTNF-RII, IL-6, CRP, or IFN-γ. There was evidence of an increase in IL-8 that was statistically significant at 18-month FU.
CT Only Group (n = 18)
Among women treated with CT only, there were statistically significant increases in TNF-α, sTNF-RII, IL-6, and IFN-γ from baseline to posttreatment, with parameter estimates in standard deviation units ranging from 0.55 to 0.98 (indicating medium to large effects). Levels of TNF-α remained statistically significantly elevated across the FU period, though the magnitude of the effect was reduced. IL-8 was not elevated at posttreatment but showed a delayed rise at 6-, 12-, and 18-month FU. There was also no elevation in CRP at posttreatment; instead, CRP was statistically significantly lower than baseline at 12- and 18-month FU.
CT With RT Group (n = 58)
Among women treated with CT and RT, there were statistically significant increases in TNF-α, sTNF-RII, IL-6, IL-8, and IFN-γ from baseline to posttreatment. Parameter estimates in standard deviation units ranged from 0.33 to 1.20, indicating medium to large effects for all markers except IL-8. Elevations in TNF-α, sTNF-RII, IL-6, IL-8, and IFN-γ persisted at 6-, 12-, and 18-month FU, with effect sizes that were small to large in magnitude by the final assessment. For CRP, there was no difference at posttreatment, but levels were statistically significantly lower at 6-, 12-, and 18-month FUs relative to baseline.
Discussion
In a sample of 192 women diagnosed with early stage breast cancer, those who received CT (with or without RT) showed statistically significant increases from pre- to posttreatment in 5 of the 6 inflammatory markers assessed: TNF-α, sTNF-RII, IL-6, IL-8, and IFN-γ. The majority of these changes were medium to large in magnitude, suggesting a robust acute effect of CT on systemic inflammation. Although concentrations of most markers declined somewhat after treatment completion, they remained statistically significantly higher than baseline in the 18 months after treatment completion among those treated with both CT and RT. In contrast, no increases in inflammatory markers were seen among women who received RT only and those who did not receive either adjuvant therapy. In addition, there was no statistically significant effect of ET on any of the inflammatory markers assessed.
These results confirm earlier reports in smaller samples showing acute increases in inflammatory markers among breast cancer patients undergoing CT (22) and among patients with advanced cancers (gastrointestinal, non-small cell lung cancer) undergoing combined chemoradiation therapy (17,23). Importantly, we found evidence that these elevations persisted for many months after completion of CT, indicating an enduring effect of CT (in combination with RT) on systemic inflammation. The consistency and breadth of these effects across measures of inflammation were marked, as women treated with CT and RT showed persistent elevations in all but 1 of the markers assessed. Of note, women treated with CT in this sample were younger than those who did not receive CT and started the study with generally lower levels of inflammatory markers.
Unlike CT, there was little evidence that RT alone was associated with increases in circulating inflammatory markers. In an earlier study with breast and prostate cancer patients undergoing RT (without CT), we found increases in IL-6 from pre- to posttreatment that declined by 2 months posttreatment; no statistically significant increases in other inflammatory markers (CRP, IL-1β, IL-1 receptor antagonist) were observed (11). Other studies of breast cancer patients undergoing RT have yielded similar results, with increases observed in a few markers but no changes (or even decreases) in many others (24,34). Although the inflammatory response to RT has been elegantly described in animal models (5), the current findings suggest that RT alone may not influence the systemic inflammatory response in the context of early stage breast cancer.
To our knowledge, only 2 previous studies have examined changes in circulating inflammatory cytokines from pre- to posttreatment and over an extended FU in cancer patients. One study followed women with breast cancer undergoing CT and showed acute increases in IL-6, MIP-1β, and MCP-1 from pre- to post-CT that declined to below baseline over the 2-year FU (25). No changes were seen in 11 of the markers assessed in this study (including TNF-α and IL-8), and 3 showed decreases over time (25). Women in this study were similar to ours in terms of demographic and treatment-related characteristics; however, the majority (55%) received Adriamycin (vs 9% in our sample), reflecting the earlier study period. A longitudinal study of patients with localized colorectal cancer reported median levels of 10 inflammatory cytokines that were higher at baseline than at 12-month FU among those treated with CT, with similar trends observed in patients who did not receive CT and healthy controls, though statistical tests evaluating changes over time were not reported (26). Another study examined changes in ex vivo production of inflammatory cytokines from immune cells following stimulation in women with breast cancer and a healthy comparison group (27). The breast cancer patients in this study showed increases in stimulated cytokine production from pretreatment to 6 months posttreatment and over the following year that were significantly higher than controls; these effects were most pronounced in women who received surgery, CT, and RT, consistent with our findings (27). Of note, women treated with multimodal therapy in this study also showed significant increases in comorbidities, highlighting the clinical relevance of persistent inflammation.
In contrast to the other markers, no increases in CRP were observed after CT (or RT). Instead, levels of CRP decreased over time in the CT groups and among women treated with surgery alone. Previous studies have typically not found acute increases in CRP during or in the immediate aftermath of treatment (9,12,22), though effects in the posttreatment setting have not been described. CRP is a liver-derived acute phase protein produced in response to IL-6 and may be regulated differently than the other markers assessed. Results suggest that CRP may not track with other components of the systemic inflammatory response to adjuvant therapy and should be evaluated in conjunction with other markers in this context.
Activation of the innate immune system, including inflammatory pathways, may be beneficial to the extent that this facilitates an antitumor immune response and aids in tissue repair. However, even if treatment-related increases in systemic inflammation may be helpful in the short term, persistent inflammation is associated with poor outcomes in cancer survivorship. It is unclear whether the increases in inflammation observed among CT-treated women in this study are sufficient to materially impact these negative outcomes; indeed, we did not find treatment-related increases in CRP, which predicts recurrence (18) and mortality (19,20) in women with breast cancer. However, we did find elevations in other markers of inflammatory activity that have been associated with behavioral symptoms in breast cancer survivors, including fatigue (13,35) and cognitive disturbance (15), both of which cause serious disruption in quality of life (36).
Conclusions are limited by characteristics of the study population, which primarily consisted of White women with early stage breast cancer. Inflammation is known to vary by race and disease stage, and results may differ in samples of Asian, Black, and Latina women, as well as those with more advanced disease. In addition, there was variability in the size of the treatment groups, which may have influenced our ability to detect changes over time, particularly in the small group of CT-only patients. Further, inflammatory markers were below the lower limit of detection for a small number of samples and estimated values were used in analyses. Finally, the study did not include a systemic therapy-free patient population, as many of the women not treated with RT or CT did receive ET. There was also no control group of women without breast cancer to compare “normal” changes in inflammatory markers over the assessment period.
Results of this study provide critical empirical support for hypotheses about the inflammatory effects of CT and are among the first to document persistent elevations in circulating inflammatory markers well after treatment completion. These findings are consistent with the idea that cancer treatments may accelerate biological aging processes in cancer survivors, potentially leading to premature behavioral and physical manifestations of aging (27,37). The mechanisms underlying elevated inflammatory activity after CT treatment have not been determined but might include accumulation of senescent cells, which are known to be proinflammatory (38). Elucidation of these mechanisms is a critical topic for future research and can inform the development of targeted interventions to reduce inflammation and its detrimental effects on physical and mental well-being (37).
Funding
This work was supported by the National Cancer Institute at the National Institutes of Health (R01 CA160427 and P30 CA16042).
Notes
Role of funder: The funders had no role in the design of the study; the collection, analysis, and interpretation of the data; the writing of the manuscript; and the decision to submit the manuscript for publication.
Disclosures: The authors have no disclosures. PAG, who is a JNCI Cancer Spectrum Deputy Editor and co-author on this paper, was not involved in the editorial review or decision to publish the manuscript.
Author contributions: Conceptualization: JEB. Data curation: LP, CMC. Formal analysis: CMC, LP, KRK. Funding acquisition: JEB, PAG, MRI, SWC, CMC. Investigation: DG. Project administration: DG, LP, JEB, AA. Resources: MRI, SAH, AA. Supervision: JEB, AA, PAG, MRI. Writing: JEB, PAG, MRI, SWC, JC, KRK, LP, DG, AA, SAH.
Acknowledgements: RISE study participants for their time and contributions to this research.
Supplementary Material
Contributor Information
Julienne E Bower, Department of Psychology, University of California, Los Angeles, CA, USA; Department of Psychiatry and Biobehavioral Sciences, University of California, Los Angeles, CA, USA; Cousins Center for Psychoneuroimmunology, Semel Institute for Neuroscience and Human Behavior, University of California, Los Angeles, CA, USA; Jonsson Comprehensive Cancer Center, University of California, Los Angeles, CA, USA.
Patricia A Ganz, Jonsson Comprehensive Cancer Center, University of California, Los Angeles, CA, USA; Schools of Medicine and Public Health, University of California, Los Angeles, CA, USA.
Michael R Irwin, Department of Psychiatry and Biobehavioral Sciences, University of California, Los Angeles, CA, USA; Cousins Center for Psychoneuroimmunology, Semel Institute for Neuroscience and Human Behavior, University of California, Los Angeles, CA, USA.
Steve W Cole, Department of Psychiatry and Biobehavioral Sciences, University of California, Los Angeles, CA, USA; Cousins Center for Psychoneuroimmunology, Semel Institute for Neuroscience and Human Behavior, University of California, Los Angeles, CA, USA; Department of Medicine, University of California, Los Angeles, CA, USA.
Judith Carroll, Department of Psychiatry and Biobehavioral Sciences, University of California, Los Angeles, CA, USA; Cousins Center for Psychoneuroimmunology, Semel Institute for Neuroscience and Human Behavior, University of California, Los Angeles, CA, USA.
Kate R Kuhlman, Cousins Center for Psychoneuroimmunology, Semel Institute for Neuroscience and Human Behavior, University of California, Los Angeles, CA, USA; Department of Psychological Science of California, University of California, Irvine, CA, USA.
Laura Petersen, Jonsson Comprehensive Cancer Center, University of California, Los Angeles, CA, USA.
Deborah Garet, Cousins Center for Psychoneuroimmunology, Semel Institute for Neuroscience and Human Behavior, University of California, Los Angeles, CA, USA.
Arash Asher, Cedars-Sinai Medical Center, Samuel Oschin Comprehensive Cancer Institute, Los Angeles, CA, USA.
Sara A Hurvitz, Jonsson Comprehensive Cancer Center, University of California, Los Angeles, CA, USA; Department of Medicine, University of California, Los Angeles, CA, USA.
Catherine M Crespi, Jonsson Comprehensive Cancer Center, University of California, Los Angeles, CA, USA; Department of Biostatistics, University of California, Los Angeles, CA, USA.
Data Availability
The data underlying this article will be shared on reasonable request to the corresponding author.
References
- 1. Zitvogel L, Apetoh L, Ghiringhelli F, et al. Immunological aspects of cancer chemotherapy. Nat Rev Immunol. 2008;8(1):59-73. [DOI] [PubMed] [Google Scholar]
- 2. Fridman WH, Zitvogel L, Sautès-Fridman C, et al. The immune contexture in cancer prognosis and treatment. Nat Rev Clin Oncol. 2017;14(12):717-734. [DOI] [PubMed] [Google Scholar]
- 3. Galluzzi L, Buqué A, Kepp O, et al. Immunological effects of conventional chemotherapy and targeted anticancer agents. Cancer Cell. 2015;28(6):690-714. [DOI] [PubMed] [Google Scholar]
- 4. McBride WH, Chiang CS, Olson JL, et al. A sense of danger from radiation. Radiat Res. 2004;162(1):1-19. [DOI] [PubMed] [Google Scholar]
- 5. Schaue D, Micewicz ED, Ratikan JA, et al. Radiation and inflammation. Semin Radiat Oncol. 2015;25(1):4-10. [DOI] [PMC free article] [PubMed] [Google Scholar]
- 6. van der Most RG, Currie AJ, Robinson BW, et al. Decoding dangerous death: how cytotoxic chemotherapy invokes inflammation, immunity or nothing at all. Cell Death Differ. 2008;15(1):13-20. [DOI] [PubMed] [Google Scholar]
- 7. Apetoh L, Ghiringhelli F, Tesniere A, et al. Toll-like receptor 4-dependent contribution of the immune system to anticancer chemotherapy and radiotherapy. Nat Med. 2007;13(9):1050-1059. [DOI] [PubMed] [Google Scholar]
- 8. Rodriguez-Gil JL, Takita C, Wright J, et al. Inflammatory biomarker C-reactive protein and radiotherapy-induced early adverse skin reactions in patients with breast cancer. Cancer Epidemiol Biomarkers Prev. 2014;23(9):1873-1883. [DOI] [PMC free article] [PubMed] [Google Scholar]
- 9. Hu JJ, Urbanic JJ, Case LD, et al. Association between inflammatory biomarker C-reactive protein and radiotherapy-induced early adverse skin reactions in a multiracial/ethnic breast cancer population. J Clin Oncol. 2018;36(24):2473-2482. [DOI] [PMC free article] [PubMed] [Google Scholar]
- 10. Lee E, Nelson OL, Puyana C, et al. Association between C-reactive protein and radiotherapy-related pain in a tri-racial/ethnic population of breast cancer patients: a prospective cohort study. Breast Cancer Res. 2019;21(1):70. [DOI] [PMC free article] [PubMed] [Google Scholar]
- 11. Bower JE, Ganz PA, Tao ML, et al. Inflammatory biomarkers and fatigue during radiation therapy for breast and prostate cancer. Clin Cancer Res. 2009;15(17):5534-5540. [DOI] [PMC free article] [PubMed] [Google Scholar]
- 12. Xiao C, Beitler JJ, Higgins KA, et al. Fatigue is associated with inflammation in patients with head and neck cancer before and after intensity-modulated radiation therapy. Brain Behav Immun. 2016;52:145-152. [DOI] [PMC free article] [PubMed] [Google Scholar]
- 13. Bower JE, Ganz PA, Irwin MR, et al. Inflammation and behavioral symptoms after breast cancer treatment: do fatigue, depression, and sleep disturbance share a common underlying mechanism? J Clin Oncol. 2011;29(26):3517-3522. [DOI] [PMC free article] [PubMed] [Google Scholar]
- 14. Williams AM, Shah R, Shayne M, et al. Associations between inflammatory markers and cognitive function in breast cancer patients receiving chemotherapy. J Neuroimmunol. 2018;314:17-23. [DOI] [PMC free article] [PubMed] [Google Scholar]
- 15. Ganz PA, Bower JE, Kwan L, et al. Does tumor necrosis factor-alpha (TNF-alpha) play a role in post-chemotherapy cerebral dysfunction? Brain Behav Immun. 2013;30 Suppl:S99-108. [DOI] [PMC free article] [PubMed] [Google Scholar]
- 16. Wang XS, Shi Q, Shah ND, et al. Inflammatory markers and development of symptom burden in patients with multiple myeloma during autologous stem cell transplantation. Clin Cancer Res. 2014;20(5):1366-1374. [DOI] [PMC free article] [PubMed] [Google Scholar]
- 17. Wang XS, Williams LA, Krishnan S, et al. Serum sTNF-R1, IL-6, and the development of fatigue in patients with gastrointestinal cancer undergoing chemoradiation therapy. Brain Behav Immun. 2012;26(5):699–705. [DOI] [PMC free article] [PubMed] [Google Scholar]
- 18. McAndrew NP, Bottalico L, Mesaros C, et al. Effects of systemic inflammation on relapse in early breast cancer. NPJ Breast Cancer. 2021;7(1):7. [DOI] [PMC free article] [PubMed] [Google Scholar]
- 19. Villasenor A, Flatt SW, Marinac C, et al. Postdiagnosis C-reactive protein and breast cancer survivorship: findings from the WHEL study. Cancer Epidemiol Biomarkers Prev. 2014;23(1):189-199. [DOI] [PMC free article] [PubMed] [Google Scholar]
- 20. Pierce BL, Ballard-Barbash R, Bernstein L, et al. Elevated biomarkers of inflammation are associated with reduced survival among breast cancer patients. J Clin Oncol. 2009;27(21):3437-3444. [DOI] [PMC free article] [PubMed] [Google Scholar]
- 21. Furman D, Campisi J, Verdin E, et al. Chronic inflammation in the etiology of disease across the life span. Nat Med. 2019;25(12):1822-1832. [DOI] [PMC free article] [PubMed] [Google Scholar]
- 22. Liu L, Mills PJ, Rissling M, et al. Fatigue and sleep quality are associated with changes in inflammatory markers in breast cancer patients undergoing chemotherapy. Brain Behav Immun. 2012;26(5):706-713. [DOI] [PMC free article] [PubMed] [Google Scholar]
- 23. Wang XS, Shi Q, Williams LA, et al. Inflammatory cytokines are associated with the development of symptom burden in patients with NSCLC undergoing concurrent chemoradiation therapy. Brain Behav. Immun. 2010;24(6):968-974. [DOI] [PMC free article] [PubMed] [Google Scholar]
- 24. Shi W, Misra S, Li M, et al. Inflammatory biomarkers, hematopoietic stem cells, and symptoms in breast cancer patients undergoing adjuvant radiation therapy. JNCI Cancer Spectr. 2020;4(5):pkaa037. [DOI] [PMC free article] [PubMed] [Google Scholar]
- 25. Lyon DE, Cohen R, Chen H, et al. Relationship of systemic cytokine concentrations to cognitive function over two years in women with early stage breast cancer. J Neuroimmunol. 2016;301:74-82. [DOI] [PMC free article] [PubMed] [Google Scholar]
- 26. Vardy JL, Dhillon HM, Pond GR, et al. Cognitive function in patients with colorectal cancer who do and do not receive chemotherapy: a prospective, longitudinal, controlled study. J Clin Oncol. 2015;33(34):4085-4092. [DOI] [PMC free article] [PubMed] [Google Scholar]
- 27. Alfano CM, Peng J, Andridge RR, et al. Inflammatory cytokines and comorbidity development in breast cancer survivors versus noncancer controls: evidence for accelerated aging? J Clin Oncol. 2017;35(2):149-156. [DOI] [PMC free article] [PubMed] [Google Scholar]
- 28. Waugh DJJ, Wilson C.. The interleukin-8 pathway in cancer. Clin Cancer Res. 2008;14(21):6735-6741. [DOI] [PubMed] [Google Scholar]
- 29. Ivashkiv LB. IFNγ: signalling, epigenetics and roles in immunity, metabolism, disease and cancer immunotherapy. Nat Rev Immunol. 2018;18(9):545-558. [DOI] [PMC free article] [PubMed] [Google Scholar]
- 30. Bower JE, Asher A, Garet D, et al. Testing a biobehavioral model of fatigue before adjuvant therapy in women with breast cancer. Cancer. 2019;125(4):633-641. [DOI] [PMC free article] [PubMed] [Google Scholar]
- 31. Bower JE, Ganz PA, Irwin MR, et al. Do all patients with cancer experience fatigue? A longitudinal study of fatigue trajectories in women with breast cancer. Cancer. 2021;127(8):1334-1344. [DOI] [PMC free article] [PubMed] [Google Scholar]
- 32. Katz JN, Chang LC, Sangha O, et al. Can comorbidity be measured by questionnaire rather than medical record review? Med Care. 1996;34(1):73-84. [DOI] [PubMed] [Google Scholar]
- 33. Demaria M, O’Leary MN, Chang J, et al. Cellular senescence promotes adverse effects of chemotherapy and cancer relapse. Cancer Discov. 2017;7(2):165-176. [DOI] [PMC free article] [PubMed] [Google Scholar]
- 34. Geinitz H, Zimmermann FB, Stoll P, et al. Fatigue, serum cytokine levels, and blood cell counts during radiotherapy of patients with breast cancer. In. J Radiat Oncol Biol Phys. 2001;51(3):691-698. [DOI] [PubMed] [Google Scholar]
- 35. Bower JE, Ganz PA, Aziz N, et al. Fatigue and proinflammatory cytokine activity in breast cancer survivors. Psychosom Med. 2002;64(4):604-611. [DOI] [PubMed] [Google Scholar]
- 36. Bower JE, Ganz PA.. Symptoms: fatigue and cognitive dysfunction. Adv Exp Med Biol. 2015;862:53-75. [DOI] [PubMed] [Google Scholar]
- 37. Carroll JE, Bower JE, Ganz PA.. Cancer-related accelerated ageing and biobehavioural modifiers: a framework for research and clinical care. Nat Rev Clin Oncol. 2022;19(3):173-187. [DOI] [PMC free article] [PubMed] [Google Scholar]
- 38. Campisi J. Aging, cellular senescence, and cancer. Annu Rev Physiol. 2013;75:685-705. [DOI] [PMC free article] [PubMed] [Google Scholar]
Associated Data
This section collects any data citations, data availability statements, or supplementary materials included in this article.
Supplementary Materials
Data Availability Statement
The data underlying this article will be shared on reasonable request to the corresponding author.