

Abstract
Purpose
The purpose of this study is to present a cloud-based spectral simulation tool ‘MRSCloud’ which allows MRS users to simulate a vendor- and sequence-specific basis set online in a convenient and time-efficient manner. This tool can simulate basis sets for GE, Philips and Siemens MR scanners, including conventional acquisitions and spectral editing schemes with PRESS and semi-LASER localization at 3T.
Methods
MRSCloud was built upon the spectral simulation functionality in the FID-A software package. We added three extensions to accelerate computation i.e., one-dimensional projection method, coherence pathways filters and pre-calculation of propagators. RF waveforms were generated based on vendors’ generic pulse shapes and timings. Simulations were compared within MRSCloud using different numbers of spatial resolution (21×21, 41×41 and 101×101). Simulated metabolite basis functions from MRSCloud were compared to those generated by the generic FID-A and MARSS, and a phantom-acquired basis set from LCModel. Intraclass correlation coefficients (ICC) were calculated to measure the agreement between individual metabolite basis functions. Statistical analysis was performed using R in RStudio.
Results
Simulation time for a full PRESS basis set is approximately 11 minutes on the server. ICCs were at least 0.98 between MRSCloud and FID-A and were at least 0.96 between MRSCloud and MARSS. ICCs between simulated MRSCloud basis spectra and acquired LCModel basis spectra were lowest for Gln at 0.68 and highest for NAA at 0.96.
Conclusion
Substantial reductions in runtime have been achieved. High ICC values indicated that the accelerating features are running correctly and produce comparable and accurate basis sets.
Keywords: magnetic resonance spectroscopy, simulation, basis set, coherence pathway filtering, one dimensional projection, density matrix
Introduction
Magnetic resonance spectroscopy (MRS) is a non-invasive method that uses an MRI scanner to detect radiofrequency (RF) signals from endogenous brain metabolites. Quantitative MRS has a broad range of preclinical and clinical research applications. Changes in metabolite levels can be observed in neurodegenerative, psychiatric and neurodevelopmental disorders (1,2) and are potential biomarkers for brain tumor phenotyping and tracking treatment response (3,4). Although the signals derived from each metabolite change linearly with concentration, differentiation of the signals of the large number of metabolites that are present in brain tissue is limited. Inferring the concentration of individual metabolites from the complex mixture of signals that make up the in vivo spectrum is therefore challenging. Broad access to robust, standardized, and transparent analysis workflows that convert the acquired spectrum into reproducibly measured metabolite levels is a key area of current progress in the field.
The most widely accepted approach to analyze MR spectra is linear combination modeling (LCM). In LCM, the acquired spectrum is modeled as a weighted sum of metabolite basis functions and other terms to describe background signals from mobile lipids and macromolecules and the spectral baseline. Metabolite basis sets can either be generated by numerical simulation or experimental acquisition of spectra from a set of single-metabolite phantoms. The latter is time-consuming, expensive and extremely demanding technically. Simulations based on the quantum mechanical density-matrix formalism (5) have become easier over time, with increased computing power and broadened access to simulation tools (6–13). Robust simulated basis sets can only be generated using accurate acquisition parameters, including experimentally applied vendor-appropriate RF pulse shapes, correct timings and sufficient spatial resolution (14,15). Although several simulation tools are available (6–12), their use involves a significant learning curve. Only a minority of expert MRS groups possess the detailed sequence knowledge to implement accurate basis set simulations locally. Most LCM analyses rely upon basis sets generated off-site, often with approximate, rather than exact-match parameters. This approach is feasible for fitting the large, relatively well-separated singlet resonances of NAA, choline and creatine in short-TE spectra. However, using approximated basis sets is less tolerable for lower-concentration coupled spin systems and for more complex (i.e. longer-TE and edited) experiments. Two substantial shifts have recently occurred in MRS analysis. The predominant software product in the field ‘LCModel’ (16) is no longer actively developed or supported, and at the same time a new generation of fuller-function, often open-source analysis software has been released, including FSL-MRS (17), spant (18), and Osprey (19). These tools perform LCM but access to appropriate basis sets persists as a hurdle in broadening access to the state-of-the-art MRS analyses.
The purpose of this manuscript is to introduce MRSCloud, a cloud-based basis set simulation tool. MRSCloud allows users to generate density-matrix-simulated basis sets through a simple web interface. It builds upon FID-A simulation functionality (6). FID-A can perform spatially resolved simulations using shaped pulses, but these are not optimized for simulation speed. Density-matrix simulations can be substantially accelerated by using the one-dimensional (1D) projection method (20) and applying coherence pathway filters (21,22) to replace phase cycling. Cloud-based basis set generation reduces the expertise required to carry out spectral analysis and quantification. Users require basis sets for conventional and edited MRS experiments (23), including Hadamard-encoded editing (24,25). MRSCloud implements the 1D projection method (20), coherence pathway filters (22) and pre-calculation of propagators (26) within the FID-A code base. Parameters specified by the user include localization method (PRESS (27) or semi-LASER (28,29)), vendor (GE, Philips, Siemens and the standardized universal sequence (30)), spectral editing schemes (unedited, MEGA (31), HERMES (24), HERCULES (25)), metabolite list, spatial resolution, echo time (TE) and editing pulse frequencies. It allows community users to generate vendor-, sequence-, and editing-experimental-specific basis sets that are appropriate for their studies.
Methods
Development of simulations
This cloud implementation builds upon the simulation tools of FID-A, implementing three accelerations, which are described in the following sections.
1D projection method
Spatially resolved simulations are time-consuming, but necessary in order to capture spatial heterogeneity of coupling evolution. In the original FID-A implementation of spatial simulations, each spatial direction was governed by a loop, and the full sequence was simulated for each spatial location. Simulating nx, ny, and nz spatial points in the x-, y- and z-direction, respectively amounts to performing nx × ny × nz simulations of the sequence. Zhang et al. (20) demonstrated that a more efficient way to achieve three-dimensional simulations is to average across each spatial dimension after simulating each one-dimensional frequency-selective RF pulse. In PRESS localization, for example, the first spatial averaging can be performed after simulation of the slice-selective excitation pulse (and the appropriate accompanying rephase gradient). In the MRSCloud implementation, the excitation pulse is not explicitly simulated, but approximated by an ideal excitation (appropriate for most circumstances because imperfect excitation only results in an amplitude and phase modulation of the signal). An additional spatial averaging step is performed after the first slice-selective refocusing pulses, and then finally after the second slice-selective refocusing pulse. The total simulation time decreases from the order of (ny × nz) to (ny + nz)/2 (assuming the ideal-excitation approximation of FID-A).
Coherence pathway filters
Slice-selective refocusing relies upon coherence pathway selection to suppress signals from outside the intended slice. In the sequence itself, this is usually achieved both by phase cycling (22) and the coherence transfer pathway selection gradient scheme. Typically, simulations are not performed with sufficient spatial resolution for simulated gradients (7) alone to accurately suppress out-of-voxel signal, and simulations rely upon phase cycling. The commonly used EXORCYCLE (32) scheme is a suitable four-step phase cycle; independent EXORCYCLE of the two refocusing pulses results in a sixteen-step phase cycle (i.e. the simulation is repeated 16 times with different RF pulse phases and simulated receiver phase). In FID-A, it is common to approximate this with a half-EXOCYCLE on each pulse, resulting in a four-step phase cycle.
The MRSCloud implementation removes the need for phase cycling by applying coherence pathway filters (7,9,10). The different elements of the density matrix can each be classified in terms of their coherence order, and unwanted elements can be zeroed (equivalent to perfect coherence transfer pathway selection). Each simulated RF pulse in the sequence is immediately followed by a coherence-order filter, so that only density-matrix elements of the intended order are propagated further in the simulation. Since each element of the density matrix can be classified as a single coherence order, this filter involved first classifying the “P-matrix” which is an integer matrix containing the coherence order of each element of the density matrix, and then simply zeroing all entries of the density matrix that do not have the desired order. The coherence transfer pathway to be selected for edited spin-echo methods is the pathway that ends on −1-coherence, and has its coherence polarity inverted by each slice-selective pulse and unaffected by each editing pulse.
Pre-calculation of propagators
Within FID-A, shaped pulses are calculated elementwise each time they are applied. For example, a 256-point shaped refocusing pulse is simulated as 256 individual 3D rotations. This involves a substantial amount of redundant calculation that can be avoided by pre-calculation of the pulse propagators. Simulating each pulse then becomes a matter of applying the appropriate propagator, rather than serially calculating and then applying 256 individual propagators. The saving arises both because refocusing and editing pulses are repeated within the sequence and, in cases where the previous two accelerations have not been implemented, for phase cycling and spatial purposes.
Figure 1a illustrates the accelerated MRSCloud simulation for the example of MEGA-PRESS, in terms of its constituent propagation operations.
Figure 1:
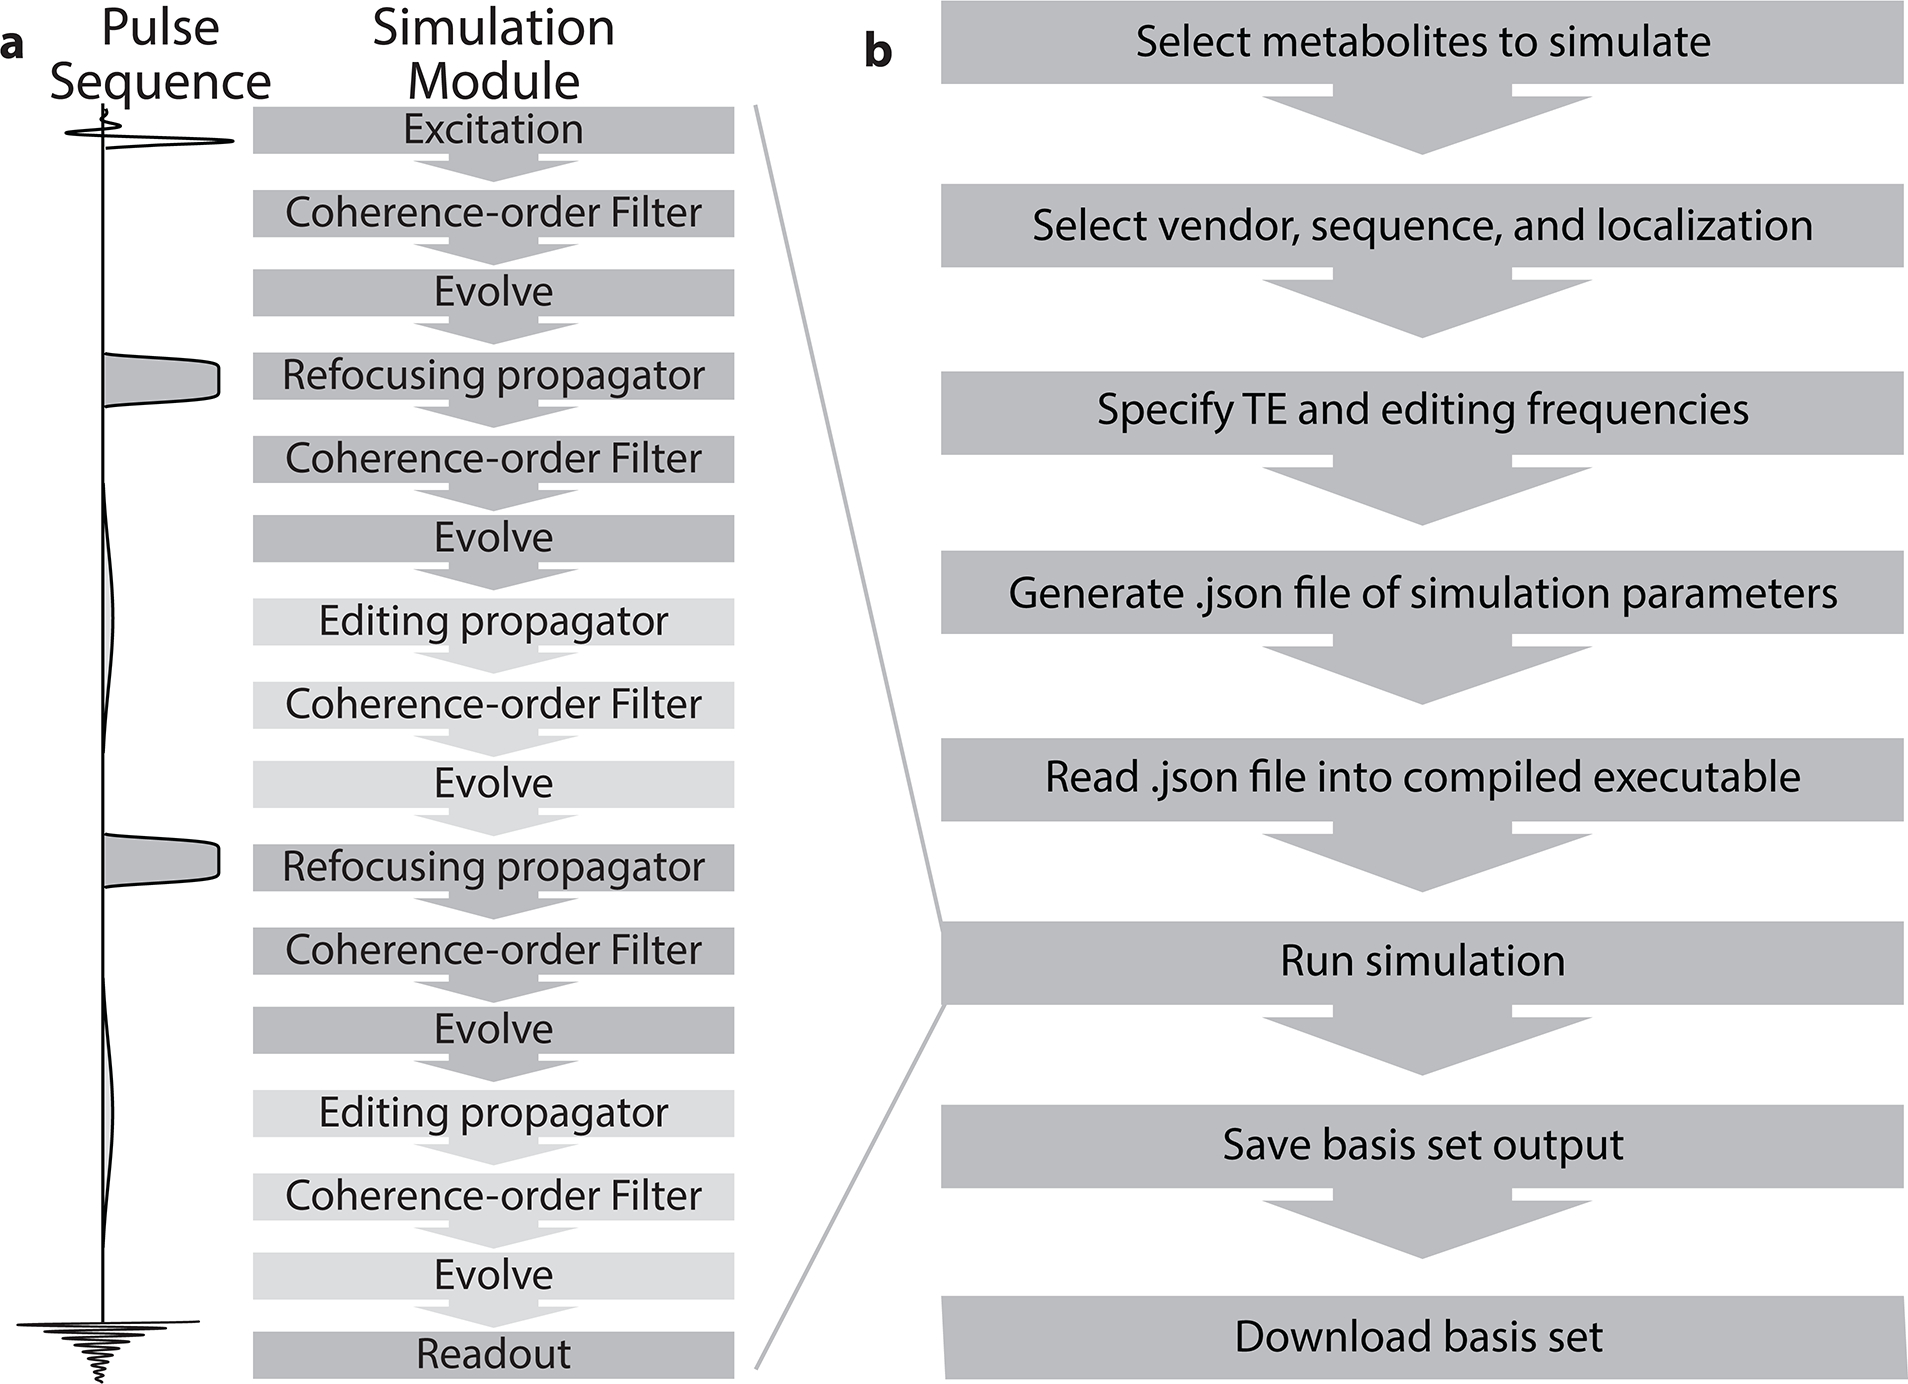
Flowchart for a) simulation module along the sequence diagram and b) MRSCloud pipeline
GUI specification of simulation parameters
Figure 1b outlines the pipeline for a given MRSCloud simulation. Firstly, the user specifies the metabolites to be simulated, from a list of 32. Of those, 25 use FID-A spin-system definitions (6,15), many of which are parameterized from (33,34), augmented by other metabolites including cystathionine, ethanolamine, homocarnosine, lysine, phosphorylethanolamine, threonine and valine (33–37). Next the user specifies the vendor (GE, Philips, Siemens or Universal), sequence options (Unedited, MEGA, HERMES or HERCULES (24,25,31)) and localization method (PRESS or semi-LASER). TE can be defined for Unedited and MEGA simulations, and is fixed at 80 ms for HERMES and HERCULES. Editing frequencies of ON and OFF scans are user-defined for MEGA (default edit-on/-off: 1.9/7.5 ppm) and fixed for HERCULES (1.9/4.18/4.58 ppm) and HERMES (GABA/GSH 1.9/4.56 ppm). Whereas MEGA consists of two sub-experiments with editing pulses ON and OFF, HERMES and HERCULES are Hadamard-encoded sequences targeting multiple metabolites using four sub-experiments. The editing targets are by default for, as mentioned, GABA/GSH for HERMES and GABA/GSH plus Lac, Asc, Asp, NAA and NAAG for HERCULES. Full details can be found in (24,25). The GUI for MRSCloud is shown in Figure 2. Once the user presses submit, user inputs are stored in a declaration file (.json) that is loaded into the precompiled simulation executable to execute the desired simulation. The basis set output is then saved on the server for 60 days for user download. All code was written in MATLAB (R2020b, MathWorks, Natick, USA), and compiled as an executable file to run on the server with MATLAB Runtime. Simulations are performed with a simulated B0 field strength of 3.0 T for Philips and GE, and 2.89 T for Siemens.
Figure 2:
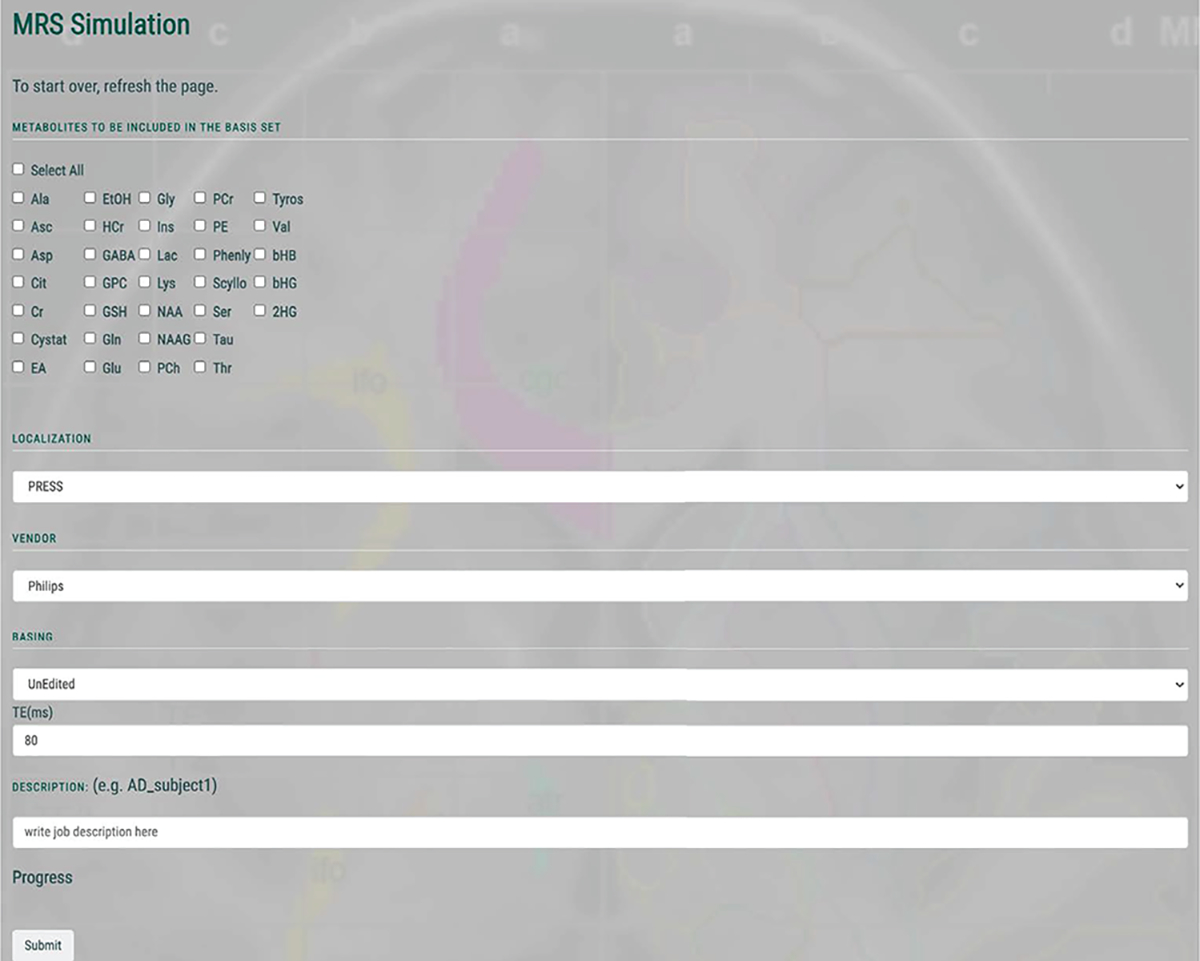
GUI of MRSCloud
RF waveforms
MRSCloud simulations allow exact simulation of vendor-specific RF pulse shapes e.g. (30,38,39). For sLASER, GOIA-WURST refocusing pulses (bandwidth 8 kHz, duration 4.5 ms, B1 15 uT) are simulated (40,41). Editing pulse durations for MEGA sequences are determined from TE (14 ms for TE = 68 ms; 20 ms for TE = 80 ms). Editing pulses were generated using a sinc-Gaussian pulse for Philips and GE (bandwidth 88 Hz, duration 14 ms), and the standardized universal sequence (bandwidth 86 Hz, duration 14 ms) and Hanning-filtered pulse (bandwidth 48 Hz, duration 25.6 ms) for Siemens. 20-ms (bandwidth 62 Hz) editing pulses are simulated for HERMES and HERCULES; dual-band editing pulses are generated using a cosine modulation of the editing pulse.
Spatial Resolution
A spatial array of simulations (of 101×101 resolution, by default) is carried out across a field of view that extends 50% larger than the nominal voxel size in the two dimensions defined by refocusing pulses. Combining the spatial simulations into a single whole-voxel simulation was achieved by adding all the simulations and then dividing by the number of simulations corresponding to locations within the binary voxel mask. This spatial normalization reduced effects associated with the interaction between the different spatially sampling resolution and the voxel edge. In order to investigate the impact of spatial resolution, MRSCloud simulations were performed with resolutions of 21×21, 41×41 and 101×101. Edited GABA signals from MEGA, HERMES and HERCULES for PRESS and sLASER at TE of 80 ms were compared using intraclass correlation coefficient (ICC).
Testing and validation
The speed of simulation was tested locally on a MacBook Pro (2.3 GHz Quad-Core Intel Core i5, 16 GB LPDDR3 memory) and on the MRSCloud server (2.26 GHz 8-cores CPU supporting 16 threads, 24G RAM). Simulations were carried out using PRESS localization with unedited, MEGA, HERMES and HERCULES sequences. 25 major metabolites (Ala, Asc, Asp, Cit, Cr, EtOH, GABA, GPC, GSH, Gln, Glu, Gly, mI, Lac, NAA, NAAG, PCh, PCr, Phenyl, Scyllo, Ser, Tau, Tyros, bHB and 2HG) were included. For local testing, basis sets were generated using 21×21, 41×41 and 101×101 spatial points. For MRSCloud server testing, simulations were performed using the default setting of 101×101 spatial points. As server performance was usage-dependent, simulation speed was tested at three different times of day and the average simulation time was reported.
The first stage of validation of the MRSCloud basis sets is to compare them to equivalent basis sets produced by the release version of FID-A (i.e. without the implementation of coherence pathway filtering and pre-calculation of propagators). As downloaded in May 2021, FID-A includes the 1D projection method, but not the other improvements implemented in MRSCloud. Basis functions were simulated in MRSCloud and FID-A for 8 commonly used metabolites (Cr, GABA, Gln, Glu, mI, Lac, NAA, PCh) with PRESS localization at TEs of 30 ms and 68 ms using 41×41 spatial points. 8192 spectral points were sampled at a spectral width of 4000 Hz and line broadened by 1 Hz. Basis set simulations were performed locally in MATLAB using the pre-compiled MRSCloud code and the official FID-A package version. Simulated spectra in the basis sets directly from MRSCloud and FID-A were compared. All figures for comparisons were generated using MATLAB. Spectral results obtained from the two methods were compared using ICC. Discrepancies between basis sets were quantified using a normalized root-mean-square value. In the second stage of validation, an MRSCloud basis set (unedited Philips PRESS TE of 30 ms) was compared to an equivalent one generated with the MARSS software (available online: http://juchem.bme.columbia.edu/mr-spectroscopy-basis-sets). Again, ICC and normalized root-mean-square differences were calculated for each metabolite. Finally, an MRSCloud simulated basis set was compared to an experimentally acquired basis set, available for LCModel (press_te30_3t_01a.basis; http://.s-provencher.com/lcm-basis.shtml). All statistical analyses were performed using R (Version 4.0.2) in RStudio (Version 1.2.5019, Integrated Development for R. RStudio, PBC, Boston, MA). All spectra were compared across the full spectral range, with spectra processed to a 1 Hz FWHM linewidth.
Results
MRSCloud has been successfully established, offering web-based basis set simulation for the community through the portal: https://braingps.mricloud.org/mrs-cloud. MriCloud is a website providing cloud-based medical image processing services. It was developed by Center for Imaging Science Laboratory for Brain Anatomical MRI Center for Brain Imaging, AnatomyWorks LLC, supported in part by NIH/ NIBIB funding. Users are required to register and log in to the portal. Personal information including names and emails are only for internal record and will not be shared. Source code for MRSCloud is available on GitHub: https://github.com/shui5/MRSCloud. Basis sets can be downloaded in the same portal in two output formats: .mat for Osprey and .basis for LCModel. The .mat file contains time- and frequency-domain information for each simulated metabolite, allowing users to convert their basis set to additional formats as required. The basis functions for edited sequences include results for each edited sub-experiment as well as sum and difference combinations. Each zipped basis set downloaded online from MRSCloud also includes a PDF image of the spectra, generated using the plot basis function integrated from Osprey (19), for quality assurance; an example of this output for 3 T MEGA-PRESS (TE = 68 ms) is shown in Figure 3.
Figure 3:
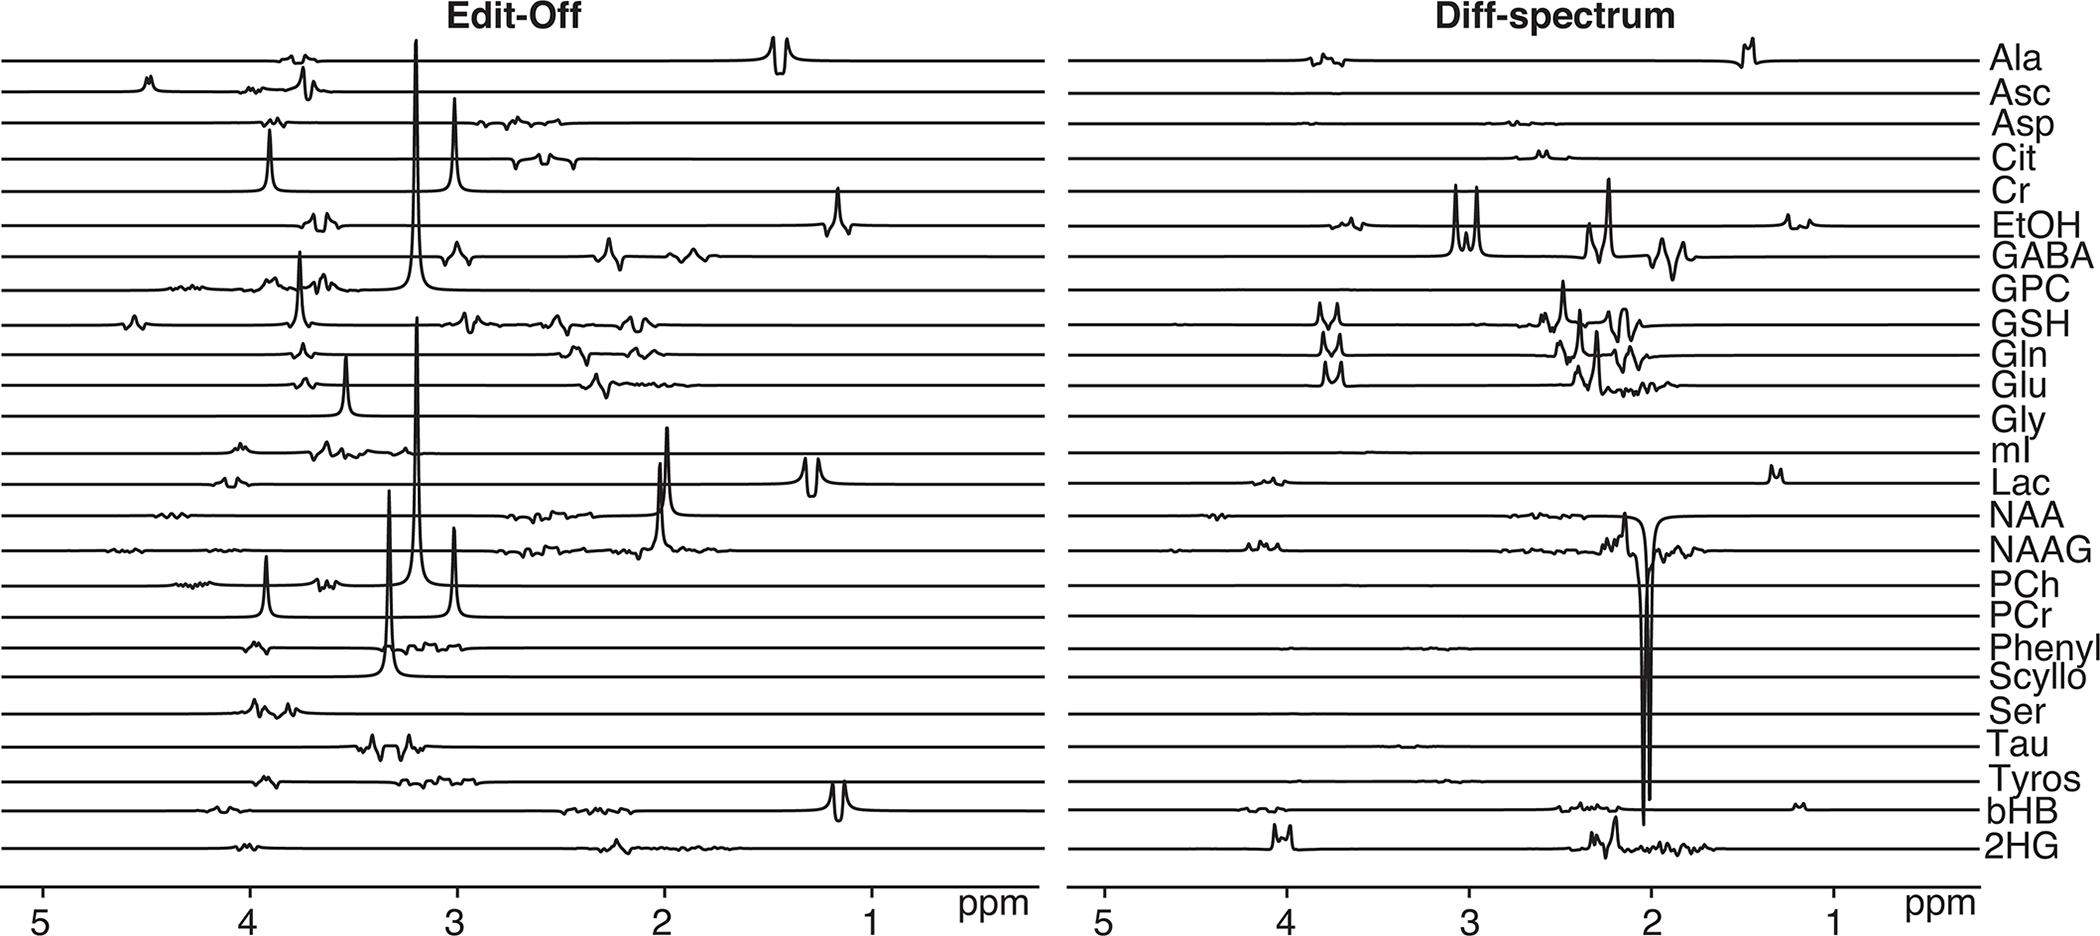
Basis set components for 3 T MEGA-PRESS GABA-editing at TE 68 ms simulated using MRSCloud
MEGA, HERMES and HERCULES simulations of the GABA-edited difference signal at spatial resolutions of 21×21, 41×41 and 101×101 are shown in Figure 4a for PRESS and 4b for sLASER localization. GABA integrals at 3 ppm were slightly larger for larger numbers of spatial points as shown in the middle panel of Figure 4, and diff spectra of different spatial resolutions are shown in the right panel. Simulation time of 101×101 spatial points for GABA, a strongly coupled 6-spin system, was less than 1 minute for all three sequences locally. ICCs among the different spatial resolutions were higher than 0.99 for all three sequences in both PRESS and sLASER.
Figure 4:
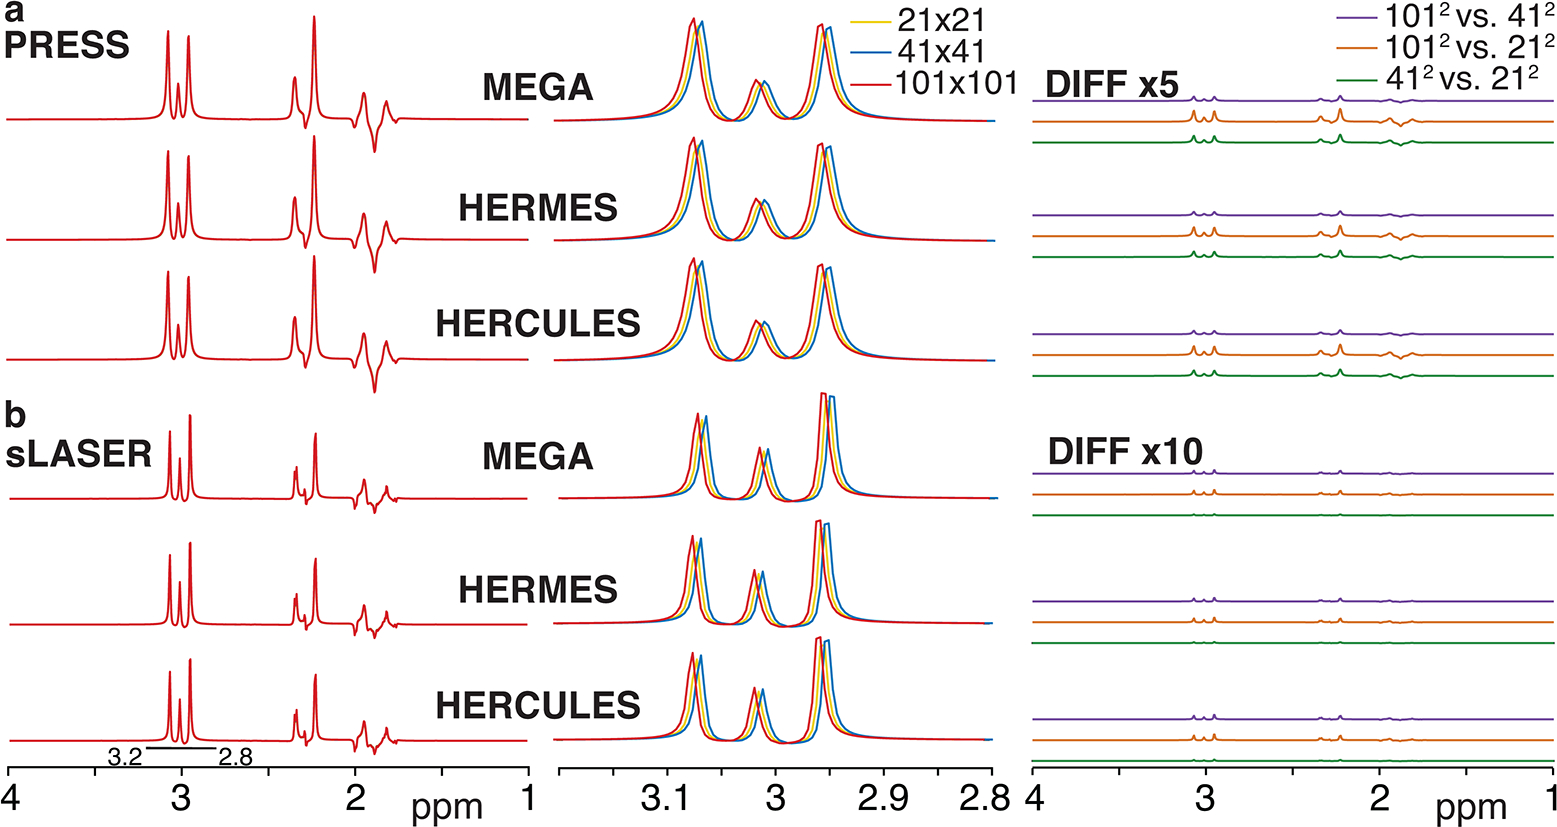
Simulated GABA-edited difference spectra using MEGA, HERMES and HERCULES with a) PRESS and b) sLASER localization, at 21×21, 41×41 and 101×101 spatial resolutions are shown in the left panel. The 3-ppm edited signal is expanded as shown in the middle panel (the 41×41 and 101×101 spectra are slightly offset to right and left respectively to the 21×21 spectrum for visualization). Difference spectra to compare spatial resolutions are shown in the right panel (x5 scale for PRESS and x10 scale for sLASER for visualization).
Simulation times, reported in Table 1, increase with the number of spatial points and the complexity of the sequence. The local simulation time was between 3 and 12 minutes for a full basis set. Simulation time on the server was longer between 11 and 25 minutes for different sequences. The time required to simulate a full basis set on the server is similar when run at different times during the day.
Table 1:
Time for simulating a full basis set (25 metabolites) for different sequences using Philips PRESS localization.
| TE | Local Simulation Time (sec) | Server (sec) | |||
|---|---|---|---|---|---|
| 21×21 | 41×41 | 101×101 | 101×101 | ||
|
| |||||
| Unedited | 30 | 183 | 215 | 270 | 676 |
| MEGA | 68 | 300 | 320 | 388 | 947 |
| HERMES | 80 | 545 | 628 | 719 | 1444 |
| HERCULES | 80 | 556 | 651 | 732 | 1490 |
Unedited PRESS simulations at TE = 30 ms and TE = 68 ms using MRSCloud were comparable to FID-A simulations, as shown in Figure 5. Local simulation time for MRSCloud was reduced by a factor of 9 compared to the native FID-A simulation. Results from all simulated metabolites indicated both methods generated very similar lineshapes and signal patterns. ICCs were higher than 0.98 for all tested metabolites, indicating high similarity for the basis functions generated using MRSCloud and the native FID-A simulations. Discrepancy for the corresponding metabolites between the two methods is presented in the same figure. The normalized root-mean-square value of the differences are under 1% for all metabolites, as shown in Table 2.
Figure 5:
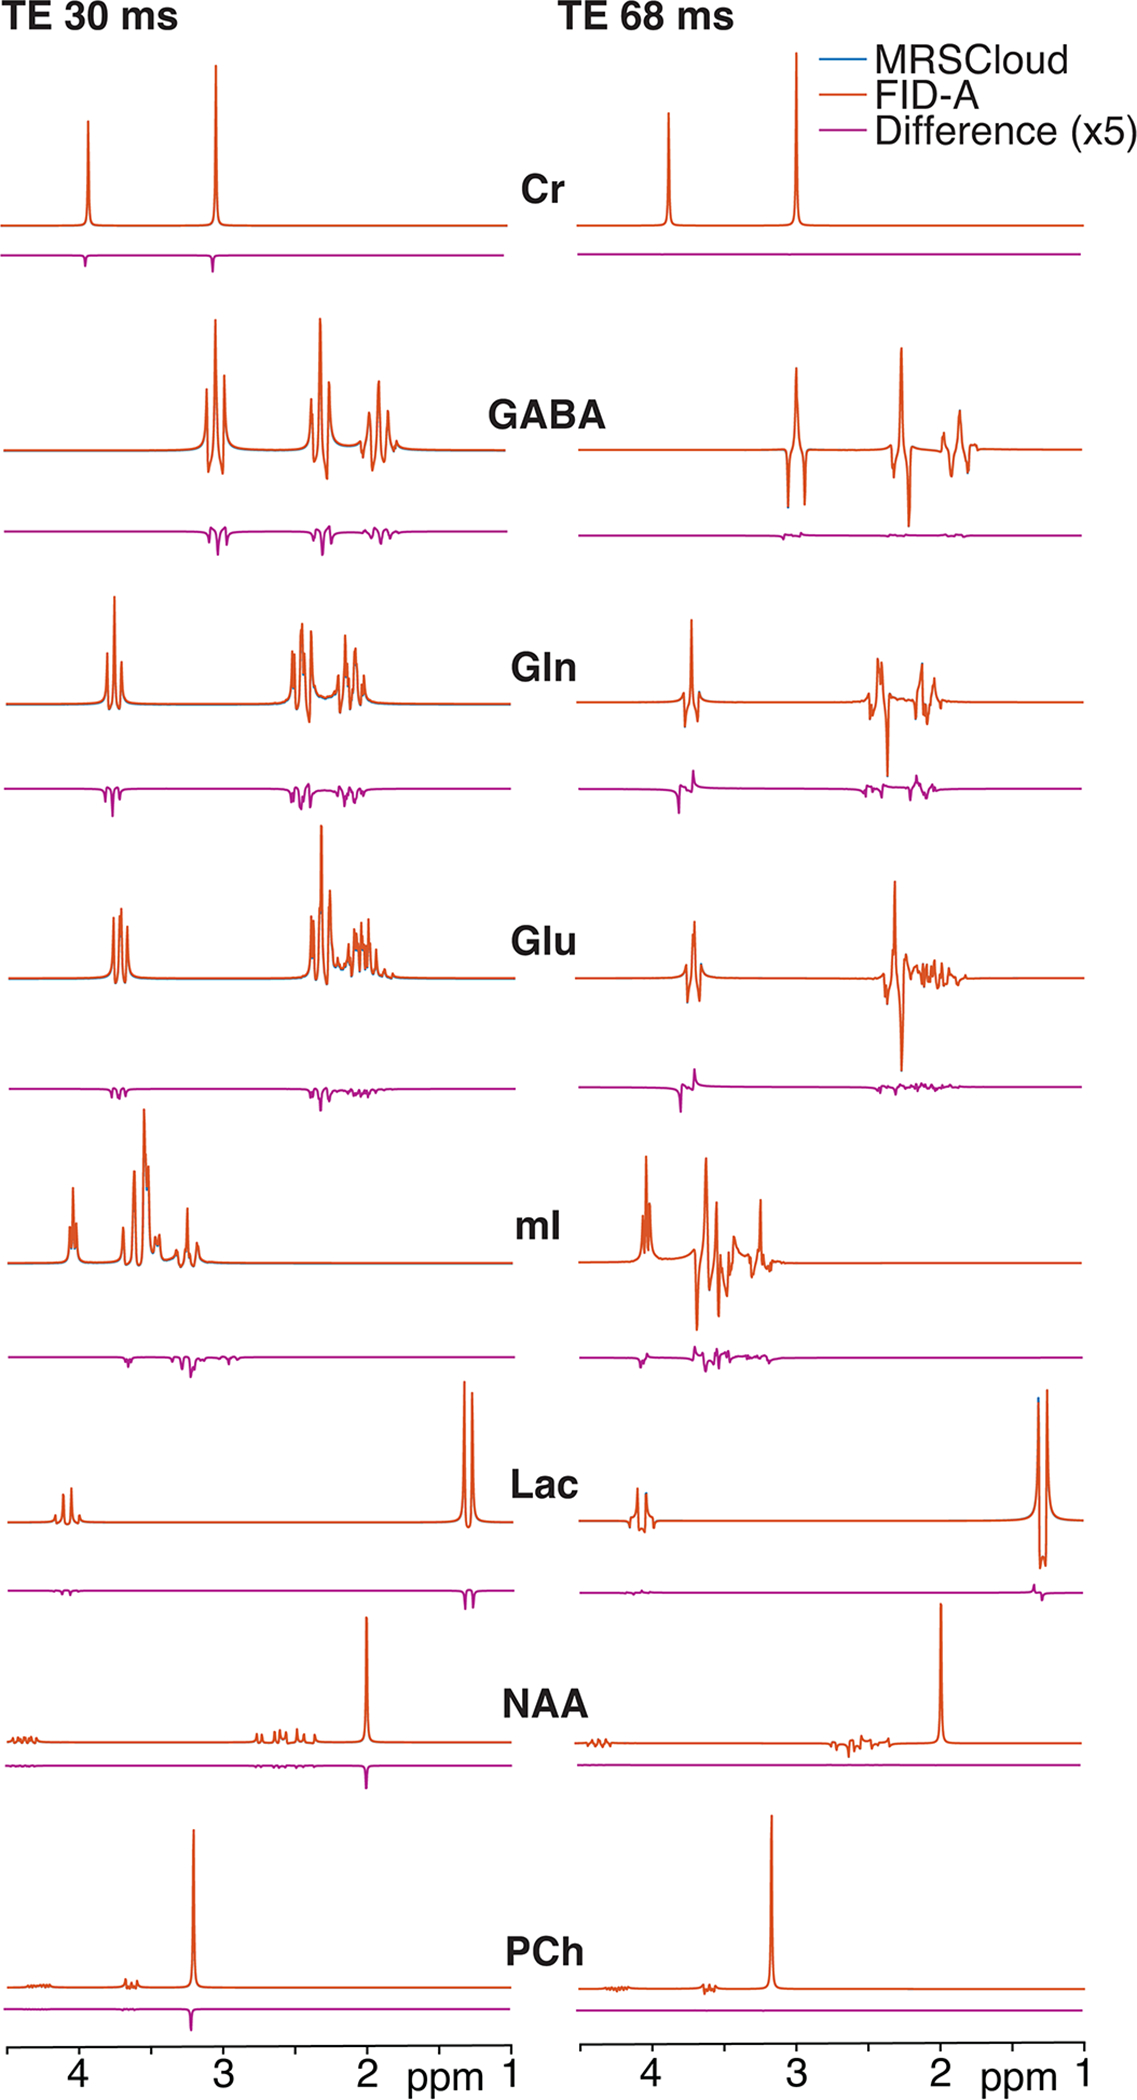
Comparison between MRSCloud and local FID-A short-TE basis functions for 8 major metabolites (41×41 spatial points). All difference spectra are plotted at x5 scale for visualization.
Table 2.
Normalized root-mean-square differences between MRSCloud basis spectra and FID-A, MARSS and LCModel.
| Compared to: | Cr | GABA | Gln | Glu | mI | Lac | NAA | PCh |
|---|---|---|---|---|---|---|---|---|
|
| ||||||||
| FID-A TE 30 | 0.088% | 0.3% | 0.38% | 0.59% | 0.28% | 0.1% | 0.098% | 0.06% |
| FID-A TE 68 | 0.0031% | 0.054% | 0.023% | 0.046% | 0.021% | 0.17% | 0.0073% | 0.0022% |
| MARSS | 3.8% | 6.0% | 5.6% | 8.3% | 5.8% | 3.9% | 3.3% | 3.2% |
| LCModel | 6.2% | 11.3% | 22.5% | 11.6% | 4.7% | 9.6% | 2.2% | 2.9% |
Results from MRSCloud agreed well with those from MARSS as shown in Figure 6. Differences were more pronounced for coupled spin systems like GABA, Glu and Gln. ICCs were higher than 0.96 for all tested metabolites. The normalized root-mean-square differences are below 9% for all metabolites, and shown in Table 2.
Figure 6:
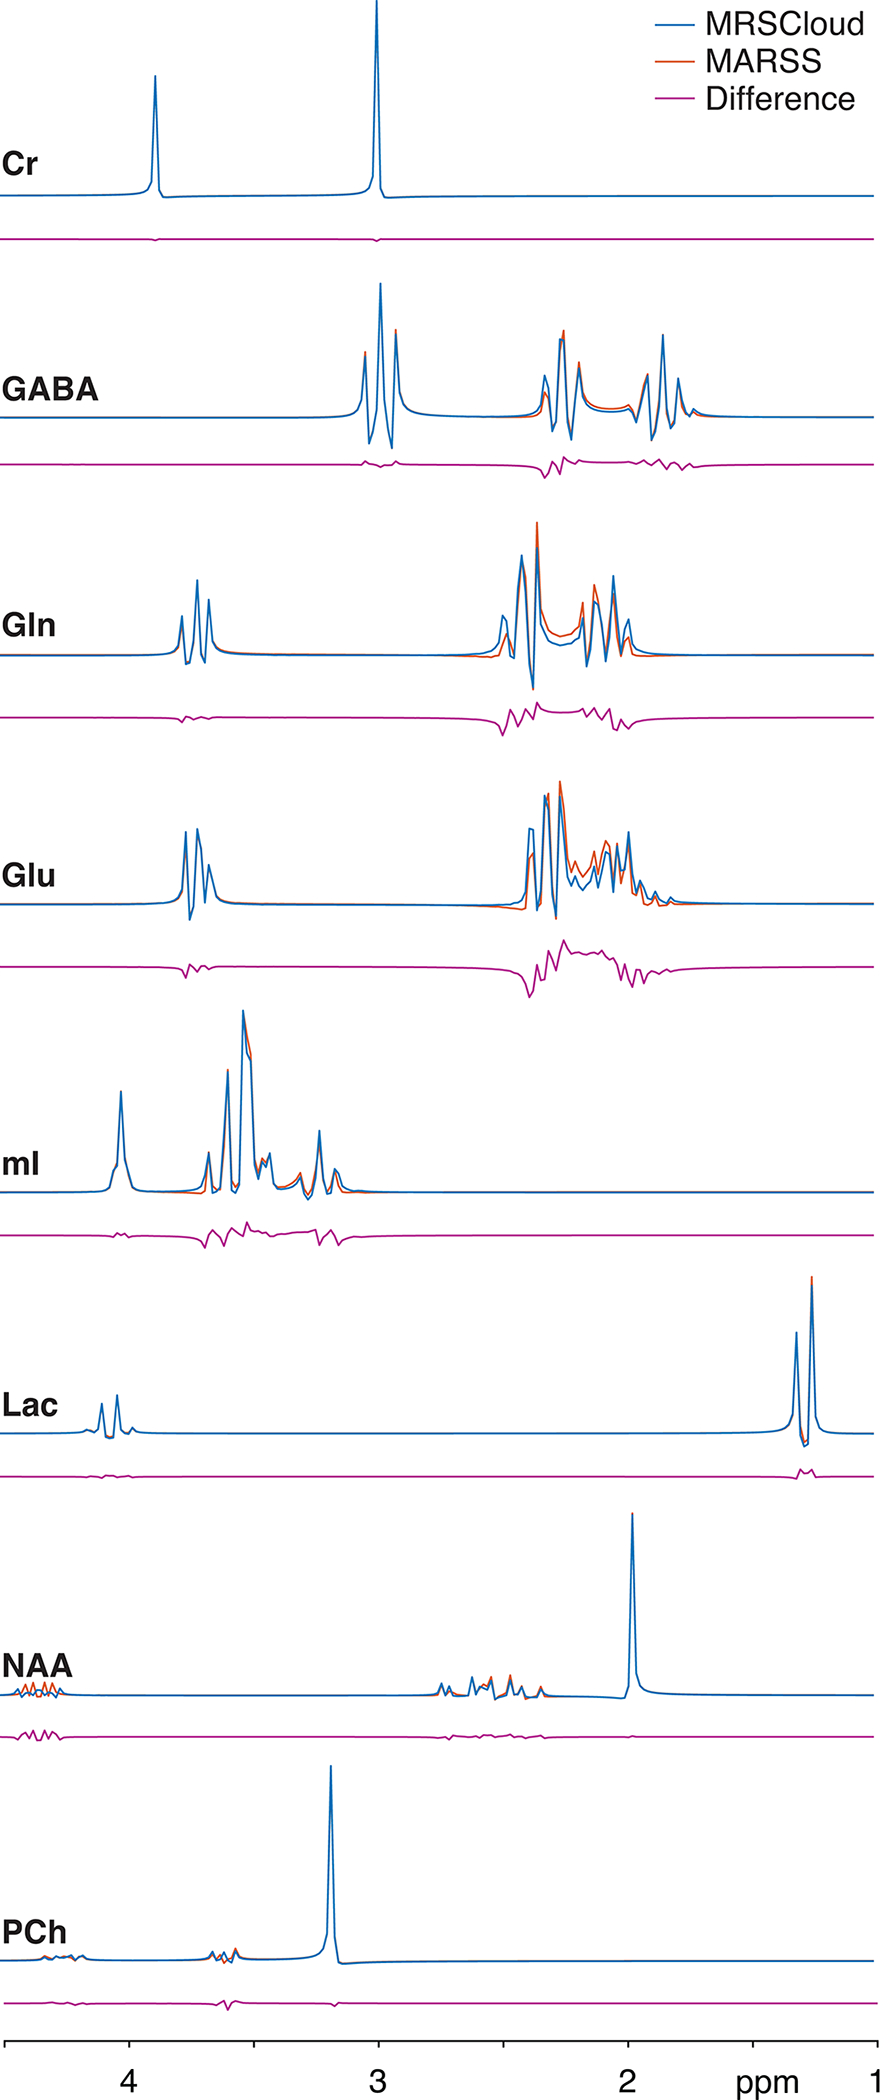
Comparison between MRSCloud (41×41 spatial points) and MARSS in 8 major metabolites for PRESS at TE 30 ms.
The MRSCloud-simulated spectra were in reasonable agreement with the experimentally measured basis set that is available from the LCModel as shown in Figure 7. ICCs were lowest for Gln at 0.68 and highest for NAA at 0.96 which corresponded to the largest and smallest root-mean-square values for LCModel in Table 2.
Figure 7:
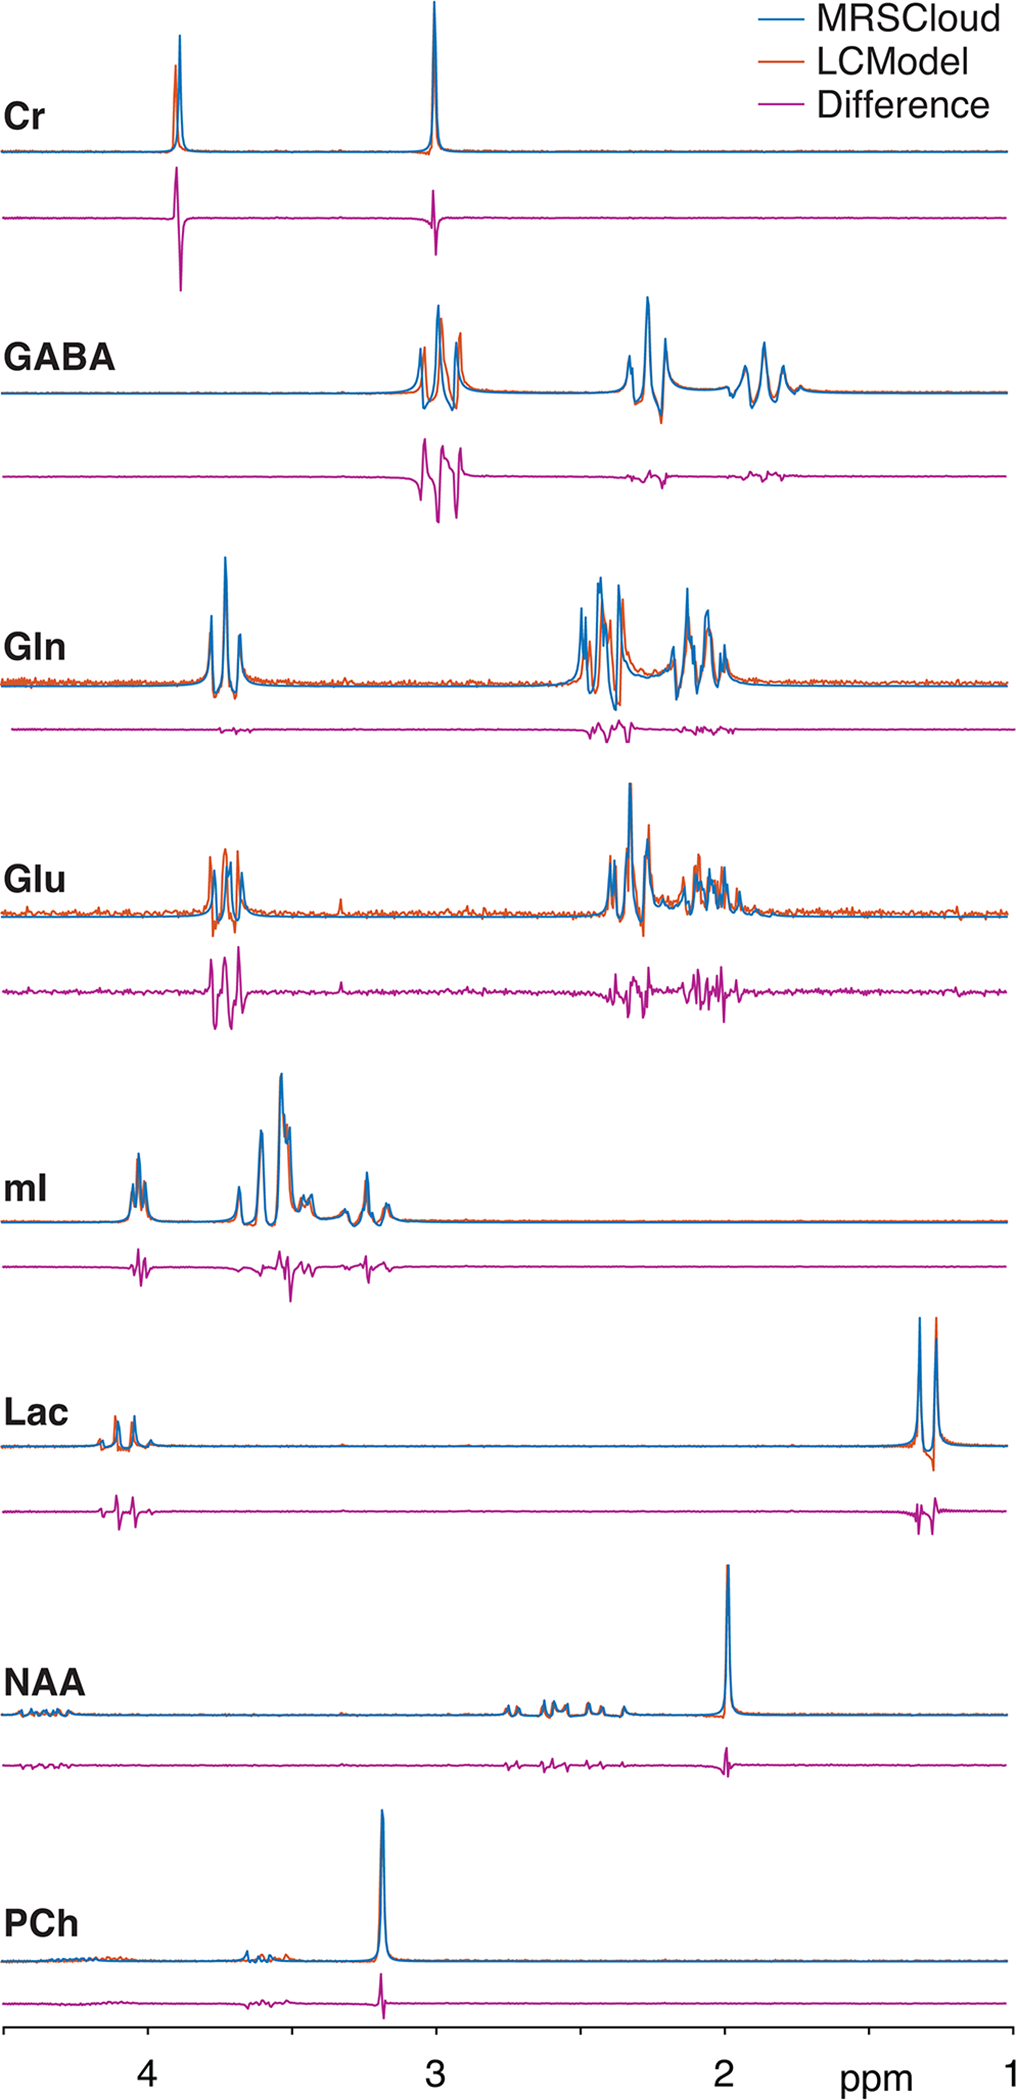
Comparison between MRSCloud (41×41 spatial points) and LCModel in 8 major metabolites for PRESS at TE 30 ms.
Discussion
MRSCloud is a cloud-based simulation tool for the MRS community, offering fast and reliable basis set generation for up to 32 metabolites. This improves access to basis sets that more closely represent the timing and RF pulse shapes of vendor specific sequences. Substantial reductions in runtime have been achieved by implementing the 1D projection method, coherence-order filtering, and pre-calculation of propagators.
Each implementation benefits the speed and precision of the simulations. The 1D projection method accelerates the process by decreasing the number of simulations to the factor equivalent to the number of spatial points. This implementation allows efficient generation of metabolite responses with high spatial resolution, which is necessary to accurately reflect the spatial effects of imperfect excitation and refocusing, i.e. realistic slice profiles. Coherence order filtering helps the selection of appropriate coherence pathway to avoid the necessity to simulate full phase cycling, which accelerates the processing time by a factor equivalent to the number of phase cycles. This implementation also improves quality of simulations by providing the equivalent effect of including gradient to handle unwanted magnetizations or coherences. It is important especially for simulation using PRESS localization and strongly coupled matebolites sensitive to chemical shift displacement error (42). These two features are now available in the latest version of the native FID-A as well, which is the basis of MRSCloud. Pre-calculation of the propagator has been used to replace the multiple calculations of the density matrix time evolution operator for each individual pulse. It reduces the number of calculations from the square of the number of pulse samples to a one-time calculation. All 3 implementations dramatically reduce the simulation time. Table 1 shows that a full basis set simulation takes approximately 11–25 minutes on MRSCloud (with negligible variation over the course of a day) and 3–12 minutes locally for different sequences. The time difference between the local machine and the cloud server is partly due to the performance of the processors. An additional factor is the improved implementation of parallel computing in MATLAB; the current parpool functions used on the local machine replace the older matlabpool functions used on the server.
Simulations of edited sequences with different spatial resolutions (21×21, 41×41 and 101×101) have been carried out using MRSCloud (the default setting is 101×101 spatial points). Differences are small as indicated by the high ICC values. Our result supports the conclusions of another study for the spectral shape of unedited GABA (9). Coherence order filtering is particularly important because it accurately models the dephasing effects of crusher gradients especially when the number of spatial points is small. Potential discrepancies in lineshape could be driven by the coherence transfer pathway selection offered by direct filtering of the density matrix, as compared to incomplete phase-cycling of refocusing pulses. However, both ICCs and root-mean-square values indicate that the lineshapes and signal patterns for all compared metabolites match very well, verifying that the coherence order filtering produces results equivalent to the traditional phase cycle method, in a much more time-efficient manner. MRSCloud has also been compared with MARSS. Similar spectral shape and small differences from basis functions, as shown in Figure 6, suggest that basis sets from both packages are comparable. High ICCs indicated good agreement between simulated spectra from the two methods. More complex coupled metabolites such as GABA, Gln and Glu have a greater discrepancy of root-mean-square values (5–8%). These differences are possibly caused by the different waveforms and timings which more significantly affect the multiplet coupled metabolites after signal evolution. LCModel has been the most used software for spectral modeling and analysis for over two decades. However, basis set comparison between MRSCloud and LCModel is challenging because limited information has been provided for the acquisition of the basis sets. Information from the user’s manual and observation from the vendor provided basis set namely ‘press_te30_3t_01a.basis’ in LCModel suggested that it is measured using phantom rather than simulation. Inaccuracies in the spin-system parameters used for simulations, in addition to changes due to the pH and temperature of the phantom could be the leading causes of discrepancy between measured and simulated results. Waveforms and timings for the measured basis set are not well documented, and likely differ from the MRSCloud simulation. All those factors contribute to the high ICC values especially for the more complex coupled metabolites including GABA, Gln and Glu. However, basis sets generated using MRSCloud have been successfully used in LCModel.
Recently, MEGA has become a product sequence in the latest releases in at least two scanner vendors (i.e. Philips and Siemens), often allowing user-specified TE and editing pulse frequencies. MRSCloud users can simulate the experiment they run, to obtain basis sets for edited detection of, e.g. ethanol (applying editing pulses at 3.65 ppm to detect the signal at 1.17 ppm), phosphorylethanolamine (3.22 ppm and 3.98 ppm) for neurodegenerative diseases (43), and 2HG (1.9 ppm and 4.02) for glioma (3). Flexibility of TE allows optimal editing of a range of metabolites, including GABA (68 ms), Lac (140 ms) and Citrate (145 ms). In MRSCloud, there is an option of ‘Universal’ beside the three major vendors, which simulates basis sets for the universal sequence (30). Although it is not a vendor generic sequence, it has standardized the pulse shape and duration, bandwidth, maximum B1 power and other parameters including TE1, TE2 across multiple vendors.
The implementation on MRSCloud does have a number of limitations. One key compromise that has been struck is between ease of use and degree of flexibility of simulations. Since the underlying code is also being made available, allowing more advanced users to further specify their simulations, this balance has been set to favor ease of use by limiting the number of user-specified parameters that are available. When the user selects the ‘Philips’ option, for example, the propagators applied correspond to RF pulses with the shape, amplitude and timing of common Philips sequences. These parameters are altered in response to different hardware configurations and scanner protocol settings. The simulation performed corresponds to the most commonly used parameter set, but cannot accurately capture all possible Philips experiments. Similarly, the simulations cannot capture all differences between the different disseminated versions of MEGA-PRESS within each vendor. A second key limitation of any simulated approach to basis set generation is the spin-system parameters themselves - the literature of these parameters still rests to a large degree on the work of Govindaraju et al. (33,34) with minor updates to e.g. GABA (15) and supplemented by additional metabolites (35–37). MRSCloud also simulates a limited subset of experiments and the inclusion of e.g. STEAM or SPECIAL localization would be a valuable future addition.
In conclusion, MRSCloud facilitates the generation of basis set for the MRS community in a convenient and time-efficient style. It provides simulation of the common metabolites in addition to some specific ones related to brain pathology such as tumor. Basis sets are saved in different formats that are compatible with commonly used modeling packages. The purposed work hoped to ease the prior knowledge required to simulation an accurate basis set so that spectral analysis can be carried out in clinical sites or academic units without the presence of a spectroscopist.
Acknowledgement
This work was supported by NIH grants R01 EB016089, R01 EB023963, R21 AG060245, R00 AG062230, K99 DA051315 and P41 EB031771.
References
- 1.Maddock RJ, Buonocore MH. MR spectroscopic studies of the brain in psychiatric disorders. Curr Top Behav Neurosci 2012;11:199–251. [DOI] [PubMed] [Google Scholar]
- 2.Oz G, Alger JR, Barker PB, et al. Clinical proton MR spectroscopy in central nervous system disorders. Radiology 2014;270(3):658–679. [DOI] [PMC free article] [PubMed] [Google Scholar]
- 3.Choi C, Ganji SK, DeBerardinis RJ, et al. 2-hydroxyglutarate detection by magnetic resonance spectroscopy in IDH-mutated patients with gliomas. Nat Med 2012;18(4):624–629. [DOI] [PMC free article] [PubMed] [Google Scholar]
- 4.Weinberg BD, Kuruva M, Shim H, Mullins ME. Clinical Applications of Magnetic Resonance Spectroscopy in Brain Tumors: From Diagnosis to Treatment. Radiol Clin North Am 2021;59(3):349–362. [DOI] [PMC free article] [PubMed] [Google Scholar]
- 5.Fano U Description of States in Quantum Mechanics by Density Matrix and Operator Techniques. Reviews of Modern Physics 1957;29(1):74–93. [Google Scholar]
- 6.Simpson R, Devenyi GA, Jezzard P, Hennessy TJ, Near J. Advanced processing and simulation of MRS data using the FID appliance (FID-A)-An open source, MATLAB-based toolkit. Magn Reson Med 2017;77(1):23–33. [DOI] [PubMed] [Google Scholar]
- 7.Young K, Matson GB, Govindaraju V, Maudsley AA. Spectral simulations incorporating gradient coherence selection. J Magn Reson 1999;140(1):146–152. [DOI] [PubMed] [Google Scholar]
- 8.Naressi A, Couturier C, Castang I, de Beer R, Graveron-Demilly D. Java-based graphical user interface for MRUI, a software package for quantitation of in vivo/medical magnetic resonance spectroscopy signals. Comput Biol Med 2001;31(4):269–286. [DOI] [PubMed] [Google Scholar]
- 9.Landheer K, Swanberg KM, Juchem C. Magnetic resonance Spectrum simulator (MARSS), a novel software package for fast and computationally efficient basis set simulation. NMR Biomed 2021;34(5):e4129. [DOI] [PubMed] [Google Scholar]
- 10.Bak M, Rasmussen JT, Nielsen NC. SIMPSON: a general simulation program for solid-state NMR spectroscopy. J Magn Reson 2000;147(2):296–330. [DOI] [PubMed] [Google Scholar]
- 11.Veshtort M, Griffin RG. SPINEVOLUTION: a powerful tool for the simulation of solid and liquid state NMR experiments. J Magn Reson 2006;178(2):248–282. [DOI] [PubMed] [Google Scholar]
- 12.Soher B, Semanchuk P, Todd D, Steinberg J, Young K. Vespa: Integrated applications for RF pulse design, spectral simulation and MRS data analysis. 19th Meeting ISMRM. Montreal; 2011. [DOI] [PMC free article] [PubMed] [Google Scholar]
- 13.Smith SA, Levante TO, Meier BH, Ernst RR. Computer Simulations in Magnetic Resonance. An Object-Oriented Programming Approach. Journal of Magnetic Resonance, Series A 1994;106(1):75–105. [Google Scholar]
- 14.Edden RA, Schar M, Hillis AE, Barker PB. Optimized detection of lactate at high fields using inner volume saturation. Magn Reson Med 2006;56(4):912–917. [DOI] [PubMed] [Google Scholar]
- 15.Near J, Evans CJ, Puts NA, Barker PB, Edden RA. J-difference editing of gamma-aminobutyric acid (GABA): simulated and experimental multiplet patterns. Magn Reson Med 2013;70(5):1183–1191. [DOI] [PMC free article] [PubMed] [Google Scholar]
- 16.Provencher SW. Estimation of metabolite concentrations from localized in vivo proton NMR spectra. Magn Reson Med 1993;30(6):672–679. [DOI] [PubMed] [Google Scholar]
- 17.Clarke WT, Stagg CJ, Jbabdi S. FSL-MRS: An end-to-end spectroscopy analysis package. Magn Reson Med 2021;85(6):2950–2964. [DOI] [PMC free article] [PubMed] [Google Scholar]
- 18.Wilson M Adaptive baseline fitting for 1 H MR spectroscopy analysis. Magn Reson Med 2021;85(1):13–29. [DOI] [PubMed] [Google Scholar]
- 19.Oeltzschner G, Zollner HJ, Hui SCN, et al. Osprey: Open-source processing, reconstruction & estimation of magnetic resonance spectroscopy data. J Neurosci Methods 2020;343:108827. [DOI] [PMC free article] [PubMed] [Google Scholar]
- 20.Zhang Y, An L, Shen J. Fast computation of full density matrix of multispin systems for spatially localized in vivo magnetic resonance spectroscopy. Med Phys 2017;44(8):4169–4178. [DOI] [PMC free article] [PubMed] [Google Scholar]
- 21.Mitschang L, Ponstingl H, Grindrod D, Oschkinat H. Geometrical representation of coherence transfer selection by pulsed field gradients in high-resolution nuclear magnetic resonance. The Journal of Chemical Physics 1995;102(8):3089–3098. [Google Scholar]
- 22.Bodenhausen G, Kogler H, Ernst RR. Selection of coherence-transfer pathways in NMR pulse experiments. 1984. J Magn Reson 2011;213(2):276–294. [DOI] [PubMed] [Google Scholar]
- 23.Choi IY, Andronesi OC, Barker P, et al. Spectral editing in (1) H magnetic resonance spectroscopy: Experts’ consensus recommendations. NMR Biomed 2021;34(5):e4411. [DOI] [PMC free article] [PubMed] [Google Scholar]
- 24.Chan KL, Puts NA, Schar M, Barker PB, Edden RA. HERMES: Hadamard encoding and reconstruction of MEGA-edited spectroscopy. Magn Reson Med 2016;76(1):11–19. [DOI] [PMC free article] [PubMed] [Google Scholar]
- 25.Oeltzschner G, Saleh MG, Rimbault D, et al. Advanced Hadamard-encoded editing of seven low-concentration brain metabolites: Principles of HERCULES. Neuroimage 2019;185:181–190. [DOI] [PMC free article] [PubMed] [Google Scholar]
- 26.An L, Li S, Wood ET, Reich DS, Shen J. N-acetyl-aspartyl-glutamate detection in the human brain at 7 Tesla by echo time optimization and improved Wiener filtering. Magn Reson Med 2014;72(4):903–912. [DOI] [PMC free article] [PubMed] [Google Scholar]
- 27.Bottomley PA. Spatial localization in NMR spectroscopy in vivo. Ann N Y Acad Sci 1987;508:333–348. [DOI] [PubMed] [Google Scholar]
- 28.Scheenen TW, Heerschap A, Klomp DW. Towards 1H-MRSI of the human brain at 7T with slice-selective adiabatic refocusing pulses. MAGMA 2008;21(1–2):95–101. [DOI] [PMC free article] [PubMed] [Google Scholar]
- 29.Garwood M, DelaBarre L. The return of the frequency sweep: designing adiabatic pulses for contemporary NMR. J Magn Reson 2001;153(2):155–177. [DOI] [PubMed] [Google Scholar]
- 30.Saleh MG, Rimbault D, Mikkelsen M, et al. Multi-vendor standardized sequence for edited magnetic resonance spectroscopy. Neuroimage 2019;189:425–431. [DOI] [PMC free article] [PubMed] [Google Scholar]
- 31.Mescher M, Merkle H, Kirsch J, Garwood M, Gruetter R. Simultaneous in vivo spectral editing and water suppression. NMR Biomed 1998;11(6):266–272. [DOI] [PubMed] [Google Scholar]
- 32.Bodenhausen G, Freeman R, Morris GA, Turner DL. NMR spectra of some simple spin systems studied by two-dimensional fourier transformation of spin echoes. J Magn Reson 1978;31(1):75–95. [Google Scholar]
- 33.Govindaraju V, Young K, Maudsley AA. Proton NMR chemical shifts and coupling constants for brain metabolites. NMR Biomed 2000;13(3):129–153. [DOI] [PubMed] [Google Scholar]
- 34.Govind V, Young K, Maudsley AA. Corrigendum: proton NMR chemical shifts and coupling constants for brain metabolites. Govindaraju V, Young K, Maudsley AA, NMR Biomed. 2000; 13: 129–153. NMR Biomed 2015;28(7):923–924. [DOI] [PubMed] [Google Scholar]
- 35.Branzoli F, Pontoizeau C, Tchara L, et al. Cystathionine as a marker for 1p/19q codeleted gliomas by in vivo magnetic resonance spectroscopy. Neuro Oncol 2019;21(6):765–774. [DOI] [PMC free article] [PubMed] [Google Scholar]
- 36.de Graaf RA. In Vivo NMR Spectroscopy – Static Aspects. In Vivo NMR Spectroscopy; 2019. p. 43–128. [Google Scholar]
- 37.Deelchand DK, Marjanska M, Henry PG, Terpstra M. MEGA-PRESS of GABA+: Influences of acquisition parameters. NMR Biomed 2021;34(5):e4199. [DOI] [PMC free article] [PubMed] [Google Scholar]
- 38.Murdoch JB, Lent AH, Kritzer MR. Computer-optimized narrowband pulses for multislice imaging. J Magn Reson 1987;74(2):226–263. [Google Scholar]
- 39.Mao J, Mareci TH, Andrew ER. Experimental-Study of Optimal Selective 180-Degrees Radiofrequency Pulses. J Magn Reson 1988;79(1):1–10. [Google Scholar]
- 40.Andronesi OC, Ramadan S, Ratai EM, Jennings D, Mountford CE, Sorensen AG. Spectroscopic imaging with improved gradient modulated constant adiabaticity pulses on high-field clinical scanners. J Magn Reson 2010;203(2):283–293. [DOI] [PMC free article] [PubMed] [Google Scholar]
- 41.Deelchand DK, Berrington A, Noeske R, et al. Across-vendor standardization of semi-LASER for single-voxel MRS at 3T. NMR Biomed 2021;34(5):e4218. [DOI] [PMC free article] [PubMed] [Google Scholar]
- 42.Jalnefjord O, Pettersson P, Lundholm L, Ljungberg M. Simulated basis sets for semi-LASER: the impact of including shaped RF pulses and magnetic field gradients. MAGMA 2021;34(4):545–554. [DOI] [PMC free article] [PubMed] [Google Scholar]
- 43.Ellison DW, Beal MF, Martin JB. Phosphoethanolamine and ethanolamine are decreased in Alzheimer’s disease and Huntington’s disease. Brain Res 1987;417(2):389–392. [DOI] [PubMed] [Google Scholar]