Abstract
Background and Objectives
Brain amyloid deposition, a major risk factor for Alzheimer disease (AD), is currently estimated by measuring CSF or plasma amyloid peptide levels or by PET imaging. Assessing genetic risks relating to amyloid deposition before any accumulation has occurred would allow for earlier intervention in persons at increased risk for developing AD. Previous work linking amyloid burden and genetic risk relied almost exclusively on APOE, a major AD genetic risk factor. Here, we ask whether a polygenic risk score (PRS) that incorporates an optimized list of common variants linked to AD and excludes APOE is associated with brain amyloid load in cognitively unimpaired older adults.
Methods
We included 291 asymptomatic older participants from the INveStIGation of AlzHeimer's PredicTors (INSIGHT pre-AD) cohort who underwent amyloid imaging, including 83 amyloid-positive (+) participants. We used an Alzheimer's (A) PRS composed of 33 AD risk variants excluding APOE and selected the 17 variants that showed the strongest association with amyloid positivity to define an optimized (oA) PRS. Participants from the Alzheimer's Disease Neuroimaging Initiative (ADNI) study (228 participants, 90 amyloid [+]) were tested as a validation cohort. Finally, 2,300 patients with AD and 6,994 controls from the European Alzheimer's Disease Initiative (EADI) were evaluated.
Results
A-PRS was not significantly associated with amyloid burden in the INSIGHT or ADNI cohorts with or without correction for the APOE genotype. However, oA-PRS was significantly associated with amyloid status independently of APOE adjustment (INSIGHT odds ratio [OR]: 5.26 [1.71–16.88]; ADNI OR: 3.38 [1.02–11.63]). Of interest, oA-PRS accurately discriminated amyloid (+) and (−) APOE ε4 carriers (INSIGHT OR: 181.6 [7.53–10,674.6]; ADNI OR: 44.94 [3.03–1,277]). A-PRS and oA-PRS showed a significant association with disease status in the EADI cohort (OR: 1.68 [1.53–1.85] and 2.06 [1.73–2.45], respectively). Genes assigned to oA-PRS variants were enriched in ontologies related to β-amyloid metabolism and deposition.
Discussion
PRSs relying on AD genetic risk factors excluding APOE may improve risk prediction for brain amyloid, allowing stratification of cognitively unimpaired individuals at risk of AD independent of their APOE status.
Alzheimer disease (AD) is the most common cause of dementia and a major public health concern, with >130 million cases worldwide anticipated by 2050. AD is a complex disease with autosomal dominant transmission in rare early-onset familial AD1 and a nonmendelian inheritance pattern in late-onset sporadic AD (sAD) that may explain 60%–80% of the attributable risk.2 The first identified genetic variant associated with AD was the APOE ε4 allele.3 Heterozygous carriers have a 3-fold higher AD risk, whereas homozygous individuals have a 15-fold higher AD risk.4 The AD risk for homozygous individuals is estimated to be 30% at age 75 years and over 50% by age 85 years.5 Since 2009, genome-wide association studies (GWAS) have identified more than 40 loci associated with sAD.4,6
Notably, the risk of developing AD associated with these GWAS variants is low, and therefore, it is of interest to calculate a weighted sum of identified risk variants to establish the cumulative risk of disease or phenotypic trait for a given individual, known as a polygenic risk score (PRS). Such approaches have been used to differentiate AD-related dementia stages7-11 and to predict the age at disease onset12-14 and/or clinical progression.7-11 In some cases, the association was dependent on the APOE genotype.7,12
Few studies focused on the association of a PRS with relevant AD-linked phenotypes in cognitively unimpaired older adults. In participants without dementia, the PRS was associated with cerebral accumulation of β-amyloid (Aβ) measured by PETs. 5 Similarly, a study of middle-aged individuals with a familial history of sAD revealed that specific PRSs that included APOE were associated with PET and CSF amyloid load.16 A recent study based on the Alzheimer's Disease Neuroimaging Initiative (ADNI) cohort separated participants with AD-associated dementia, AD-associated mild cognitive impairment (MCI), and controls into amyloid (+) and amyloid (−) groups based on amyloid PET. Among the groups, a high-content PRS generated from 162,957 single-nucleotide variations (SNVs, formerly SNPs) did not predict amyloid status better than the APOE genotype alone.10 Nevertheless, when using pathway-specific PRSs, lists related to lipid-protein interactions and cholesterol transport were significantly associated with brain amyloid load, even when excluding APOE.10 Finally, a recent study using 39 AD genetic variants found that a high PRS and APOE ε4 separately predicted AD dementia in a retrospective cohort.17
Here, our objective was to test whether we could generate a PRS linked to amyloid status in cognitively unimpaired participants using a list of SNVs previously associated with AD but excluding APOE. A PRS optimized for amyloid status could identify at-risk individuals, encouraging them to seek future targeted prevention efforts.
Methods
Discovery Cohort: INSIGHT Cohort
We used data from the INveStIGation of AlzHeimer's PredicTors in a subjective memory complainer pre-Alzheimer disease (INSIGHT pre-AD) cohort comprising cognitively unimpaired volunteers, aged 70 years and older, who consulted at the Pitié-Salpêtrière University Hospital for memory complaints. All participants included had a Mini-Mental State Examination (MMSE) score of ≥27,18 a Dementia Rating Score of 0, and normal episodic memory performance (assessed with the Free and Cued Selective Reminding Test). Additional available data for this population include age, sex, weight, body mass index, APOE genotype, medical treatments, education, residence location, and extensive neuropsychological and neuroimaging (MRI and FDG-PET) data. Participants underwent an initial 18F-florbetapir PET scan to assess their brain amyloid load and were classified as amyloid (+) or amyloid (−). The global amyloid PET standard uptake value ratio (SUVR) was calculated as described previously.18-20 To compare amyloid burden in several large cohorts using different radiotracers and analysis methods, a standardized scale of amyloid burden quantification was proposed by Klunk.21 This scale goes from 0 to 100, using a new unit called a Centiloid (CL). SUVR values were transformed to CL values using the center for acquisition and image processing (CATI) platform22 by applying a 3-level method accounting for the radiotracer and the pipeline used to process the PET amyloid data.21,23 INSIGHT participants were then divided into amyloid (−) and amyloid (+) groups using a 20-CL threshold, corresponding to an SUVR value of 0.79 and the following conversion equation: CL = (151 × SUVR) − 98.9. A cutoff of 20 CL was previously validated in populations with postmortem findings.24,25 The ethics committee of the Pitié-Salpêtrière University Hospital approved the study protocol. All participants provided written informed consent through a form given and explained to them 2 weeks before enrollment. Neither the participants nor the investigators were aware of any participant's amyloid status.
Validation Cohort: ADNI Cohort
Additional data were obtained from the ADNI database.26 The ADNI was launched in 2003 as a public-private partnership, led by Principal Investigator Michael W. Weiner, MD. The primary goal of the ADNI is to test whether serial MRI, PET, other biological markers, and clinical and neuropsychological assessment can be combined to measure the progression of MCI and early AD.
The ADNI cohort is an independent cohort including controls and participants with MCI or AD.26 We selected control participants from the ADNI cohort who underwent an 18F-florbetapir PET scan, as with the INSIGHT cohort; had an MMSE score of ≥27; and were within the same age range as the INSIGHT cohort. SUVR values from the ADNI were transformed to CL using the following formula: CL = (196.9 × SUVR) − 196.03. We used the same threshold for amyloid positivity as for the INSIGHT cohort (20 CL).
AD Study: European Alzheimer's Disease Initiative
The European Alzheimer's Disease Initiative (EADI) is composed of several case-control studies and 1 population-based cohort, 3C.27 The case-control studies are composed of AD cases and cognitively normal controls across France. The population-based cohort is from a prospective study on the relationship between vascular factors and dementia conducted in the 3 French cities: Bordeaux, Montpellier, and Dijon. AD status was defined based on 12 years of follow-up for Dijon participants, 14–15 years of follow-up for Montpellier participants, and 17–18 years of follow-up for Bordeaux participants. Participants without dementia from the 3C cohort were included as controls. All AD cases in the case-control studies and in 3C were ascertained by neurologists, and the clinical diagnosis of probable AD was established according to the DSM-III-R and NINCDS-ADRDA criteria.28
Genotyping
INSIGHT participants were genotyped using the Illumina NeuroX2 chip, a semicustom microarray based on a HumanCore-24+ v1.0 backbone containing 306,670 variants, with an additional 179,467 custom variants relevant for neurologic diseases. The design of this chip was reported previously.29 Data quality control was performed using GenomeStudio 2.0 software (Illumina) and plink v.1.9 beta.30 Quality control filtering removed 21,644 SNVs with low GenTrain scores (<0.7) and low genotyping rates (<98%), as well as those deviating from the Hardy-Weinberg equilibrium (HWE test p value <10−6). Samples were checked for low call rate (<98%), individual relatedness, and ethnic discrepancies. The inbreeding coefficient was considered excessive when Fhat2 <−0.8. Sex discrepancies were checked and data updated where possible. Following these criteria, 10 participants were removed from further analyses. Imputation was performed using the Sanger Imputation Service on the Haplotype Reference Consortium dataset (release 1.1).31 Low-imputation-quality variants were filtered using a threshold of r2 < 0.3.
The ADNI cohort was genotyped using different Illumina microarrays; therefore, quality control and imputation were conducted separately using the same procedures. Variants were filtered for GenTrain score <0.7, clusterSeparation score ≤0.3, low call rate (<99%), rare variants (minor allele frequency <5%), and deviation from the HWE with p < 10−6. Samples were filtered for missingness (>2%), relatedness, sex discrepancy, and excess heterozygosity. Imputation was performed using the Sanger Imputation Service on the Haplotype Reference Consortium dataset. Low-imputation-quality variants were filtered at a threshold of r2 < 0.3.
The EADI study cohort was genotyped using the Illumina Human 610 Quad BeadChip at the Centre National de Recherche en Génomique Humaine (CNRGH, Evry, France). The genotyping chip was assessed using probe alignment and a remapping and normalization step according to the GRCh37 and GRCh38 assemblies. Sample quality control was performed as previously detailed.32 Relatedness and variant quality control were recomputed as previously described.33 Briefly, variants with a minor allele frequency of <0.01, missingness >0.05, a p value from the HWE test performed in controls <5e−8, or a p value of the Fisher exact test on cases/controls missing calls <1e−10 were excluded. The remaining variants were then assessed by comparing their frequencies against 2 reference panels (i.e., the Haplotype Reference Consortium r1.1 [HRC]31 excluding 1000 Genomes samples and the Genome Aggregation Database v3 [gnomAD] non-Finnish European samples34). Allele counts were then compared with the EADI counts by performing a χ2 test; variants showing a χ2 of >1,500 in both the HRC and gnomAD, or a χ2 of >1,500 in one reference panel and not present in the other, were excluded. All samples and variants passing quality control were then imputed with the Trans-Omics for Precision Medicine (TOPMed) Freeze 5 reference panel35 on the Michigan Imputation Server.36 Low-imputation-quality variants were filtered at a threshold of r2 < 0.3.
PRS Calculation and Statistical Analysis
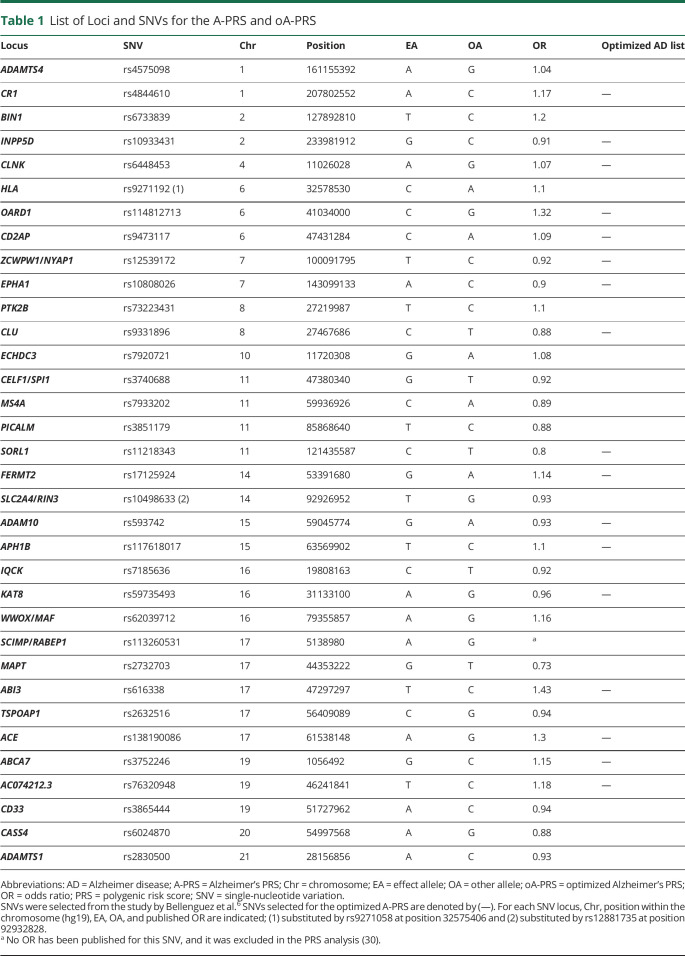
To calculate the Alzheimer's PRS (A-PRS), we used a list of previously described SNVs.6 that were confirmed to be linked to AD. SNVs were included only if their allelic frequency was higher than 1% in the population (including TREM2 rs75932628, PLCG2 rs72824905, HESX1/IL17RD/APPL1 rs184384746, CNTAP2 rs114360492, and TM2D3 rs139709573). All included SNVs are considered to be sentinel SNVs and were used in the calculation of the A-PRS. Exceptions were rs9271058 and rs12881735, which did not pass quality control in our cohort and were substituted by the closest available SNVs after confirming the linkage disequilibrium between them, and rs113260531, for which no odds ratio (OR) has been published37 (Table 1).
Table 1.
List of Loci and SNVs for the A-PRS and oA-PRS
All statistics and PRS calculations were performed on R 4.0.2.38 Polygenic risk scores were calculated as described previously,39 using a weighted method with the following formula:  . Dose varied between 0 and 2, with 0 corresponding to no risk allele, 1 to 1 risk allele, and 2 to 2 risk alleles. For imputed alleles, the dose was a continuous value between 0 and 2.
χ2 and Kruskal-Wallis analyses were performed to determine differences in population demographics. All correlations were obtained using the Spearman correlation method. APOE status was defined according to the ε4 carrier status of the participant, and only participants with ε3/ε4 and ε4/ε4 genotypes were included in the E4 carriers, whereas all remaining participants were included among the E4 noncarriers. To calculate the association of the PRS and/or APOE group with amyloid status, models were fitted for a binomial response adjusted for age, sex, and the first 3 principal components of each population to account for the internal structure of the INSIGHT cohort and 10 principal components to account for the internal structure of the ADNI. Only the first 3 principal components were included for INSIGHT because it is a homogeneous population, whereas the ADNI cohort is multiethnic. Principal components were calculated using the pca function of PLINK (v1.90b3w) and plotted against the 1000G dataset. Non-European outliers were identified and removed from the INSIGHT cohort. These models were subsequently used to obtain the beta value of the PRS using the R reghelper package. We present uncorrected p values.
PRS Optimization
The optimized Alzheimer's PRS (oA-PRS) was obtained using the INSIGHT discovery cohort and validated in the ADNI validation cohort. We generated n − 1 lists of SNVs excluding the APOE SNVs, taking out a single SNV every time. The PRS for each of these lists was calculated, and models were fitted as described above. Results from each list were compared, and the list with higher beta and lower p values compared with the original list was kept. This process was repeated k times (here 16 times), with the best list replacing the original list until neither the beta nor the p values could be improved by deleting a single SNV.
Gene Ontology Category Enrichment
SNVs from the A-PRS and oA-PRS lists were analyzed for Gene Ontology (GO) biological process enrichment. If a SNV was located between 2 genes (i.e., ZCPW1/NYAP1), both genes were included in the analysis. GO enrichment analysis was performed using the Enrichr site.40,41 Only processes that reached an adjusted p value of 0.05 were considered significant.
Results
Demographic Description of the INSIGHT Discovery Cohort
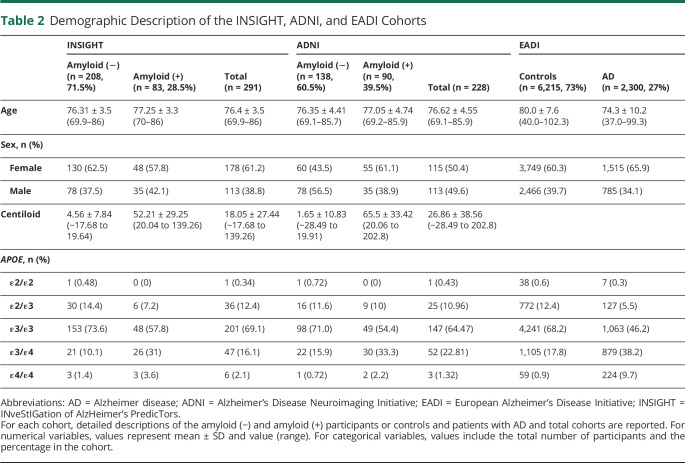
Genomic data were obtained from 298 of the original 318 participants included in the INSIGHT pre-AD study. We removed participants with the APOE ε2/ε4 genotype based on the observation that those 2 alleles show differential effects on amyloid deposition.42 Genomic data were available from 291 participants. Most participants (208, 71.5%) had amyloid CL values lower than 20 and were therefore classified as amyloid (−). Our population was 61.2% female, and this proportion was similar in amyloid (−) and (+) groups. As expected, participants in the amyloid (+) group were more likely to be APOE ε4 carriers (p = 0.001) and less likely to be APOE ε2 carriers (p = 0.002) (Table 2). In addition, as previously described,25 the distribution of CL values did not follow a normal distribution, and there was a weak correlation of these values with age (p = 0.036). However, despite this weak correlation, all subsequent models included age as a confounding factor.
Table 2.
Demographic Description of the INSIGHT, ADNI, and EADI Cohorts
Discovery Cohort: PRS Association With Amyloid Status
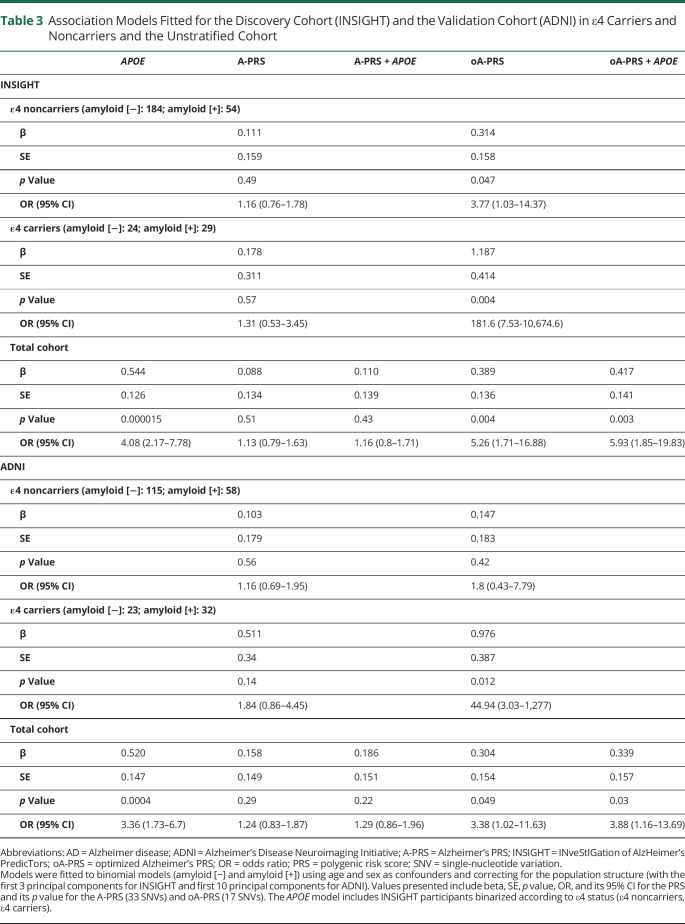
We used a list of 33 SNVs associated with AD risk6 (excluding APOE) to generate a first PRS, named A-PRS (Table 1), adjusted for age, sex, and population structure (PC1, PC2, and PC3). We did not observe any association between the A-PRS and amyloid status (Figure 1A and Table 3). This lack of association was also observed in an APOE-stratified analysis (Figure 1B and Table 3; no interaction between APOE status and A-PRS was detected). Therefore, in the discovery cohort, the A-PRS was not associated with amyloid deposition in cognitively unimpaired participants. As expected, because of APOE genotype distribution, a model including only APOE status showed an association with amyloid status (Table 3) (OR = 4.08 [2.17–7.78]).
Figure 1. PRS in Amyloid (+) and Amyloid (−) Participants From the INSIGHT Cohort: A-PRS (A and B) and oA-PRS (C and D).
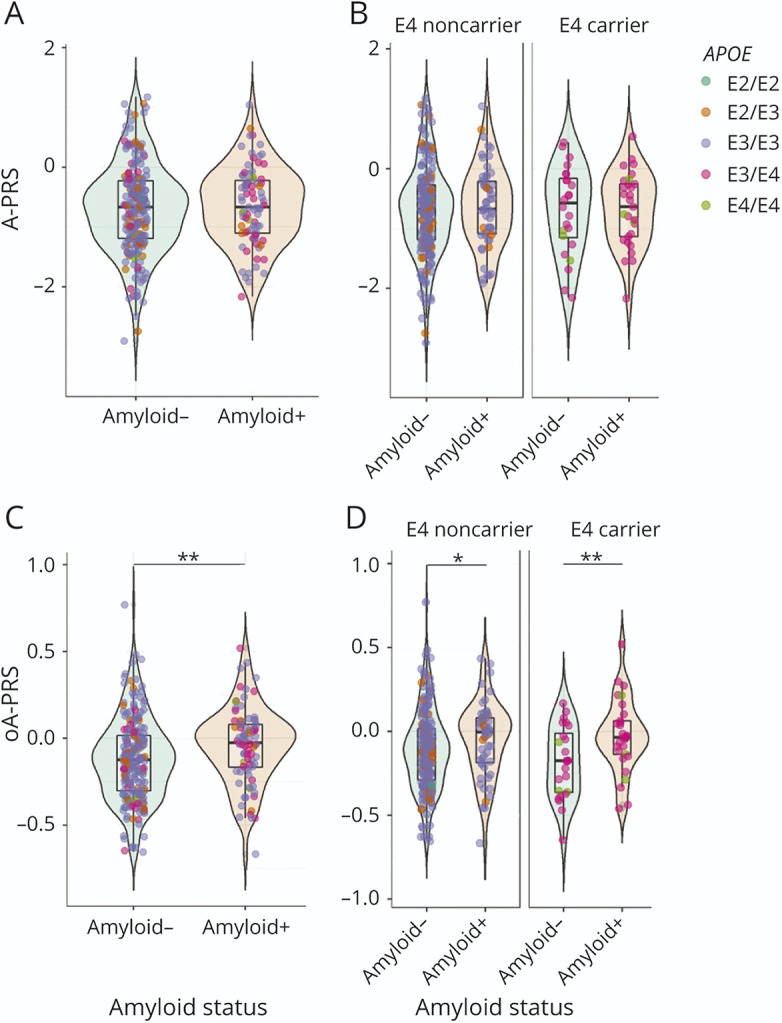
Green-colored violin plots correspond to amyloid (−) participants, and orange-colored plots correspond to amyloid (+) participants. Each participant is represented by a colored dot corresponding to their APOE status: dark green for ε2/ε2, orange for ε2/ε3, violet for ε3/ε3, pink for ε3/ε4, and light green for ε4/ε4. For the stratified graphs, participants who did not carry any ε4 allele were classified as an “E4 noncarrier,” and those who did were classified as an “E4 carrier.” The A-PRS is not associated with amyloid status in the whole INSIGHT cohort (A) and in the ε4 carriers (B). The oA-PRS is significantly associated with amyloid status (C) (p = 0.005), and this association persists in the ε4 carriers (p = 0.0034) (D); asterisks indicate statistically significant differences (*p < 0.05, **p < 0.001). The A-PRS and oA-PRS were not significantly different between APOE statuses among amyloid (+) and (−) participants. A-PRS = Alzheimer's PRS; oA-PRS = optimized Alzheimer's PRS; PRS = polygenic risk score.
Table 3.
Association Models Fitted for the Discovery Cohort (INSIGHT) and the Validation Cohort (ADNI) in ε4 Carriers and Noncarriers and the Unstratified Cohort
We then hypothesized that this lack of association may occur because loci associated with AD risk are not linked to amyloid deposition processes. We used an iteration process to select a combination of SNVs leading to a PRS associated with amyloid status. At the end of this process, we obtained an optimized A-PRS (oA-PRS) based on 17 of the original 33 SNVs excluding APOE that showed the strongest association with brain amyloid load in the INSIGHT cohort (denoted by — in Table 1). This association was improved when the model was adjusted for APOE status (Figure 1C and Table 3) (OR without APOE = 5.26 [1.71–16.88], OR with APOE = 5.93 [1.85–19.83]). The APOE-stratified analysis showed a significant association of the oA-PRS with amyloid status both in ε4 carriers and noncarriers (Figure 1D and Table 3, p = 0.12 for interaction between oA-PRS and APOE status). A significant correlation between CL values and oA-PRS was observed in the total population (total group: ρ = 0.13, p = 0.03; amyloid [−]: ρ = −0.048, p = 0.49; amyloid [+]: ρ = 0.17, p = 0.13), which could be caused by the lower CL values in the amyloid (−) population. The large variations observed in the OR among APOE ε4 carriers could be attributed to the small sample size (29 and 32 amyloid [+] and 24 and 23 amyloid [−] APOE ε4 carriers in INSIGHT and ADNI, respectively) compared with the whole population (83 and 90 amyloid [+] and 208 and 138 amyloid [−] from INSIGHT and ADNI, respectively).
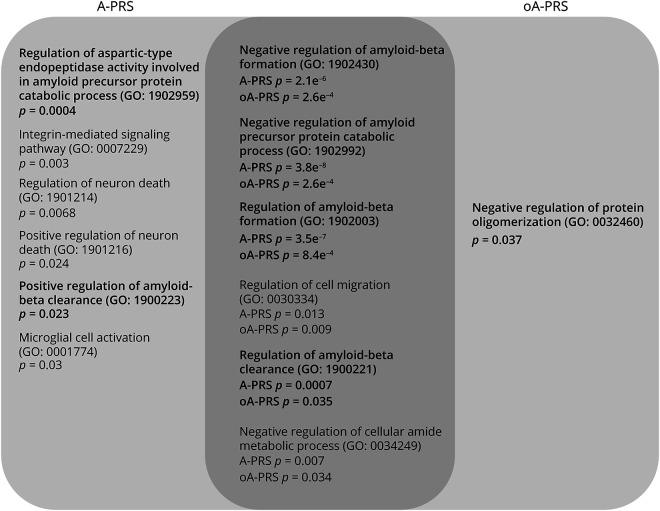
To assess differences between A-PRS and oA-PRS, we performed pathway-enrichment analysis (eTable 1, links.lww.com/WNL/C25, for A-PRS, and eTable 2, links.lww.com/WNL/C26, for oA-PRS). Biological processes related to Aβ metabolism and oligomerization represented 6 of the 12 (50%) and 5 of the 7 (71%) significantly enriched pathways when the analysis was performed based on genes assigned to SNVs used in the A-PRS or oA-PRS, respectively (Figure 2).
Figure 2. Overlap Between Enriched GO Biological Processes in the A-PRS and oA-PRS.
In bold are GO biological processes involved in amyloid pathology. A-PRS = Alzheimer's PRS; GO = Gene Ontology; oA-PRS = optimized Alzheimer's PRS; PRS = polygenic risk score.
Demographic Description of the ADNI Validation Cohort
We selected 230 control participants from the ADNI cohort43 to validate the oA-PRS. Two participants with the APOE ε2/ε4 genotype were excluded. This ADNI validation cohort had a mean age of 76.6 years and a mean MMSE score of 29.3, similar to the INSIGHT cohort.18 Sex distribution was significantly different between cohorts (p = 0.002). Finally, 90 (39.5%) participants from the ADNI cohort were classified as amyloid (+), which was significantly higher than in the INSIGHT cohort (p = 0.0002). In addition, amyloid (−) participants in the validation cohort had lower CL values than amyloid (−) participants in the discovery cohort (p = 0.03), whereas the opposite was observed for amyloid (+) participants (p = 0.0042). As observed in the discovery cohort, the proportion of ε4 carriers was higher in the amyloid (+) group (p = 0.004) (Table 2). Likewise, the CL values followed a non-normal distribution, and no significant correlation was found between age and CL status. However, age was still included in the models to make them comparable with the INSIGHT analyses.
Validation Cohort: PRS Association With Amyloid Status
The 2 PRSs developed in the discovery cohort were tested in the validation cohort. The A-PRS was not significantly associated with amyloid status in the validation cohort even after stratifying by APOE genotype (Figure 3A and Table 3). As expected, APOE was also strongly associated with amyloid status (OR = 3.36 [1.73–6.7]).
Figure 3. PRS in Amyloid (+) and Amyloid (−) Participants From the ADNI Cohort: A-PRS (A and B) and oA-PRS (C and D).
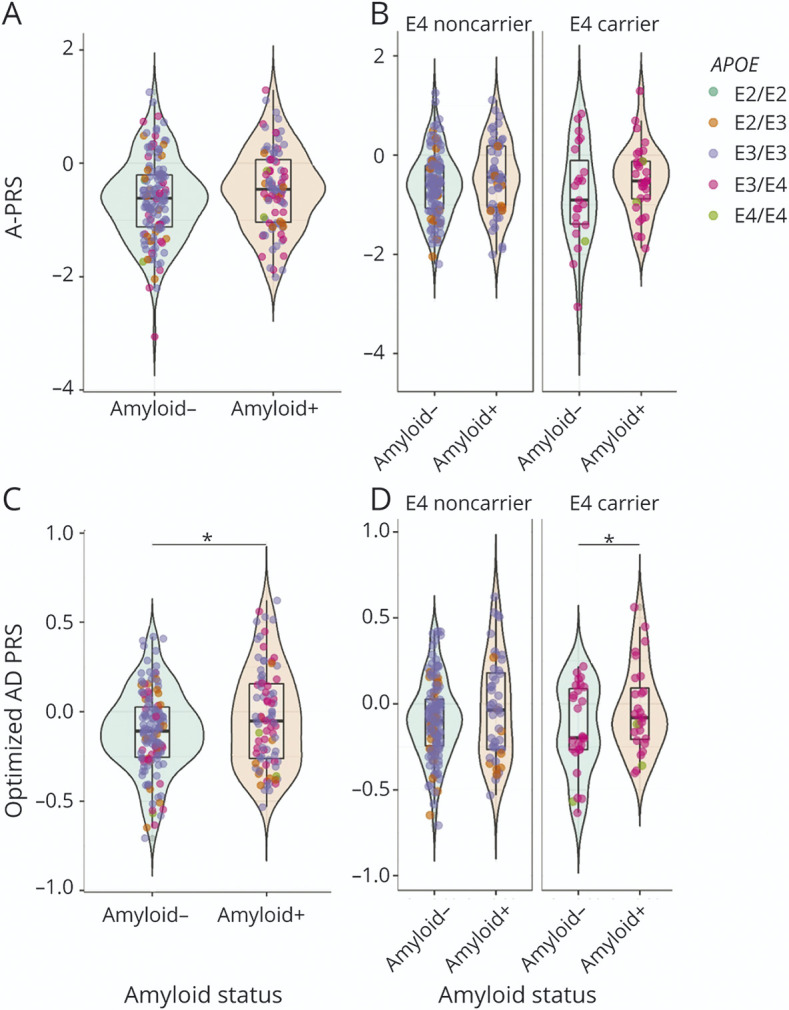
Green-colored violin plots correspond to amyloid (−) participants, whereas orange-colored plots correspond to amyloid (+) participants. Each participant is represented by a colored dot corresponding to their APOE status: dark green for ε2/ε2, orange for ε2/ε3, violet for ε3/ε3, pink for ε3/ε4, and light green for ε4/ε4. For the stratified graphs, participants who did not carry any ε4 allele were classified as “E4 noncarrier,” and those who did were classified as “E4 carrier.” The A-PRS was not significantly associated with amyloid status in the whole ADNI cohort (A) (p = 0.05) or in the APOE-stratified groups (B). The oA-PRS is significantly associated with amyloid status in the whole cohort (C) (p = 0.049) and in the ε4 carriers (D) (p = 0.012); asterisks indicate statistically significant differences (*p < 0.05). The A-PRS and oA-PRS were not significantly different between APOE statuses among amyloid (+) and (−) participants. A-PRS = Alzheimer's PRS; oA-PRS = optimized Alzheimer's PRS; PRS = polygenic risk score.
However, the oA-PRS was significantly associated with amyloid status in the validation cohort (Table 3 and Figure 3C), independent of the addition of APOE status in the model. This association remained significant in the APOE ε4 carriers, as observed in the INSIGHT discovery cohort (Table 3 and Figure 3D). In this case, however, there was no significant correlation between oA-PRS and CL values (total group: ρ = 0.046, p = 0.49; amyloid [−]: ρ = −0.075, p = 0.36; amyloid [+]: ρ = −0.0017, p = 0.99).
Demographic Description of the EADI Cohorts
Finally, we tested the power of the oA-PRS to discriminate between controls and patients with AD in the EADI study. After excluding participants for whom data for age or APOE genotype were not available and participants who were APOE ε2/ε4, we had a total of 8,515 participants (Table 2). As expected, the AD group had a higher percentage of APOE ε4 carriers than the control group (47.9% vs 18.7%, respectively).
EADI Cohorts: PRS Association With Disease Status
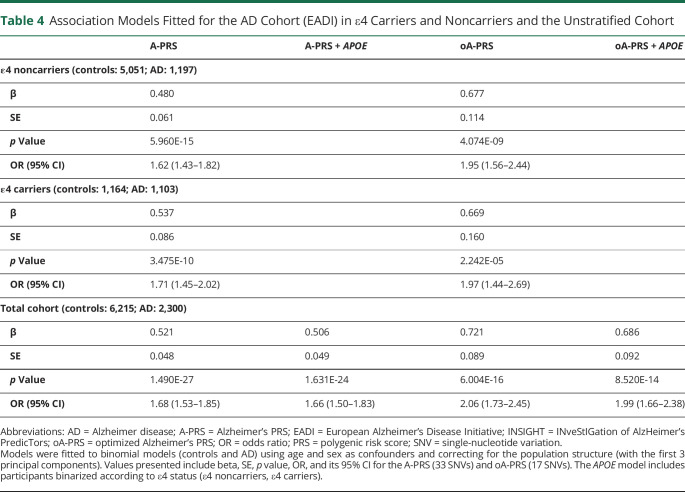
Two variants from the A-PRS were not present in the TOPMed imputations (IQCK rs7185636 and MAPT rs2732703) and were thus replaced by proxy variants based on the linkage disequilibrium in the Haplotype Reference Consortium (rs11865116 and rs2532332, respectively). For the calculation of the A-PRS and the oA-PRS, the weights used were based on the respective log(OR) from the stage II analyses of the European Alzheimer & Dementia Biobank consortium meta-analysis33 when available or otherwise from the stage I analyses (i.e., AC074212.3 rs76320948, ACE rs138190086, IQCK rs11865116, CD33 rs3865444, and WWOX/MAF rs62039712). PRS association analyses were adjusted for sex, age, and the first 3 principal components. We found that the A-PRS was associated with disease status (controls or AD) in the EADI cohort whether (OR: 1.68 [1.53–1.85]) or not (OR: 1.66 [1.50–1.83]) we accounted for APOE status. Stratified analysis according to the APOE ε4 genotype showed significant associations independent of the APOE group (Table 4). The oA-PRS was also significantly associated with disease status with slightly higher ORs (oA-PRS OR: 2.06 [1.73–2.45], oA-PRS + APOE OR: 1.99 [1.66–2.38]).
Table 4.
Association Models Fitted for the AD Cohort (EADI) in ε4 Carriers and Noncarriers and the Unstratified Cohort
Discussion
This study identified an optimized PRS associated with amyloid status based on a shortlist of validated AD-risk–associated SNVs (excluding APOE) in 2 independent cohorts of participants without cognitive impairment. Stratified analyses showed that the association prevailed in APOE ε4 carriers. This observation indicates that AD-associated genetic risk factors other than APOE ε4 may increase the risk of amyloid deposition in APOE ε4 carriers who are already at high risk for AD. Of interest, most of the significant enriched pathways (71.3%) corresponding to the genes assigned to the selected SNVs are linked to APP metabolism and brain amyloid deposition. Finally, we showed that the oA-PRS restricted to 17 SNVs was also associated with disease status, suggesting its improved utility compared with PRS based on a higher number of SNVs.
Few studies have assessed the association of PRSs with amyloid deposition in AD. Among these studies, only 1 described a PRS association independent of APOE status.15 However, this study included individuals with dementia. Two other studies identified APOE-dependent associations of PRS,9,16 but only 1 included cognitively unimpaired participants (with a family history of AD).16 This heterogeneity in terms of population studied and PRS design makes comparison between studies difficult. A recent retrospective study of a cohort of cognitively unimpaired individuals found that a PRS comprising 39 AD SNVs was associated with an increased likelihood of amyloid positivity in the CSF independent of APOE status.17 In addition, this PRS could predict progression to AD dementia.17 This PRS shares 22 loci (16 SNVs) with the A-PRS and 12 loci (8 SNVs) with the oA-PRS. Our study and the recent ones demonstrate that genetic factors beyond APOE can affect not only amyloid pathology but also the risk of developing AD.
Although APOE ε4 carriers have an established higher risk for amyloid deposition and AD, it is of interest to identify risk modifiers, such as the oA-PRS. The oA-PRS is not exclusive for APOE ε4 carriers, but we found a higher association with amyloid load in APOE ε4 carriers. On the other hand, the oA-PRS did not correlate with the numerical florbetapir CL values in amyloid-positive individuals and APOE ε4 carriers in the discovery or validation cohorts, and it was thus unable to predict the level of brain amyloid in this subgroup. Additional studies are needed to test this prediction in larger sample sizes. Of note, the oA-PRS was correlated with CL values in the total population.
Owing to the small number of participants (9) in the INSIGHT cohort who converted to dementia, we could not evaluate the predictive power of the oA-PRS for AD. Therefore, we used the EADI cohort, which includes both AD and control participants, to evaluate the association of the oA-PRS with disease status. Data on brain amyloid deposition were not available. We found that both PRSs (A-PRS and oA-PRS) were associated with disease status in this population. The association of the A-PRS with disease status in the EADI cohort, but not with amyloid deposition in the ADNI and INSIGHT cohorts, suggests that genetic factors in the A-PRS are linked to disease but not to amyloid deposition in asymptomatic older participants. These factors could be potentially linked to the risk of dementia. Nevertheless, the association of the oA-PRS with AD suggests that genetic risk factors for brain amyloid deposition could predict disease outcome.
Both the A-PRS and oA-PRS lists were enriched in processes linked to amyloid deposition. However, the A-PRS included pathways that were not directly involved in amyloid deposition, confirming that there are mechanisms linked to AD that may not be associated with amyloid status. Likely, these pathways contribute to later stages of the disease or to processes that occur independently of amyloid deposition in cognitively unimpaired participants. These could include pathways related to neuroinflammation, tau, insulin resistance, oxidative stress, or others.
Our study is limited by the sample size of the existing cohorts. Although we acknowledge the value of multiple comparison corrections, here we present the results without correction because the results with correction would not be significant. Nevertheless, we were able to validate the oA-PRS in 2 independent cohorts with slightly different genetic backgrounds: the INSIGHT cohort composed of White individuals mostly living in Île-de-France, and the ADNI cohort, which is a multiethnic cohort mostly composed of White non-Hispanic Americans. Risk conferred by the ε4 variant of APOE has been shown to differ across populations, with lower values in populations of African ancestry than in populations of European or Asian ancestries.44 Additional studies are necessary to validate the oA-PRS in non-White populations. Another limitation of our study is the age range because we evaluated people older than 70 years who are cognitively unimpaired. In the future, it will be interesting to include younger participants. This exploratory study will need to be validated in larger cohorts of cognitively unimpaired individuals with brain amyloid imaging.
In conclusion, our findings robustly highlight a PRS excluding APOE that is significantly associated with amyloid status in 2 independent cohorts of cognitively unimpaired individuals. Currently, amyloid load can be measured through plasma or CSF amyloid biomarkers and PET imaging. Genetic risk assessment of amyloid load early in life before any possible detection in plasma or the brain would allow initial screening to establish patient priority for a more detailed follow-up of those at higher risk. In addition, such assessment would provide stratification for potential preventive or curative treatments based on patient-specific risk factors. A GWAS focusing on cognitively unimpaired participants with significant brain amyloid deposition should unveil new SNVs, some of which could be unrelated to AD, while improving prediction of amyloid load. Beyond genetic data, a combination of omics, genetic, biochemical, and environmental (exposome, diet, and microbiome) features could also allow for a more accurate prediction of amyloid deposition.
Acknowledgment
The authors thank the Plateforme Post-génomique de la Pitié Salpétrière – P3S (p3s.sorbonne-universite.fr/) and the Data Analysis Core (dac.institutducerveau-icm.org/). Data collection and sharing for this project was funded by the Alzheimer's Disease Neuroimaging Initiative (ADNI) (NIH Grant U01 AG024904) and DOD ADNI (Department of Defense award number W81XWH-12-2-0012). The ADNI is funded by the National Institute on Aging, the National Institute of Biomedical Imaging and Bioengineering, and through generous contributions from the following: AbbVie; Alzheimer's Association; Alzheimer's Drug Discovery Foundation; Araclon Biotech; BioClinica, Inc.; Biogen; Bristol-Myers Squibb Company; CereSpir, Inc.; Cogstate; Eisai Inc.; Elan Pharmaceuticals, Inc.; Eli Lilly and Company; EuroImmun; F. Hoffmann-La Roche Ltd and its affiliated company Genentech, Inc.; Fujirebio; GE Healthcare; IXICO Ltd.; Janssen Alzheimer Immunotherapy Research & Development, LLC.; Johnson & Johnson Pharmaceutical Research and Development LLC.; Lumosity; Lundbeck; Merck & Co., Inc.; Meso Scale Diagnostics, LLC.; NeuroRx Research; Neurotrack Technologies; Novartis Pharmaceuticals Corporation; Pfizer Inc.; Piramal Imaging; Servier; Takeda Pharmaceutical Company; and Transition Therapeutics. The Canadian Institutes of Health Research is providing funds to support ADNI clinical sites in Canada. Private sector contributions are facilitated by the Foundation for the NIH (fnih.org). The grantee organization is the Northern California Institute for Research and Education, and the study is coordinated by the Alzheimer's Therapeutic Research Institute at the University of Southern California. ADNI data are disseminated by the Laboratory of Neuro Imaging at the University of Southern California.
Glossary
- Aβ
β-amyloid
- AD
Alzheimer disease
- ADNI
Alzheimer's Disease Neuroimaging Initiative
- A-PRS
Alzheimer's polygenic risk score
- CL
Centiloid
- EADI
European Alzheimer's Disease Initiative
- gnomAD
Genome Aggregation Database
- GO
Gene Ontology
- GWAS
genome-wide association study
- HRC
Haplotype Reference Consortium
- HWE
Hardy-Weinberg equilibrium
- INSIGHT
INveStIGation of AlzHeimer's PredicTors
- MCI
mild cognitive impairment
- MMSE
Mini-Mental State Examination
- oA-PRS
optimized Alzheimer's polygenic risk score
- OR
odds ratio
- PRS
polygenic risk score
- sAD
sporadic AD
- SNV
single-nucleotide variation
- SUVR
standard uptake value ratio
- TOPMed
Trans-Omics for Precision Medicine
Appendix 1. Authors

Appendix 2. Coinvestigators

Study Funding
This research was funded by the French government under management of Agence Nationale de la Recherche as part of the “Investissements d'avenir” program (ANR-10-AIHU-06), ANR-19-P3IA-0001 (PRAIRIE 3IA Institute), the INSERM, Institut Pasteur de Lille, the Lille Métropole Communauté Urbaine, and the French government's LABEX DISTALZ program (development of innovative strategies for a transdisciplinary approach to Alzheimer disease). L. Xicota was supported by a fellowship from Institut de Recherche Servier.
Disclosure
L. Xicota received a fellowship from Fondation Recherche Servier. N. Villain reports grants from Fondation Recherche Alzheimer and Département Médical Universitaire APHP Sorbonne Université as well as nonfinancial support from GE HEALTHCARE SAS, MERZ PHARMA France, UCB Pharma SA, MEDTRONIC France S.A.S, and Laboratoire AGUETTANT outside the submitted work. B. Dubois received consulting fees from Biogen and funding for his institution from Roche, Fondation Merck-Avenir, and Fondation pour la Recherche sur Alzheimer (FRA). M.-C. Potier reports grants from Agence Nationale de la Recherche and Fondation Merck Avenir during the conduct of the study as well as grants from Fondation Recherche Servier and F. Hoffmann-La Roche outside the submitted work. The remaining authors report no disclosures relevant to the manuscript. Go to Neurology.org/N for full disclosures.
References
- 1.Bekris LM, Yu CE, Bird TD, Tsuang DW. Genetics of Alzheimer disease. J Geriatr Psychiatry Neurol. 2010;23(4):213-227. doi: 10.1177/0891988710383571. [DOI] [PMC free article] [PubMed] [Google Scholar]
- 2.Gatz M, Reynolds CA, Fratiglioni L, et al. Role of genes and environments for explaining Alzheimer disease. Arch Gen Psychiatry. 2006;63(2):168-174. doi: 10.1001/archpsyc.63.2.168. [DOI] [PubMed] [Google Scholar]
- 3.Strittmatter WJ, Saunders AM, Schmechel D, et al. Apolipoprotein E: high-avidity binding to beta-amyloid and increased frequency of type 4 allele in late-onset familial Alzheimer disease. Proc Natl Acad Sci USA. 1993;90(5):1977-1981. doi: 10.1073/pnas.90.5.1977. [DOI] [PMC free article] [PubMed] [Google Scholar]
- 4.Sims R, Hill M, Williams J. The multiplex model of the genetics of Alzheimer's disease. Nat Neurosci. 2020;23(3):311-322. doi: 10.1038/s41593-020-0599-5. [DOI] [PubMed] [Google Scholar]
- 5.Genin E, Hannequin D, Wallon D, et al. APOE and Alzheimer disease: a major gene with semi-dominant inheritance. Mol Psychiatry. 2011;16(9):903-907. doi: 10.1038/mp.2011.52. [DOI] [PMC free article] [PubMed] [Google Scholar]
- 6.Bellenguez C, Grenier-Boley B, Lambert JC. Genetics of Alzheimer's disease: where we are, and where we are going. Curr Opin Neurobiol. 2020;61:40-48. doi: 10.1016/j.conb.2019.11.024. [DOI] [PubMed] [Google Scholar]
- 7.Adams HH, de Bruijn RF, Hofman A, et al. Genetic risk of neurodegenerative diseases is associated with mild cognitive impairment and conversion to dementia. Alzheimers Dement. 2015;11(11):1277-1285. doi: 10.1016/j.jalz.2014.12.008. [DOI] [PubMed] [Google Scholar]
- 8.Altmann A, Scelsi MA, Shoai M, et al. A comprehensive analysis of methods for assessing polygenic burden on Alzheimer's disease pathology and risk beyond APOE. Brain Commun. 2020;2(1):fcz047. doi: 10.1093/braincomms/fcz047. [DOI] [PMC free article] [PubMed] [Google Scholar]
- 9.Chaudhury S, Brookes KJ, Patel T, et al. Alzheimer's disease polygenic risk score as a predictor of conversion from mild-cognitive impairment. Transl Psychiatry. 2019;9(1):154. doi: 10.1038/s41398-019-0485-7. [DOI] [PMC free article] [PubMed] [Google Scholar]
- 10.Leonenko G, Shoai M, Bellou E, et al. Genetic risk for Alzheimer disease is distinct from genetic risk for amyloid deposition. Ann Neurol. 2019;86(3):427-435. doi: 10.1002/ana.25530. [DOI] [PMC free article] [PubMed] [Google Scholar]
- 11.Rodriguez-Rodriguez E, Sanchez-Juan P, Vazquez-Higuera JL, et al. Genetic risk score predicting accelerated progression from mild cognitive impairment to Alzheimer's disease. J Neural Transm (Vienna). 2013;120(5):807-812. doi: 10.1007/s00702-012-0920-x. [DOI] [PubMed] [Google Scholar]
- 12.Cruchaga C, Del-Aguila JL, Saef B, et al. Polygenic risk score of sporadic late-onset Alzheimer's disease reveals a shared architecture with the familial and early-onset forms. Alzheimers Dement. 2018;14(2):205-214. doi: 10.1016/j.jalz.2017.08.013. [DOI] [PMC free article] [PubMed] [Google Scholar]
- 13.Desikan RS, Fan CC, Wang Y, et al. Genetic assessment of age-associated Alzheimer disease risk: development and validation of a polygenic hazard score. PLoS Med. 2017;14(3):e1002258. doi: 10.1371/journal.pmed.1002258. [DOI] [PMC free article] [PubMed] [Google Scholar]
- 14.Sleegers K, Bettens K, De Roeck A, et al. A 22-single nucleotide polymorphism Alzheimer's disease risk score correlates with family history, onset age, and cerebrospinal fluid Abeta42. Alzheimers Dement. 2015;11(12):1452-1460. doi: 10.1016/j.jalz.2015.02.013. [DOI] [PubMed] [Google Scholar]
- 15.Mormino EC, Sperling RA, Holmes AJ, et al. Polygenic risk of Alzheimer disease is associated with early- and late-life processes. Neurology. 2016;87(5):481-488. doi: 10.1212/WNL.0000000000002922. [DOI] [PMC free article] [PubMed] [Google Scholar]
- 16.Darst BF, Koscik RL, Racine AM, et al. Pathway-specific polygenic risk scores as predictors of amyloid-beta deposition and cognitive function in a sample at increased risk for Alzheimer's disease. J Alzheimers Dis. 2017;55(2):473-484. doi: 10.3233/JAD-160195. [DOI] [PMC free article] [PubMed] [Google Scholar]
- 17.Ebenau JL, van der Lee SJ, Hulsman M, et al. Risk of dementia in APOE ε4 carriers is mitigated by a polygenic risk score. Alzheimers Demen. 2021;13(1):e12229. doi: 10.1002/dad2.12229. [DOI] [PMC free article] [PubMed] [Google Scholar]
- 18.Dubois B, Epelbaum S, Nyasse F, et al. Cognitive and neuroimaging features and brain beta-amyloidosis in individuals at risk of Alzheimer's disease (INSIGHT-preAD): a longitudinal observational study. Lancet Neurol. 2018;17(4):335-346. doi: 10.1016/S1474-4422(18)30029-2. [DOI] [PubMed] [Google Scholar]
- 19.Habert MO, Bertin H, Labit M, et al. Evaluation of amyloid status in a cohort of elderly individuals with memory complaints: validation of the method of quantification and determination of positivity thresholds. Ann Nucl Med. 2018;32(2):75-86. doi: 10.1007/s12149-017-1221-0. [DOI] [PubMed] [Google Scholar]
- 20.Xicota L, Ichou F, Lejeune FX, et al. Multi-omics signature of brain amyloid deposition in asymptomatic individuals at-risk for Alzheimer's disease: the INSIGHT-preAD study. EBioMedicine. 2019;47:518-528. doi: 10.1016/j.ebiom.2019.08.051. [DOI] [PMC free article] [PubMed] [Google Scholar]
- 21.Klunk WE, Koeppe RA, Price JC, et al. The Centiloid Project: standardizing quantitative amyloid plaque estimation by PET. Alzheimers Dement. 2015;11(1):1-15.e1-4. doi: 10.1016/j.jalz.2014.07.003. [DOI] [PMC free article] [PubMed] [Google Scholar]
- 22.CATI platform. 2013. cati-neuroimaging.com
- 23.Navitsky M, Joshi AD, Kennedy I, et al. Standardization of amyloid quantitation with florbetapir standardized uptake value ratios to the Centiloid scale. Alzheimers Dement. 2018;14(12):1565-1571. doi: 10.1016/j.jalz.2018.06.1353. [DOI] [PubMed] [Google Scholar]
- 24.Amadoru S, Doré V, McLean CA, et al. Comparison of amyloid PET measured in Centiloid units with neuropathological findings in Alzheimer's disease. Alzheimers Res Ther. 2020;12(1):22. doi: 10.1186/s13195-020-00587-5. [DOI] [PMC free article] [PubMed] [Google Scholar]
- 25.La Joie R, Ayakta N, Seeley WW, et al. Multisite study of the relationships between antemortem [(11)C]PIB-PET Centiloid values and postmortem measures of Alzheimer's disease neuropathology. Alzheimers Dement. 2019;15(2):205-216. doi: 10.1016/j.jalz.2018.09.001. [DOI] [PMC free article] [PubMed] [Google Scholar]
- 26.Genome Aggregation Database. ADNI genetic data. Accessed January 2020. adni.loni.usc.edu/data-samples/data-types/genetic-data/
- 27.Vascular factors and risk of dementia: design of the Three-City Study and baseline characteristics of the study population. Neuroepidemiology. 2003;22(6):316-325. doi: 10.1159/000072920. [DOI] [PubMed] [Google Scholar]
- 28.Lambert JC, Heath S, Even G, et al. Genome-wide association study identifies variants at CLU and CR1 associated with Alzheimer's disease. Nat Genet. 2009;41(10):1094-1099. doi: 10.1038/ng.439. [DOI] [PubMed] [Google Scholar]
- 29.Blauwendraat C, Faghri F, Pihlstrom L, et al. NeuroChip, an updated version of the NeuroX genotyping platform to rapidly screen for variants associated with neurological diseases. Neurobiol Aging. 2017;57:247.e9-247.e13. doi: 10.1016/j.neurobiolaging.2017.05.009. [DOI] [PMC free article] [PubMed] [Google Scholar]
- 30.Chang CC, Chow CC, Tellier LC, Vattikuti S, Purcell SM, Lee JJ. Second-generation PLINK: rising to the challenge of larger and richer datasets. Gigascience. 2015;4:7. doi: 10.1186/s13742-015-0047-8. [DOI] [PMC free article] [PubMed] [Google Scholar]
- 31.McCarthy S, Das S, Kretzschmar W, et al. A reference panel of 64,976 haplotypes for genotype imputation. Nat Genet. 2016;48(10):1279-1283. doi: 10.1038/ng.3643. [DOI] [PMC free article] [PubMed] [Google Scholar]
- 32.Kunkle BW, Grenier-Boley B, Sims R, et al. Genetic meta-analysis of diagnosed Alzheimer's disease identifies new risk loci and implicates Abeta, tau, immunity and lipid processing. Nat Genet. 2019;51(3):414-430. doi: 10.1038/s41588-019-0358-2. [DOI] [PMC free article] [PubMed] [Google Scholar]
- 33.Bellenguez C, Küçükali F, Jansen I, et al. New insights on the genetic etiology of Alzheimer's and related dementia. medRxiv. 2020:2020.10.01.20200659. doi: 10.1101/2020.10.01.20200659. [DOI] [Google Scholar]
- 34.Karczewski KJ, Francioli LC, Tiao G, et al. The mutational constraint spectrum quantified from variation in 141,456 humans. Nature. 2020;581(7809):434-443. doi: 10.1038/s41586-020-2308-7. [DOI] [PMC free article] [PubMed] [Google Scholar]
- 35.Taliun D, Harris DN, Kessler MD, et al. Sequencing of 53,831 diverse genomes from the NHLBI TOPMed Program. Nature. 2021;590(7845):290-299. doi: 10.1038/s41586-021-03205-y. [DOI] [PMC free article] [PubMed] [Google Scholar]
- 36.Das S, Forer L, Schönherr S, et al. Next-generation genotype imputation service and methods. Nat Genet. 2016;48(10):1284-1287. doi: 10.1038/ng.3656. [DOI] [PMC free article] [PubMed] [Google Scholar]
- 37.Jansen IE, Savage JE, Watanabe K, et al. Genome-wide meta-analysis identifies new loci and functional pathways influencing Alzheimer's disease risk. Nat Genet. 2019;51(3):404-413. doi: 10.1038/s41588-018-0311-9. [DOI] [PMC free article] [PubMed] [Google Scholar]
- 38.Team RC. R: A Language and Environment for Statistical Computing. R Foundation for Statistical Computing; 2020. [Google Scholar]
- 39.Lambert JC, Ibrahim-Verbaas CA, Harold D, et al. Meta-analysis of 74,046 individuals identifies 11 new susceptibility loci for Alzheimer's disease. Nat Genet. 2013;45(12):1452-1458. doi: 10.1038/ng.2802. [DOI] [PMC free article] [PubMed] [Google Scholar]
- 40.Chen EY, Tan CM, Kou Y, et al. Enrichr: interactive and collaborative HTML5 gene list enrichment analysis tool. BMC Bioinformatics. 2013;14:128. doi: 10.1186/1471-2105-14-128. [DOI] [PMC free article] [PubMed] [Google Scholar]
- 41.Kuleshov MV, Jones MR, Rouillard AD, et al. Enrichr: a comprehensive gene set enrichment analysis web server 2016 update. Nucleic Acids Res. 2016;44(W1):W90-W97. doi: 10.1093/nar/gkw377. [DOI] [PMC free article] [PubMed] [Google Scholar]
- 42.Grothe MJ, Villeneuve S, Dyrba M, Bartrés-Faz D, Wirth M. Multimodal characterization of older APOE2 carriers reveals selective reduction of amyloid load. Neurology. 2017;88(6):569-576. doi: 10.1212/wnl.0000000000003585. [DOI] [PMC free article] [PubMed] [Google Scholar]
- 43.Weiner MW, Veitch DP, Aisen PS, et al. 2014 Update of the Alzheimer's Disease Neuroimaging Initiative: a review of papers published since its inception. Alzheimers Dement. 2015;11(6):e1-120. doi: 10.1016/j.jalz.2014.11.001. [DOI] [PMC free article] [PubMed] [Google Scholar]
- 44.Rajabli F, Feliciano BE, Celis K, et al. Ancestral origin of ApoE ε4 Alzheimer disease risk in Puerto Rican and African American populations. PLoS Genet. 2018;14(12):e1007791. doi: 10.1371/journal.pgen.1007791. [DOI] [PMC free article] [PubMed] [Google Scholar]


