Abstract
Karnofsky performance status (KPS), a measure of physical frailty, predicts pre-transplant and post-transplant outcomes in liver transplantation, but has not been assessed in simultaneous liver kidney transplantation (SLKT). We examined the association between KPS and outcomes in SLKT waitlist registrants and recipients (2005–2018) in the UNOS database.
KPS was categorized into A (able to work), B (able to provide self-care), and C (unable to provide self-care). Cox regression and competing risk analysis were used to assess the association between KPS groups and outcomes.
10,785 patients were waitlisted (KPS: 19% A, 46% B, 35% C), and 5,516 underwent SLKT (12% A, 36% B, 52% C). One-year waitlist mortality was 17%, 22%, and 32% for KPS A, B, and C, respectively. In adjusted competing risk regression, KPS C was associated with increased waitlist mortality (SHR 1.15, 95%CI 1.04–1.28). One-year post-transplant survival was 92%, 91%, and 87% for KPS A, B, and C, respectively. In adjusted Cox regression, KPS C was associated with increased post-transplant mortality (HR 1.32, 95%CI 1.08–1.61). It was also associated with increased liver and kidney graft losses and with hospital length of stay.
Frailty, as assessed by KPS, is associated with poor outcomes in SLKT pre- and post-transplant.
1, Introduction:
Acute and chronic kidney diseases are common in patients with cirrhosis 1–3. In this population, renal impairment is strongly associated with poor outcomes, and this relationship is recognized in the Model for End-Stage Liver Disease (MELD) score, which heavily weights kidney dysfunction in patient prioritization for liver transplantation (LT). In some patients with cirrhosis and acute kidney injury (hepatorenal syndrome), this kidney dysfunction is reversible with LT alone; in others with parenchymal kidney damage, the kidney dysfunction may be irreversible with LT, and these patients often require simultaneous liver-kidney transplantation (SLKT). In recent years, renal impairment in cirrhosis is more often becoming irreversible due in part to an increasing burden of comorbidities such as diabetes and nonalcoholic fatty liver disease 4. As a result, there has been an increase in the number of SLKT performed in the US, now accounting for 9% of liver transplants 5.
Robust and comprehensive patient assessment is paramount to optimize SLKT outcomes in both the pre- and post-transplant settings. Frailty, defined as a person’s vulnerability to health stressors and decreased physiologic reserve 6, has been shown to be associated with poor outcomes in candidates for LT 7–12 as well as kidney transplantation 13. Frailty is a multi-faceted concept, and several different measures of frailty have been examined in cirrhosis 14. One measure of frailty, the Karnofsky performance status (KPS), is a subjective provider-administered assessment of functional status that has been in use for 70 years 15. KPS has been shown to be a valid predictor of outcomes in LT candidates and recipients 16–22. Based on these data, clinical practice guidelines support LT candidate risk assessment with KPS 14. However, despite this growing literature, to our knowledge there are no published studies of KPS or other frailty measures in candidates for SLKT.
To better understand the utility of KPS in SLKT candidates and recipients, we undertook a cohort study with a primary aim of examining the association between KPS and mortality in patients listed for SLKT. We also examined the relationship between KPS and post-transplant outcomes including patient and graft survival in SLKT recipients. We hypothesized that patients with poor functional status as assessed by KPS would have inferior outcomes in terms of waitlist mortality, post-transplant survival, and both liver and kidney graft survival.
2, Methods:
We utilized standard transplant analysis and research files from UNOS, which contain data on all patients waitlisted for organ transplant and all organ transplant recipients in the United States. The data included all waitlist registrations and transplants through June 30, 2018, with follow-up through September 7, 2018. In this study, we employed two cohorts to separately examine (1) outcomes of patients on the waitlist for SLKT (Cohort 1) and (2) outcomes of SLKT recipients (Cohort 2). This study was approved by the Indiana University Institutional Review Board.
2.1, Cohort 1 (Pre-Transplant):
For the pre-transplant analysis, we included adults ≥ 18 years of age listed for SLKT on or after April 1, 2005. KPS was not consistently available prior to that date. We excluded patients with a previous history of liver transplant, listings for organs other than liver or kidney, a non-cirrhosis diagnosis, and acute liver failure. We also excluded patients who were transferred to another center or received a transplant at another center and patients with missing KPS at listing.
In Cohort 1, the primary outcome was waitlist mortality defined as removal from the waitlist due to death, clinical deterioration, or medical instability. The secondary outcome was receipt of SLKT.
2.2, Cohort 2 (Post-Transplant):
For the post-transplant analysis, we included patients listed on or after April 1, 2005 who underwent SLKT and were aged ≥ 18 years at the time of transplant. We excluded patients with a previous history of liver or kidney transplant, and patients listed or transplanted with organs other than liver or kidney. We also excluded patients with missing KPS at the time of listing or transplant.
In Cohort 2, the primary outcome was patient mortality. Secondary outcomes included liver and kidney graft failures and length of transplant hospital stay.
2.3, Karnofsky Performance Status:
The KPS scale is graded in 10% increments from 0 (dead) to 100% (normal; no complaints; no evidence of disease) 15. It is captured systematically by transplant centers at the time of both waitlist registration and transplant. We categorized KPS into three groups based on a patient’s ability to work or provide self-care as previously described 15,23. KPS category A (80–100%) describes patients who are able to carry on normal activity and work; KPS B (50–70%) describes patients who are unable to work but are able to care for themselves; and KPS C (10–40%) describes patients who are unable to provide self-care.
For Cohort 1, KPS at the time of waitlisting was examined as a predictor of outcomes. For Cohort 2, KPS at the time of transplant was used. In Cohort 2, we also examined the change in KPS from the time of listing to the time of transplant as a predictor of post-transplant outcomes.
2.4, Variables:
We examined potential confounding variables that could influence outcomes. In analysis of Cohort 1, these variables were assessed at the time of waitlisting; for Cohort 2, we used variables collected at the time of transplant. We examined age, sex, race/ethnicity (white, black, Hispanic, and other), body mass index (BMI), diabetes, dialysis, MELD score, serum albumin, presence of ascites (absent, slight, moderate) and hepatic encephalopathy (none, grade 1–2, grade 3–4), presence of hepatocellular carcinoma, UNOS region, year, and underlying liver disease. The underlying liver disease was categorized as alcohol, hepatitis C, alcohol/hepatitis C, nonalcoholic steatohepatitis/cryptogenic, autoimmune/cholestatic, and other. For Cohort 1, we also included ABO blood type; for Cohort 2, we also included medical condition at the time of transplant (not hospitalized, hospitalized [not intensive care], intensive care). For Cohort 2, we also considered donor-related risk factors by examining both the liver donor risk index and the kidney donor profile index 24,25.
2.5, Statistical Analysis:
Continuous and categorical clinical characteristics were summarized using means and standard deviations and counts and percentages, respectively, and stratified by KPS group. Distributional differences across groups were tested using two sample t-tests, chi-square tests, or suitable nonparametric alternatives where normality assumptions appeared tenuous.
Competing risk time to event analyses were utilized within the waitlist cohort for time to mortality as the main event and transplant as a competing risk. Cumulative incidence curves were compared across KPS groups using Gray’s test. Unadjusted and adjusted cause-specific and sub-distribution hazards were generated and compared across strata within proportional hazards and Fine and Gray’s sub-distribution regression frameworks, respectively. Confounding variables with statistically significant distributional differences across the different groups were included in the adjusted models.
Proportional hazards regression was utilized within the post-transplant cohort without competing risks and unadjusted and adjusted mortality hazard ratios were compared across strata using Wald tests.
Length of stay analyses were performed by log transforming length of stay to stabilize a positive skewed distribution and unadjusted and adjusted analyses were performed using two sample tests and generalized linear models, respectively, with estimates reported as ratios of geometric means. All analyses were performed using SAS 9.4.
3, RESULTS
3.1, Cohort 1 – Waitlist Registrants
3.1.1, Patient Characteristics and Trends
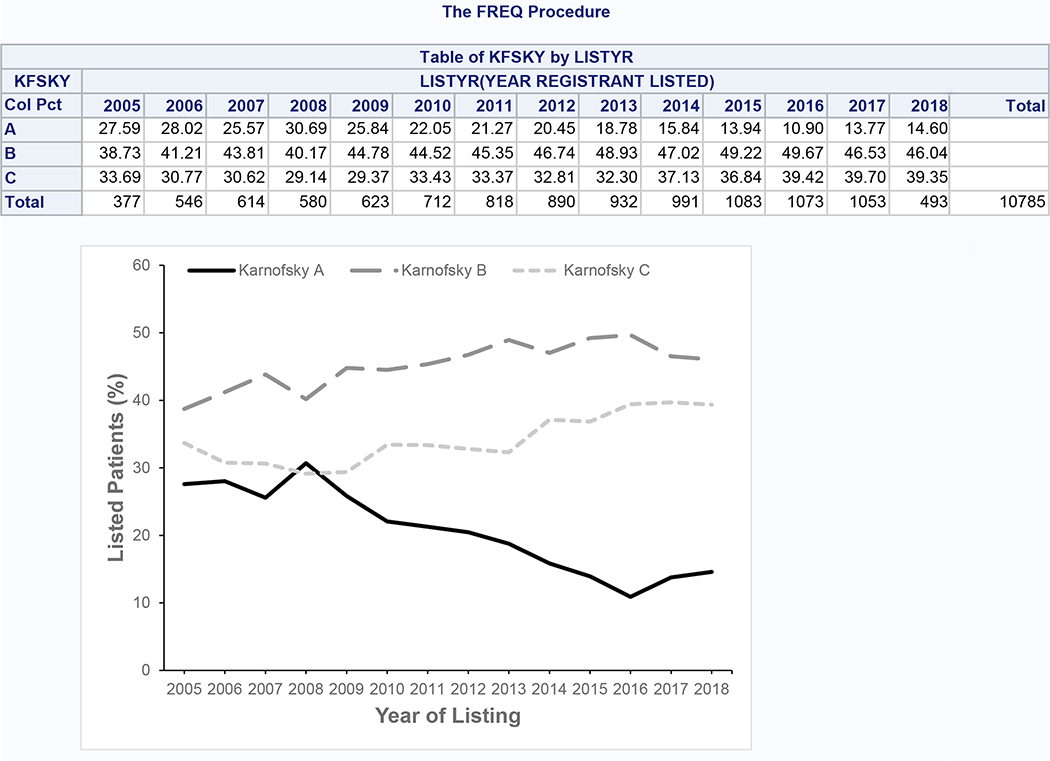
After applying inclusion and exclusion criteria, we identified 10,785 patients listed for SLKT for our analytic dataset (Supplementary Figure 1). 2,083 patients (19.3%) had KPS A, 4,961 (46.0%) had KPS B, and 3,741 (34.7%) had KPS C. From 2005 to 2018, the proportion with KPS A decreased from 27.6% to 14.6%, while the proportion with KPS B and C increased from 38.7% to 46.0% and from 33.7% to 39.4%, respectively (Figure 1). Aside from BMI, all characteristics of patients across KPS groups were statistically significantly different (p<0.001) (Table 1). The KPS groups had numerically similar age and serum albumin. Lower KPS was associated with female sex, white and Hispanic race/ethnicity, requirement for dialysis, increased MELD score, presence of ascites and hepatic encephalopathy, and alcoholic liver disease. Preserved KPS was associated with black race, hepatitis C, and hepatocellular carcinoma. Diabetes was less common among those with KPS C.
Figure 1:
Trends in Karnofsky Performance Status Among Patients Listed for SLKT (Cohort 1)
Table 1.
Characteristics of Patients Listed for SLKT (Cohort 1)
| Characteristic | Overall N = 10,785 | Karnofsky A N = 2,083 | Karnofsky B N = 4,961 | Karnofsky C N = 3,741 | p-value |
|---|---|---|---|---|---|
|
| |||||
| Age, y, mean (SD) | 56.2 (9.4) | 56.3 (9.2) | 56.6 (9.2) | 55.4 (9.6) | <0.001 |
|
| |||||
| Male, % | 63.2 | 66.9 | 62.7 | 61.8 | <0.001 |
|
| |||||
| Race/ethnicity, % | |||||
| White | 60.8 | 58.3 | 60.4 | 62.7 | <0.001 |
| Black | 14.0 | 16.2 | 15.1 | 11.4 | |
| Hispanic | 19.5 | 18.3 | 19.0 | 21.0 | |
| Other | 5.6 | 7.2 | 5.5 | 4.9 | |
|
| |||||
| BMI, kg/m2, mean (SD) | 28.4 (5.9) | 28.4 (5.4) | 28.4 (5.9) | 28.5 (6.3) | 0.64 |
|
| |||||
| Diabetes, % | 46.3 | 48.5 | 48.6 | 42.1 | <0.001 |
|
| |||||
| Dialysis, % | 46.0 | 34.6 | 42.4 | 57.0 | <0.001 |
|
| |||||
| MELD score, mean (SD) | 24.6 (8.4) | 20.1 (6.1) | 22.3 (6.7) | 30.1 (8.7) | <0.001 |
|
| |||||
| Serum albumin, g/dL, mean (SD) | 3.1 (0.7) | 3.1 (0.7) | 3.1 (0.7) | 3.1 (0.8) | <0.001 |
|
| |||||
| Ascites, % | <0.001 | ||||
| Absent | 16.9 | 27.1 | 17.6 | 10.2 | |
| Slight | 42.8 | 49.1 | 45.7 | 35.6 | |
| Moderate | 40.2 | 23.7 | 36.6 | 54.2 | |
|
| |||||
| Hepatic encephalopathy, % | <0.001 | ||||
| None | 34.1 | 49.8 | 35.3 | 23.7 | |
| Grade 1–2 | 56.8 | 47.7 | 58.7 | 59.2 | |
| Grade 3–4 | 9.1 | 2.4 | 5.9 | 17.0 | |
|
| |||||
| Liver disease, % | <0.001 | ||||
| Alcohol | 23.1 | 16.5 | 21.5 | 28.9 | |
| Hepatitis C | 27.0 | 32.4 | 28.1 | 22.6 | |
| Alcohol/hepatitis C | 4.6 | 4.1 | 4.8 | 4.6 | |
| NASH/cryptogenic | 25.1 | 22.2 | 26.7 | 24.7 | |
| Autoimmune/cholestatic | 5.3 | 6.3 | 5.0 | 5.3 | |
| Other | 14.8 | 18.6 | 14.0 | 13.8 | |
|
| |||||
| Hepatocellular carcinoma, % | 5.2 | 7.9 | 5.9 | 2.8 | <0.001 |
Abbreviations:
BMI: Body mass index
MELD: Model for end-stage liver disease
NASH: Non-alcoholic steatohepatitis
3.1.2, Outcomes
At a median follow-up of 4.3 months (interquartile range [IQR] 1–13.8), 5,520 (51.2%) patients received a transplant and 3,555 (33.0%) were removed from the waitlist for death or clinical deterioration. The incidences of both transplant and mortality were increased with lower KPS (Figure 2). The 1-year incidence of death was 16.6% for KPS A, 22.4% for KPS B, and 32.4% for KPS C, and the 1-year incidence of transplant was 35.3% for KPS A, 45.2% for KPS B, and 53.9% for KPS C. In Cox proportional hazards models, lower KPS was associated with increased risk for death and/or transplant, but after adjustment for potential confounders, KPS B was not associated with increased transplants (Table 2). In competing risk regression models, KPS C was associated with increased risk for both death and transplantation. KPS B was associated with increased transplants in the unadjusted model only. After adjustment for confounding variables, KPS was not associated with transplant; however, KPS C remained associated with increased risk for death compared to KPS A.
Figure 2:
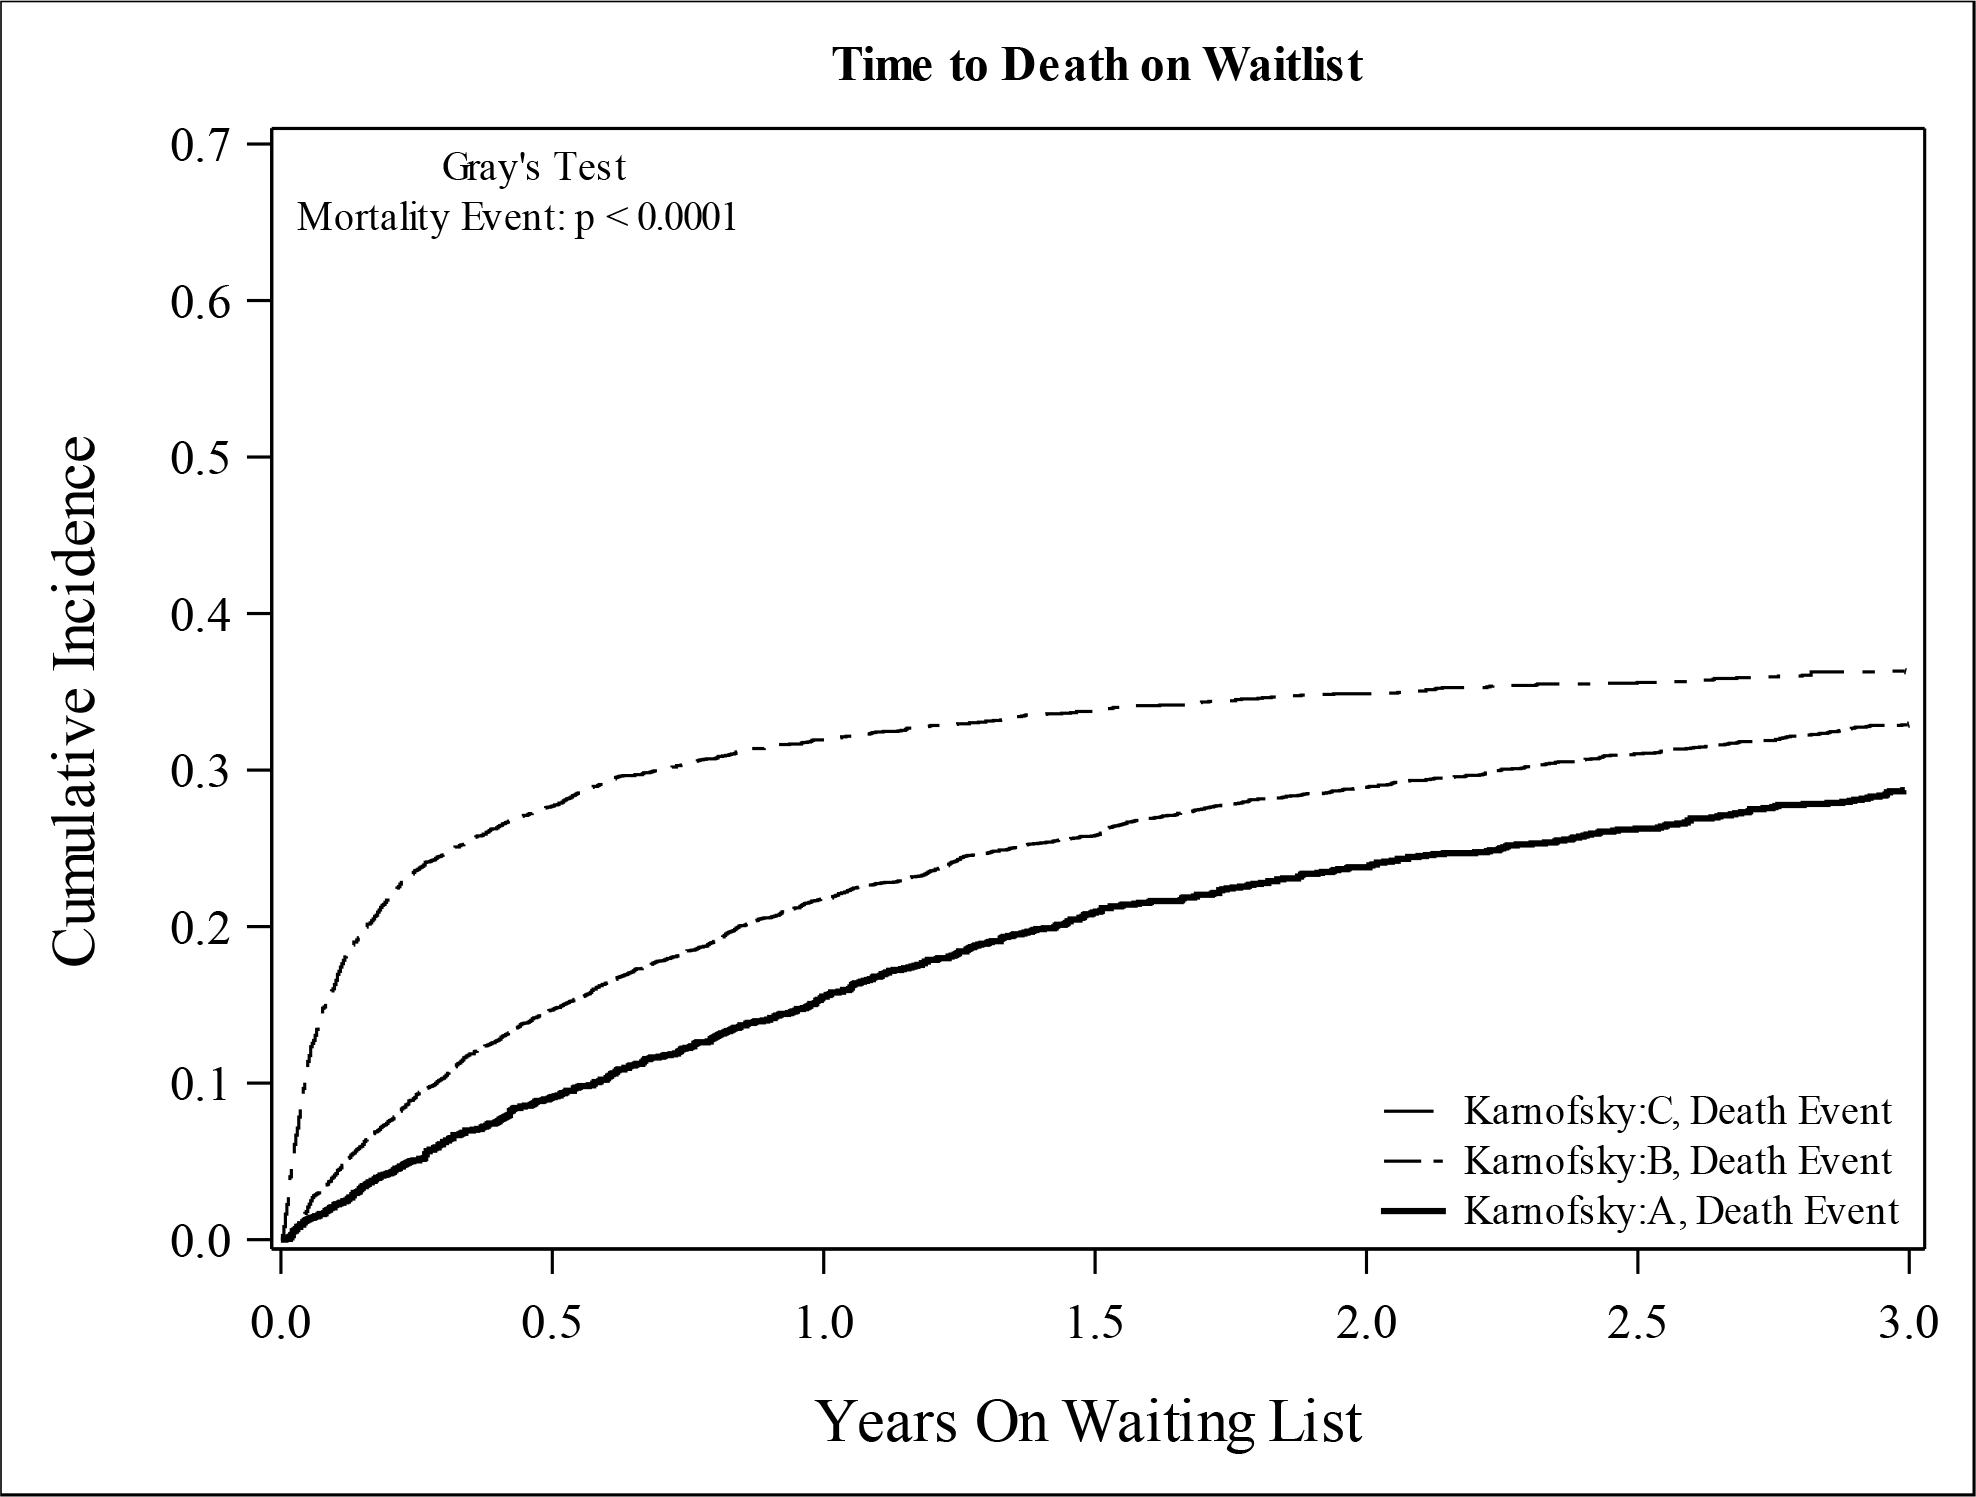
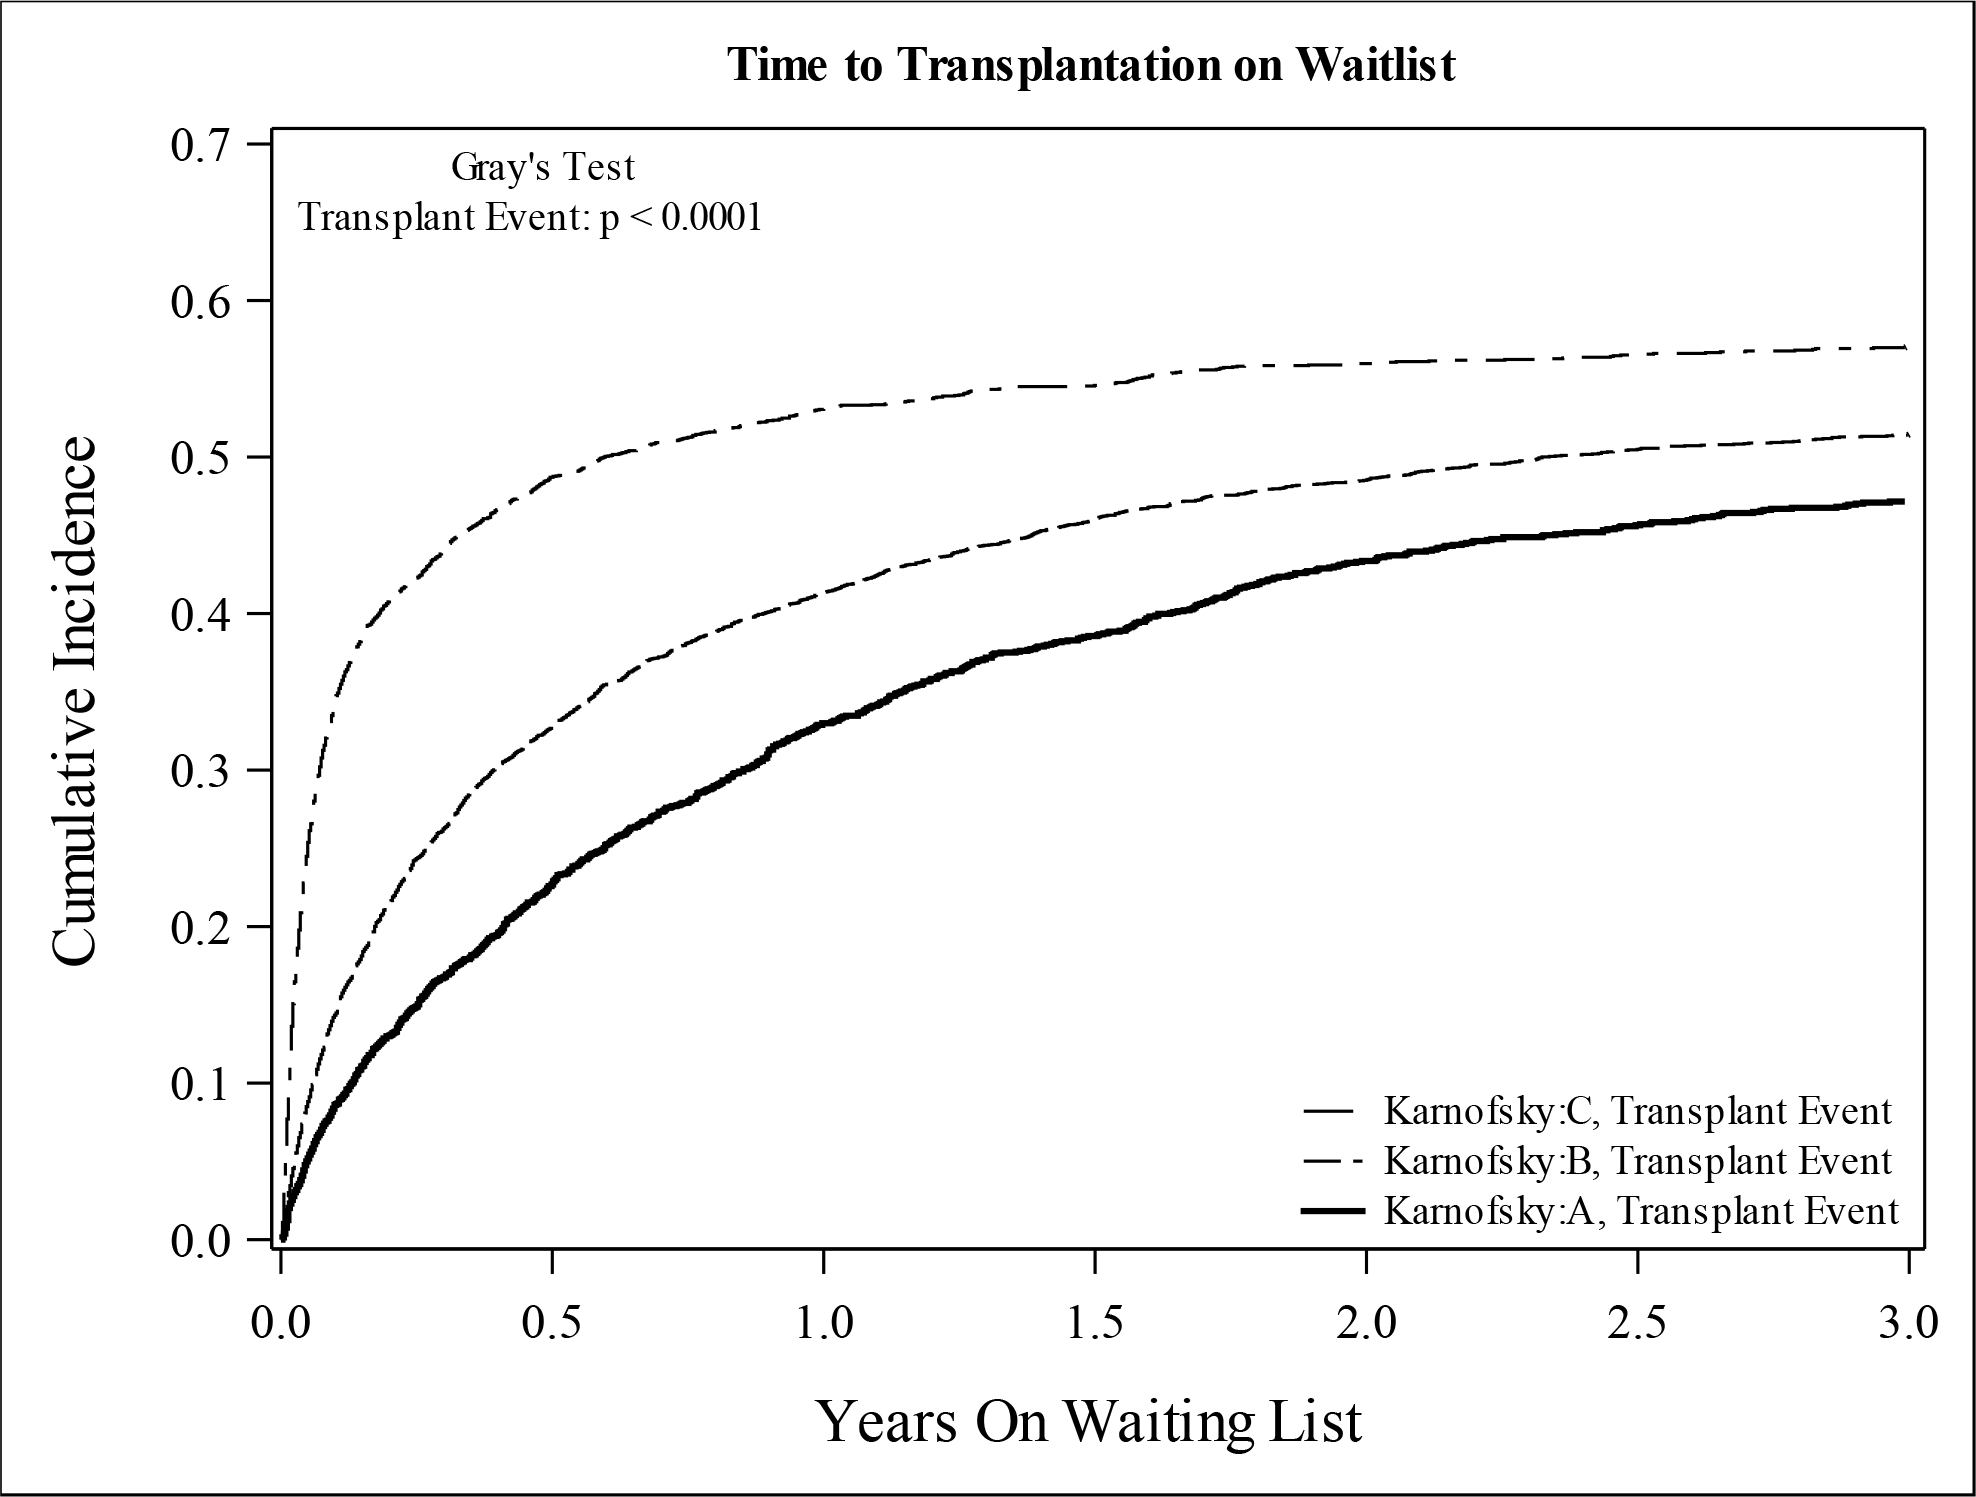
Cumulative Incidence of (A) Mortality and (B) Transplant Among Patients Listed for SLKT (Cohort 1) According to Karnofsky Performance Status at Listing
Table 2.
Relationship Between Karnofsky Performance Status and Clinical Outcomes of Patients Listed for SLKT (Cohort 1)
| Unadjusted HR | Adjusted HR* | Unadjusted SHR | Adjusted SHR* | |
|---|---|---|---|---|
|
| ||||
| Death/deterioration | ||||
| Karnofsky A | 1 (Ref) | 1 (Ref) | 1 (Ref) | 1 (Ref) |
| Karnofsky B | 1.36 (1.25–1.49) | 1.16 (1.05–1.27) | 1.06 (0.97–1.15) | 1.06 (0.971.16) |
| Karnofsky C | 2.93 (2.67–3.23) | 1.49 (1.34–1.66) | 1.32 (1.21–1.45) | 1.15 (1.041.28) |
|
| ||||
| Transplantation | ||||
| Karnofsky A | 1 (Ref) | 1 (Ref) | 1 (Ref) | 1 (Ref) |
| Karnofsky B | 1.30 (1.21–1.40) | 1.04 (0.97–1.13) | 1.14 (1.06–1.22) | 0.98 (0.911.05) |
| Karnofsky C | 2.51 (2.33–2.71) | 1.30 (1.19–1.42) | 1.56 (1.45–1.67) | 1.06 (0.971.15) |
|
| ||||
| Death or transplantation | ||||
| Karnofsky A | 1 (Ref) | 1 (Ref) | N/A | N/A |
| Karnofsky B | 1.33 (1.25–1.40) | 1.09 (1.03–1.16) | ||
| Karnofsky C | 2.67 (2.52–2.84) | 1.38 (1.29–1.47) | ||
Adjusted for Age, Sex, Race/Ethnicity, Diabetes, MELD, Albumin, Dialysis, ABO Blood type, Ascites, Encephalopathy, Cirrhosis Etiology, HCC, Region, Year of Listing
3.2, Cohort 2 – Transplant Recipients
3.2.1, Patient Characteristics and Trends
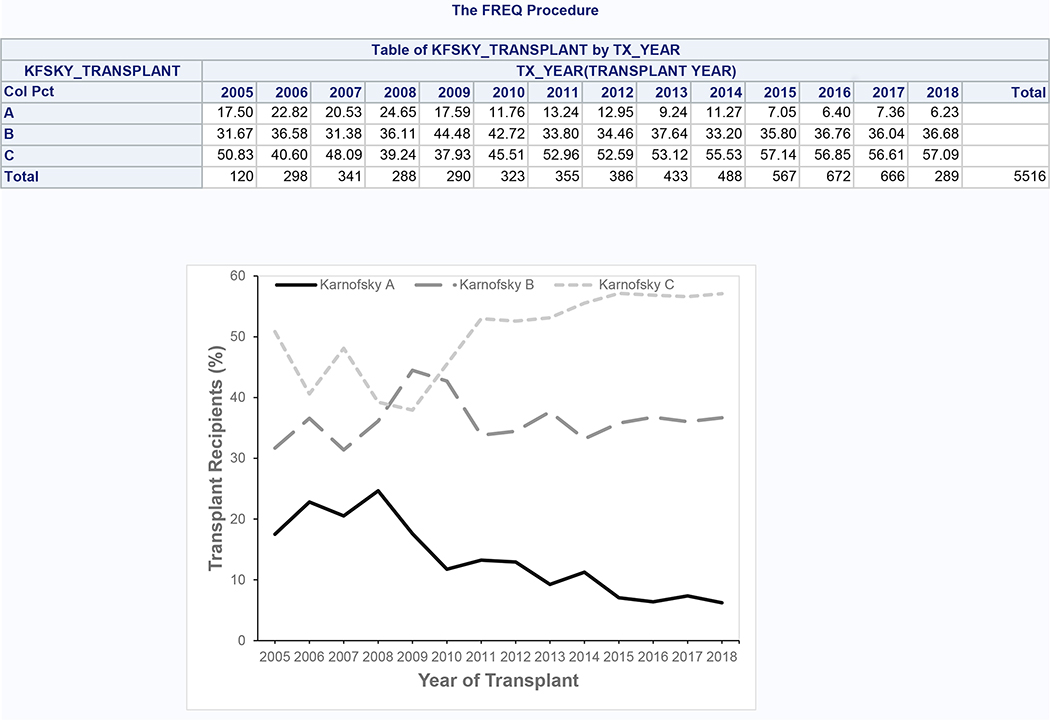
5,516 patients meeting inclusion and exclusion criteria underwent SLKT during the study period (Supplementary Figure 2), of which 661 (12.0%) had KPS A, 1,999 (36.2%) had KPS B, and 2,856 (51.8%) had KPS C at the time of transplant. During the study period, the proportion with KPS A decreased from 17.5% to 6.2%, while the proportion with KPS B and C increased from 31.7% to 36.7% and from 50.8% to 57.1%, respectively (Figure 3). KPS groups were similar with regard to age, BMI, diabetes, serum albumin, and donor risk index (Table 3). Lower KPS was associated with female sex, Hispanic ethnicity, requirement for dialysis, increased MELD score, presence of ascites and hepatic encephalopathy, requirement for hospitalization and intensive care, and alcoholic liver disease and nonalcoholic steatohepatitis. Preserved KPS was associated with black race and hepatocellular carcinoma.
Figure 3:
Trends in Karnofsky Performance Status Among SLKT Recipients (Cohort 2)
Table 3.
Characteristics of SLKT Recipients (Cohort 2)
| Characteristic | Overall N = 5,516 | Karnofsky A N = 661 | Karnofsky B N = 1,999 | Karnofsky C N = 2,856 | p-value |
|---|---|---|---|---|---|
|
| |||||
| Age, y, mean (SD) | 55.9 (9.8) | 55.7 (9.9) | 56.3 (9.6) | 55.7 (9.9) | 0.11 |
|
| |||||
| Male, % | 64.6 | 67.3 | 66.2 | 62.9 | 0.02 |
|
| |||||
| Race/ethnicity, % | |||||
| White | 62.9 | 62.9 | 63.4 | 62.6 | <0.001 |
| Black | 15.2 | 19.4 | 17.4 | 12.8 | |
| Hispanic | 16.8 | 11.5 | 15.2 | 19.3 | |
| Other | 5.0 | 6.2 | 4.1 | 5.4 | |
|
| |||||
| BMI, kg/m2, mean (SD) | 27.7 (5.8) | 27.4 (5.2) | 27.6 (5.5) | 27.9 (6.1) | 0.10 |
|
| |||||
| Diabetes, % | 42.4 | 39.5 | 45.0 | 41.4 | 0.01 |
|
| |||||
| Dialysis, % | 69.2 | 58.5 | 63.1 | 76.0 | <0.001 |
|
| |||||
| MELD score, mean (SD) | 29.3 (8.1) | 24.2 (6.3) | 26.0 (6.8) | 32.9 (7.8) | <0.001 |
|
| |||||
| Serum albumin, g/dL, mean (SD) | 3.1 (0.8) | 3.2 (0.7) | 3.1 (0.7) | 3.1 (0.8) | 0.01 |
|
| |||||
| Ascites, % | |||||
| Absent | 17.2 | 30.4 | 21.4 | 11.2 | <0.001 |
| Slight | 38.1 | 42.1 | 42.3 | 34.3 | |
| Moderate | 44.1 | 26.2 | 36.1 | 54.0 | |
|
| |||||
| Hepatic encephalopathy, % | |||||
| None | 32.1 | 49.3 | 39.3 | 23.1 | <0.001 |
| Grade 1–2 | 53.2 | 43.4 | 52.8 | 55.7 | |
| Grade 3–4 | 14.2 | 5.9 | 7.8 | 20.6 | |
|
| |||||
| Medical condition, % | |||||
| Not hospitalized | 57.5 | 91.1 | 85.5 | 30.0 | <0.001 |
| Hospitalized (not ICU) | 23.9 | 7.1 | 11.6 | 36.4 | |
| Intensive care unit | 18.7 | 1.8 | 3.0 | 33.5 | |
|
| |||||
| Liver disease, % | |||||
| Alcohol | 20.5 | 14.1 | 17.8 | 23.8 | <0.001 |
| Hepatitis C | 22.7 | 23.9 | 24.7 | 21.0 | |
| Alcohol/hepatitis C | 4.0 | 2.7 | 3.8 | 4.4 | |
| NASH/cryptogenic | 21.7 | 17.2 | 20.7 | 23.4 | |
| Autoimmune/cholestatic | 4.4 | 3.2 | 3.9 | 5.1 | |
| Other | 26.7 | 38.9 | 29.2 | 22.2 | |
|
| |||||
| Hepatocellular carcinoma, % | 11.2 | 14.4 | 13.1 | 9.1 | <0.001 |
|
| |||||
| Liver Donor risk index, mean (SD) | 1.53 (0.30) | 1.52 (0.29) | 1.53 (0.32) | 1.53 (0.29) | 0.40 |
|
| |||||
| KDPI, mean (SD) | 0.36 (0.26) | 0.36 (0.25) | 0.37 (0.26) | 0.36 (0.260) | 0.1516 |
Abbreviations:
BMI: Body mass index
MELD: Model for end-stage liver disease
ICU: Intensive care unit
NASH: Non-alcoholic steatohepatitis
KDPI: Kidney donor profile index
3.2.2, Changes in Karnofsky Performance Status
The median time between waitlisting and transplant was 65 days (IQR 16–230). During this time, 19.7% had improvement in KPS, 33.3% had no change in KPS, and 47.0% had a decline in KPS. The distributions of the change in KPS stratified by listing KPS are shown in Supplementary Figures 3–5. Of those listed with KPS A, 72.4% had a decline in KPS, 23.2% had no change, and 4.4% had an improvement; of those listed with KPS B, 53.2% had a decline, 29.3% had no change, and 17.4% had an improvement; of those listed with KPS C, 24.4% had a decline, 44.3% had no change, and 31.3% had an improvement.
3.2.3, Outcomes
The median transplant hospitalization length of stay was 13 days (IQR 8–24), and it was significantly longer for patients with KPS C at transplant (16 days, IQR 10–29) compared to KPS A (11 days, IQR 7–16) and B (11 days, IQR 8–19) (p<0.001). After adjustment for potential confounders, hospital length of stay remained significantly longer for KPS C patients compared to KPS A (ratio of geometric means 1.18; 95% confidence interval [CI], 1.10–1.27) (Table 4).
Table 4.
Relationship Between Karnofsky Performance Status and Clinical Outcomes of SLKT Recipients (Cohort 2)
| Unadjusted Effect Size | Adjusted Effect Size* | |
|---|---|---|
|
| ||
| Post-transplant length of stay | ||
| Karnofsky A | 1 (Ref) | 1 (Ref) |
| Karnofsky B | 1.07 (1.00–1.14) | 1.04 (0.98–1.12) |
| Karnofsky C | 1.53 (1.43–1.63) | 1.18 (1.10–1.27) |
|
| ||
| Liver graft loss | ||
| Karnofsky A | 1 (Ref) | 1 (Ref) |
| Karnofsky B | 1.09 (0.92–1.30) | 1.13 (0.95–1.35) |
| Karnofsky C | 1.31 (1.11–1.54) | 1.33 (1.10–1.61) |
|
| ||
| Kidney graft loss | ||
| Karnofsky A | 1 (Ref) | 1 (Ref) |
| Karnofsky B | 1.08 (0.92–1.27) | 1.12 (0.95–1.32) |
| Karnofsky C | 1.33 (1.14–1.55) | 1.35 (1.13–1.62) |
|
| ||
| Patient mortality | ||
| Karnofsky A | 1 (Ref) | 1 (Ref) |
| Karnofsky B | 1.09 (0.92–1.31) | 1.26 (0.94–1.35) |
| Karnofsky C | 1.32 (1.12–1.56) | 1.32 (1.08–1.61) |
Length of stay is presented as ratio of geometric means. Graft loss and patient mortality are presented as hazard ratios.
Adjusted for Sex, Race/Ethnicity, Dialysis, MELD, Diabetes, Albumin, Ascites, Encephalopathy, Medical Condition at Transplant, Cirrhosis Etiology, HCC, Region, Transplant Year
At a median follow-up of 3.0 years (IQR 1.1–6.0), 1,375 (24.9%) patients experienced liver graft failure, 1,599 (29.0%) experienced kidney graft failure, and 1,314 (23.8%) died. Lower KPS at transplant was significantly associated with increased liver and graft failures as well as mortality (Figure 4). At 1 year, liver graft survival was 90.9% for KPS A, 89.8% for KPS B, and 85.3% for KPS C. 1-year kidney graft survival was 90.6% for KPS A, 88.5% for KPS B, and 83.9% for KPS C. 1-year patient survival was 92.4% for KPS A, 91.0% for KPS B, and 86.5% for KPS C. In Cox proportional hazards models, KPS C was significantly associated with decreased graft and patient survival in both unadjusted and adjusted analyses (Table 4). KPS B was not statistically significantly associated with the outcomes.
Figure 4:
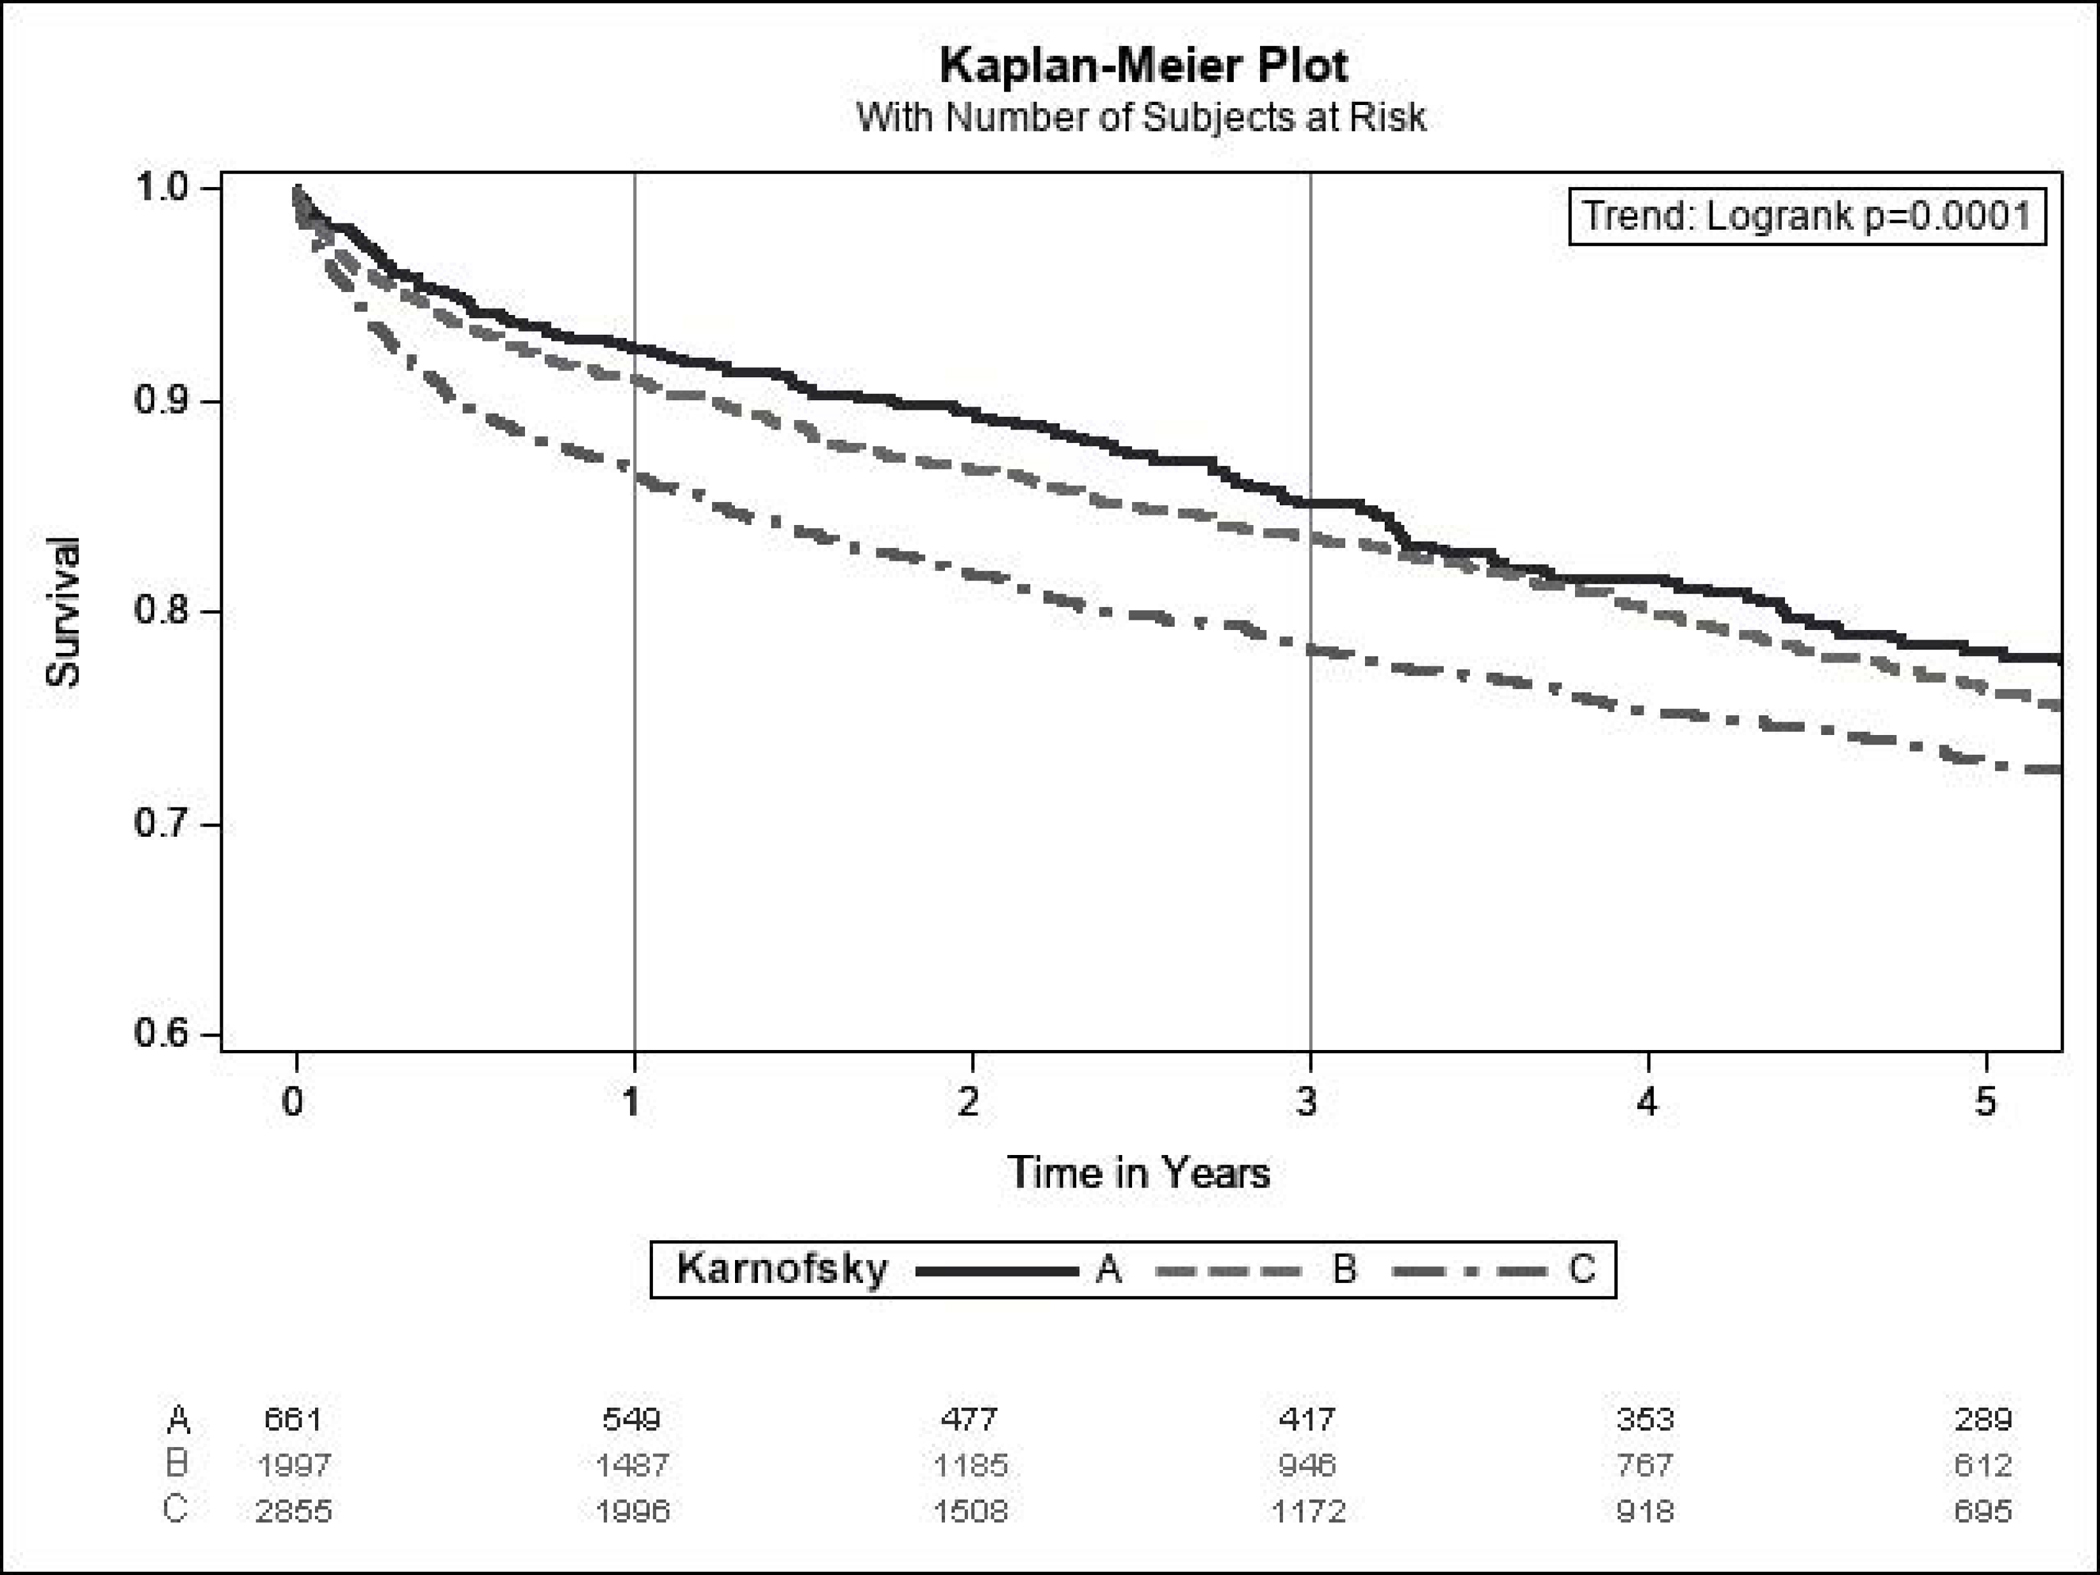
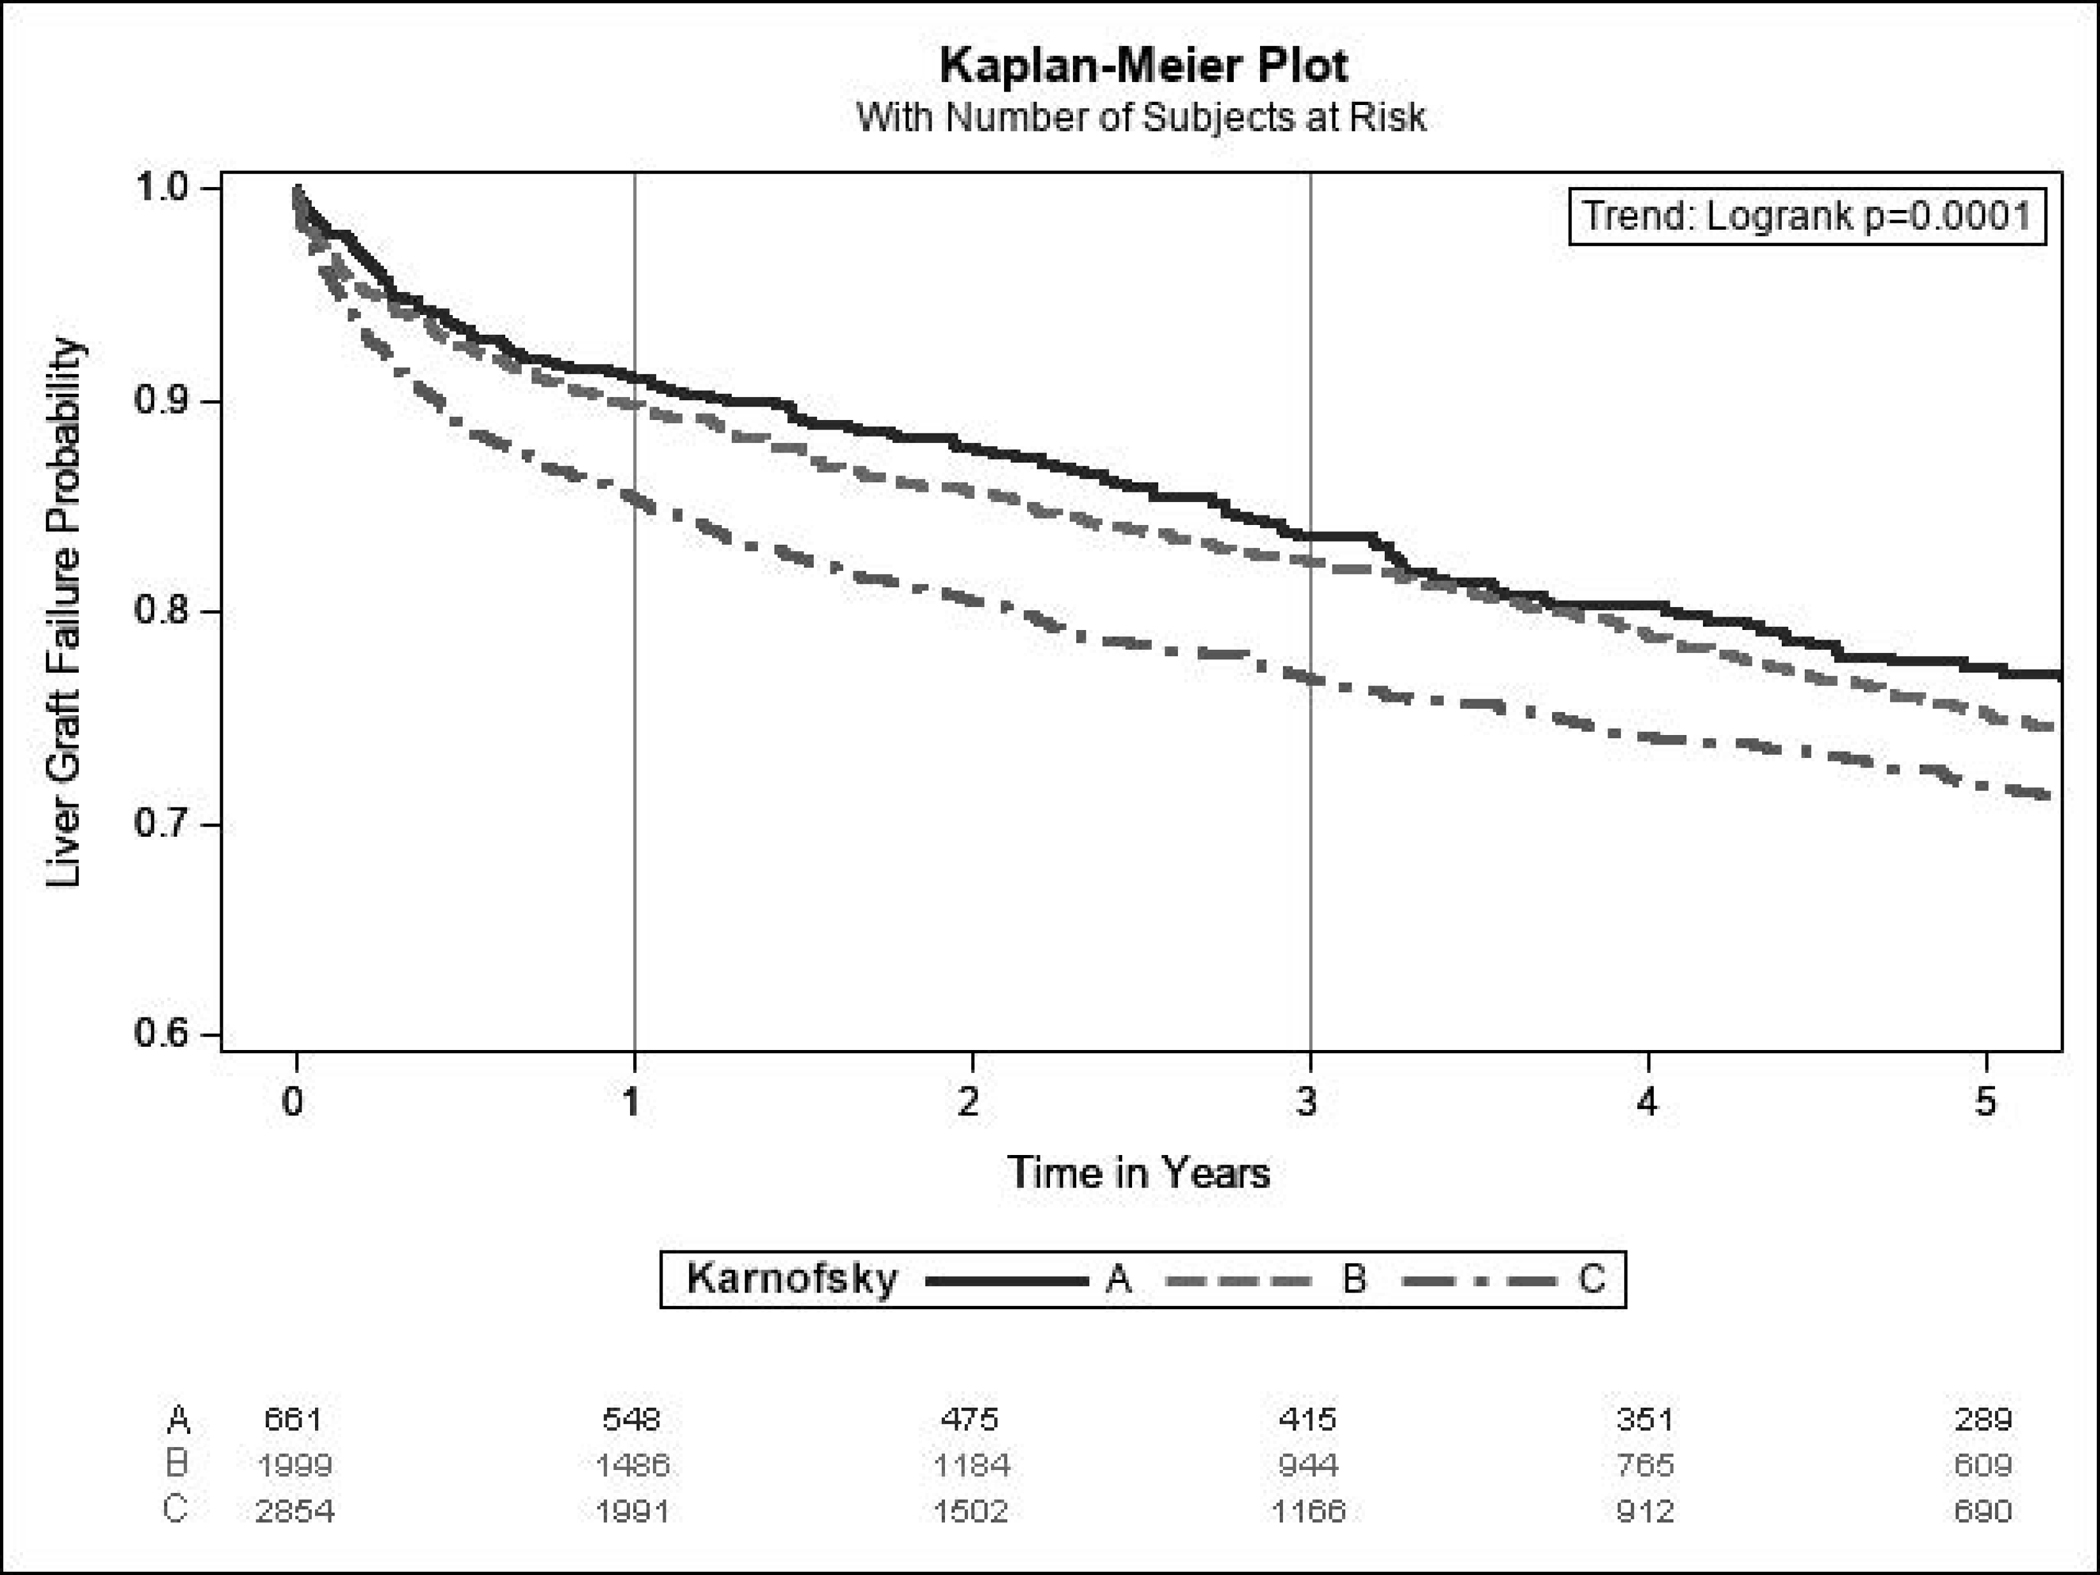
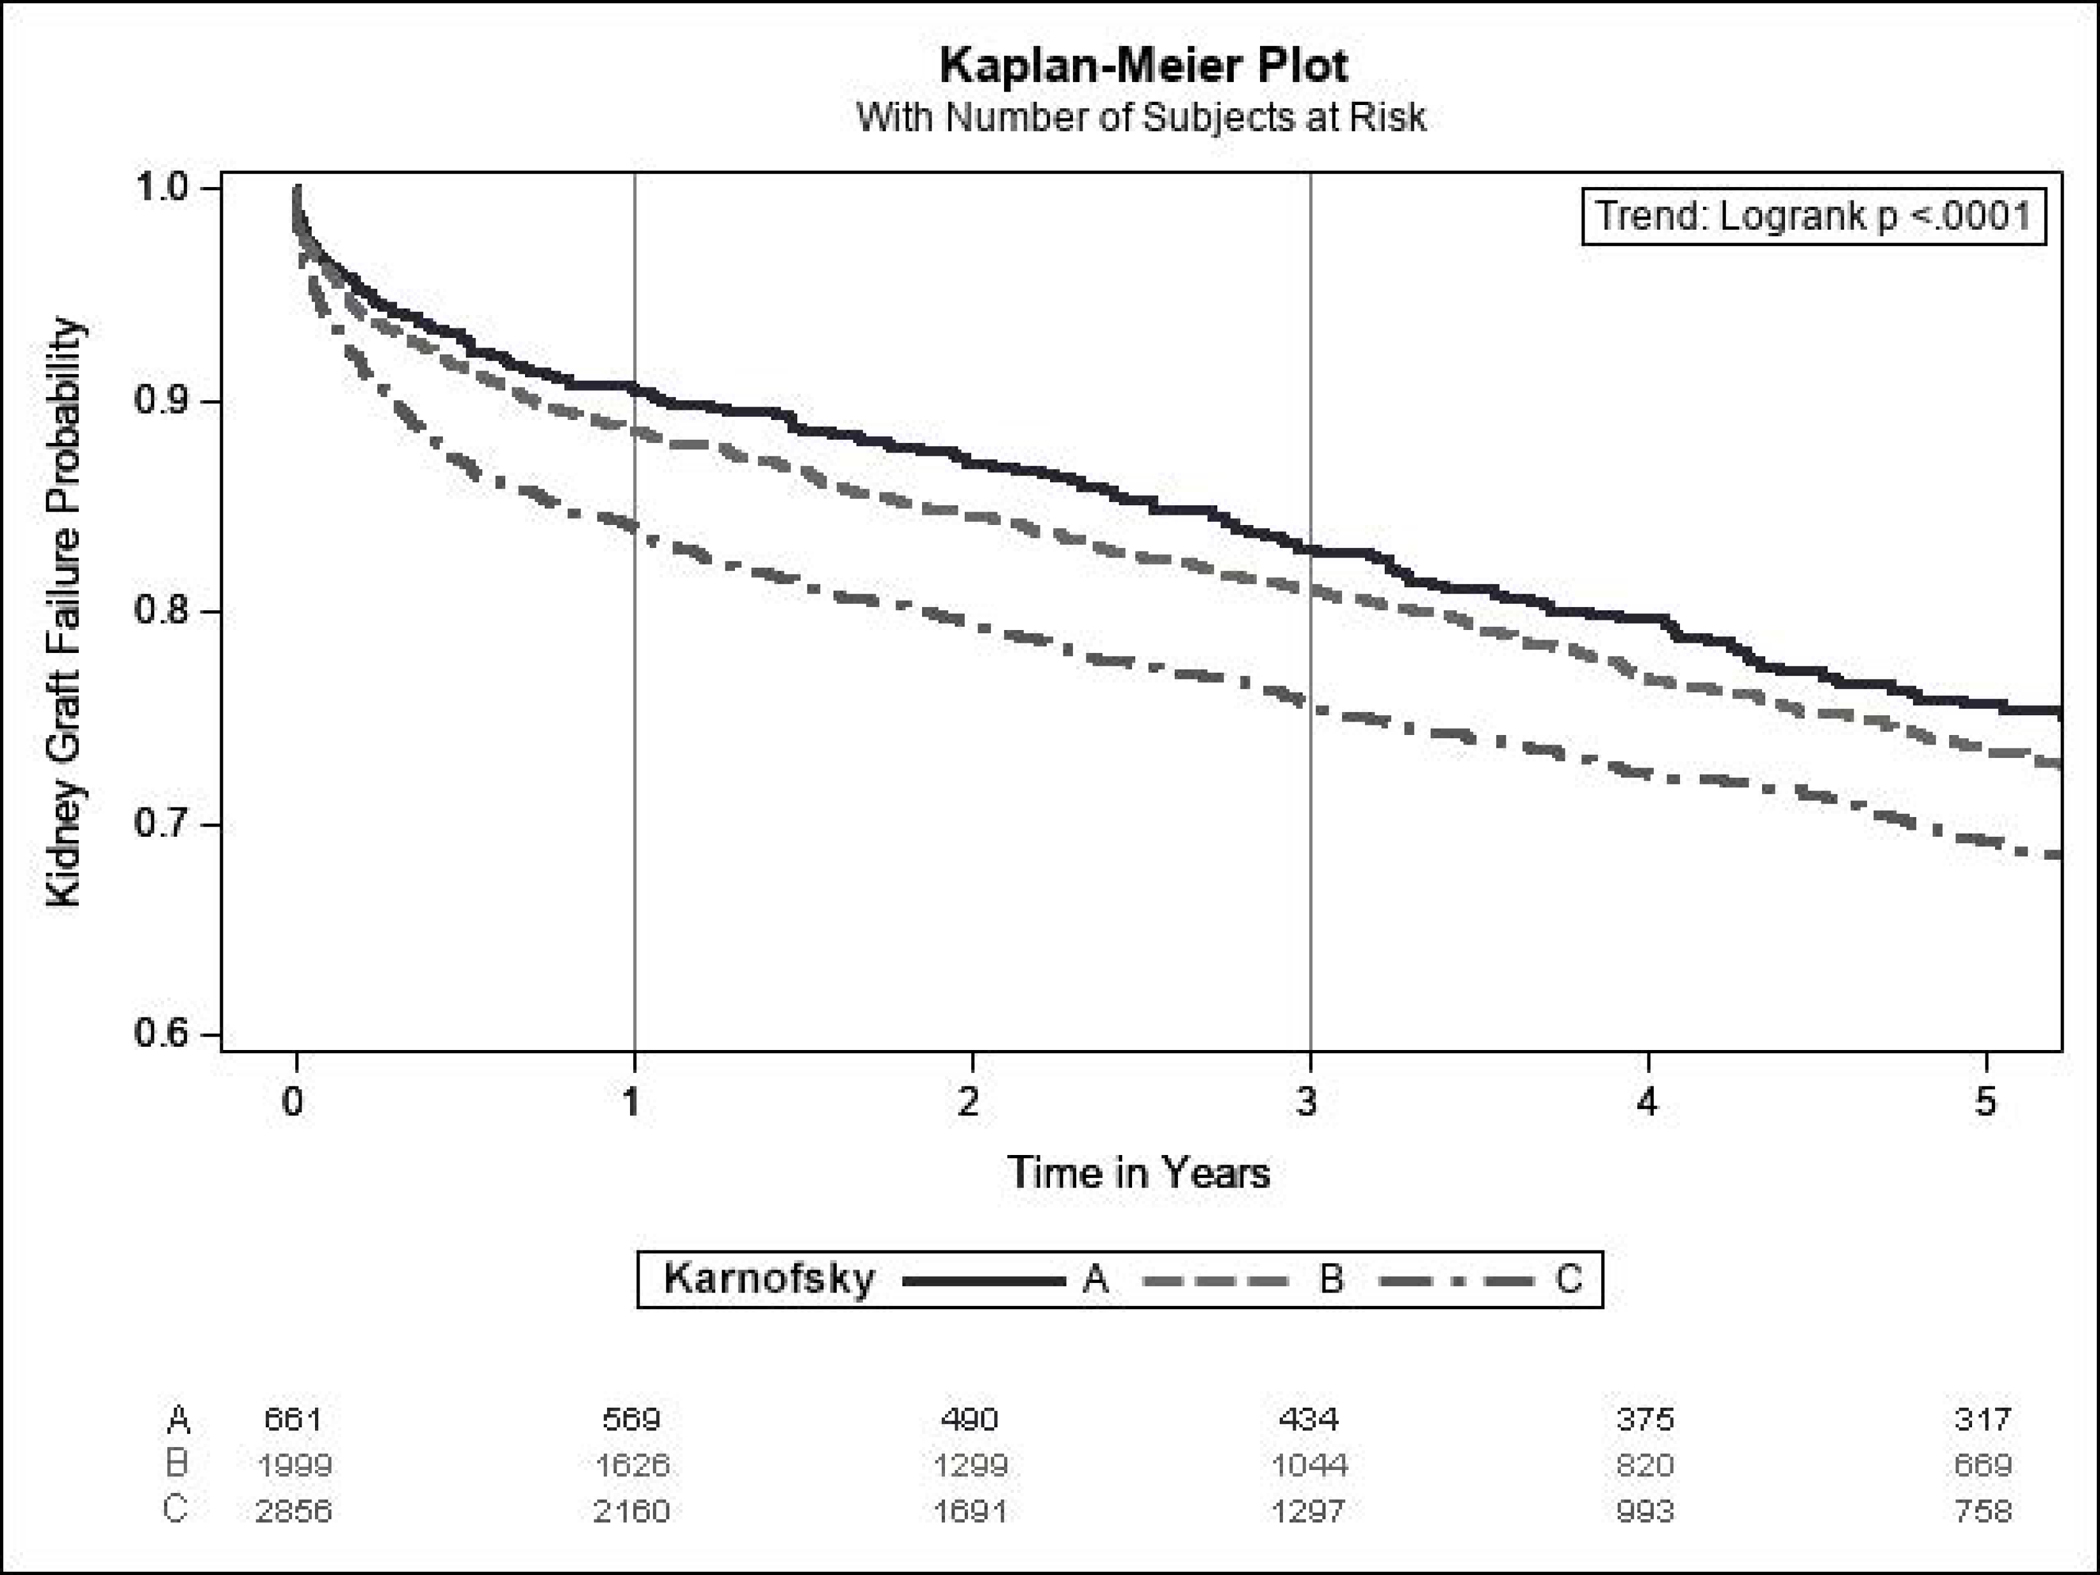
Kaplan-Meier Estimates for (A) Patient Survival, (B) Liver Graft Survival, and (C) Kidney Graft Survival Among SLKT Recipients (Cohort 2) According to Karnofsky Performance Status at Transplant
For patients listed with KPS A, there was no significant difference in survival between those who had a stable or improved KPS at transplant compared to those with a worse KPS at transplant (p=0.19) (Supplementary Figure 6). For patients listed with KPS B, those who had a decline in KPS at transplant had significantly worse survival compared to those with a stable KPS (hazard ratio 1.26; 95% CI 1.04–1.53), and there was no difference between those with stable and improved KPS (Supplementary Figure 7). For patients listed with KPS C, there was no significant difference in survival between those with improved KPS at transplant compared to those with stable or worse KPS (p=0.10) (Supplementary Figure 8). Patient and graft survival at 1, 3, and 5 years according to change in KPS from listing to transplant are shown in Supplementary Table 1. Liver and kidney graft survival both showed similar trends as patient survival.
4, Discussion:
In this study of all patients in the US waitlisted for SLKT, we found that poor functional status as measured by KPS is becoming more common and is associated with poor outcomes across the spectrum of transplant care. In patients awaiting SLKT, KPS C was an independent risk factor for waitlist mortality. In SLKT recipients, KPS C was independently associated with longer hospital stay, increased graft failure, and increased mortality. Additionally, patients listed with KPS B with a subsequent decline in functional status had worse post-transplant outcomes.
Over one-third of patients listed for SLKT were unable to provide self-care (KPS C), and the proportion of patients in this group increased over time, comprising nearly 40% of listed patients in 2018. In previous studies of patients awaiting LT only, the proportion with KPS C also increased, but at a much lower absolute prevalence (13%) 16. Similarly, among patients listed for kidney transplant alone, only 4% had KPS C 13. Compared to single organ transplant candidates, the significantly worse functional status among SLKT candidates is expected as these patients bear the burden of combined end-stage organ failure with the resultant sequelae. This high, rising rate of impaired function, together with the increasing numbers of patients requiring SLKT 5, highlights the overall burden that frailty is placing on the transplant community. Further study is urgently needed to better investigate functional status assessment in this population and to develop interventions with a goal of improving functional status and both pre- and post-transplant outcomes.
In waitlisted patients, impaired functional status was independently associated with both mortality and transplant outcomes. Considering these outcomes together in competing risk models, patients with KPS C continued to have an increased risk of death, while the association with transplant was more attenuated, with a loss of statistical significance in the fully adjusted model. These findings suggest that functional status may have a greater influence on waitlist mortality than on the likelihood of transplant, which is not surprising, as transplant programs employ careful patient selection to maximize post-transplant outcomes. Similar findings have also been shown for patients on the LT only waitlist 16. However, it is important to note that the absolute incidence of transplant is greater than death for patients in all KPS groups; once on the waitlist, all patients (including those with KPS C) are more likely to receive a transplant than to die. Presumably, the pre-listing patient selection process identifies patients at higher risk for death who are not suitable for transplant. Studies of frailty in the larger population undergoing transplant evaluation continue to advance our understanding of this vulnerable group, and expansion of the literature to SLKT candidates is important to improve patient care 26–28.
Taking only pre-transplant outcomes into account, KPS would seem to be a factor that could be considered in organ allocation. However, as we have shown, impaired functional status also predicts diminished post-transplant patient and graft survival and prolonged length of hospital stay, similar to data for LT only 20. Therefore, prioritization of patients with impaired functional status for transplant could negatively impact the overall survival benefit of SLKT. Future work focused on the impact of KPS on survival benefit could help to clarify its role and may help to inform the ongoing debate over medical urgency-based vs. survival benefit-based organ allocation 29,30.
In addition to the association of poor outcomes with the KPS assessed at transplant, we also found a significant association between the change in KPS from listing to transplant with post-transplant outcomes. In particular, patients with KPS B at listing (unable to work but able to care for most personal needs) had worse post-transplant patient and graft survival if the performance status had declined by transplant. Others have also demonstrated increased waitlist mortality in patients waitlisted for LT only who have worsening frailty 31. This finding represents an important opportunity to potentially intervene, as intensive physical therapy may slow functional decline in this group and thus improve post-transplant outcomes 32. Notably, KPS B is the largest group of patients listed for SLKT and has continued to rise, suggesting that such interventions may have real impact on a population scale.
This study expands our knowledge of KPS in LT and kidney transplant alone to the growing population of SLKT candidates, with findings similar to prior work 13,16,20,22. Despite the importance of this work, we acknowledge several limitations. In 2017, changes were made to the SLKT organ allocation policy to better define clear criteria for SLKT and to allow for a “safety net” for recipients of LT alone with advanced post-transplant renal dysfunction 33. It is unclear whether our findings will apply to the safety net population who receive both liver and kidney transplants at separate times. KPS is an imperfect metric for assessing frailty, and is hampered by subjectivity and inter-rater variability. However, it is quick, intuitive, and inexpensive, and has therefore been recommended in clinical practice guidelines for staging frailty in LT candidates 14. Transplant registry data from UNOS lacks granularity and does not allow us to assess more objective measures of frailty. Expanding this work to other measures of frailty (such as the Liver Frailty Index) may further validate these findings. In contrast, the study has numerous strengths, including a very large and comprehensive sample size that captures the true landscape of SLKT in the US over the study period.
This is the first study to our knowledge assessing frailty in SLKT using KPS. We found that frailty is associated with poor outcomes in SLKT in both the pre- and post-transplant settings and that the numbers of patients waitlisted patients with impaired functional status is on the rise. More research is needed to understand frailty in a population that bears the burden of multiple organ failures. In particular, work is needed to validate other frailty assessment tools in SLKT candidates and recipients and to test interventions to prevent further decline in patients with moderately impaired functional status.
Supplementary Material
Abbreviations:
- BMI
body mass index
- CI
Confidence interval
- IQR
Interquartile range
- KPS
Karnofsky performance status
- LT
Liver transplant
- MELD
Model for End-Stage Liver Disease
- SLKT
simultaneous liver-kidney transplantation
References:
- 1.Mantovani A, Zaza G, Byrne CD, et al. Nonalcoholic fatty liver disease increases risk of incident chronic kidney disease: A systematic review and meta-analysis. Metabolism. 2018;79:64–76. doi: 10.1016/j.metabol.2017.11.003 [DOI] [PubMed] [Google Scholar]
- 2.Ginès P, Schrier RW. Renal Failure in Cirrhosis. N Engl J Med. 2009;361(13):1279–1290. doi: 10.1056/NEJMra0809139 [DOI] [PubMed] [Google Scholar]
- 3.Russ KB, Stevens TM, Singal AK. Acute Kidney Injury in Patients with Cirrhosis. J Clin Transl Hepatol. 2015;3(3):195–204. doi: 10.14218/JCTH.2015.00015 [DOI] [PMC free article] [PubMed] [Google Scholar]
- 4.Younossi ZM, Stepanova M, Afendy M, et al. Changes in the prevalence of the most common causes of chronic liver diseases in the United States from 1988 to 2008. Clin Gastroenterol Hepatol Off Clin Pract J Am Gastroenterol Assoc. 2011;9(6):524–530.e1; quiz e60. doi: 10.1016/j.cgh.2011.03.020 [DOI] [PubMed] [Google Scholar]
- 5.Kwong A, Kim WR, Lake JR, et al. OPTN/SRTR 2018 Annual Data Report: Liver. Am J Transplant Off J Am Soc Transplant Am Soc Transpl Surg. 2020;20 Suppl s1:193–299. doi: 10.1111/ajt.15674 [DOI] [PubMed] [Google Scholar]
- 6.Fried LP, Tangen CM, Walston J, et al. Frailty in older adults: evidence for a phenotype. J Gerontol A Biol Sci Med Sci. 2001;56(3):M146–156. doi: 10.1093/gerona/56.3.m146 [DOI] [PubMed] [Google Scholar]
- 7.Lai JC, Feng S, Terrault NA, Lizaola B, Hayssen H, Covinsky K. Frailty Predicts Waitlist Mortality in Liver Transplant Candidates. Am J Transplant. 2014;14(8):1870–1879. doi: 10.1111/ajt.12762 [DOI] [PMC free article] [PubMed] [Google Scholar]
- 8.Carey EJ, Steidley DE, Aqel BA, et al. Six-minute walk distance predicts mortality in liver transplant candidates. Liver Transpl. 2010;16(12):1373–1378. doi: 10.1002/lt.22167 [DOI] [PubMed] [Google Scholar]
- 9.Derck J, Thelen A, Cron D, et al. Quality of Life in Liver Transplant Candidates: Frailty Is a Better Indicator Than Severity of Liver Disease. Transplantation. 2015;99(2):340–344. doi: 10.1097/TP.0000000000000593 [DOI] [PubMed] [Google Scholar]
- 10.Raveh Y, Livingstone J, Mahan J, et al. Comprehensive Frailty Severity Index for End-Stage Liver Disease Predicts Early Outcomes After Liver Transplantation. J Parenter Enter Nutr. Published online November 8, 2019:jpen.1729. doi: 10.1002/jpen.1729 [DOI] [PubMed] [Google Scholar]
- 11.Fozouni L, Mohamad Y, Lebsack A, Freise C, Stock P, Lai JC. Frailty Is Associated With Increased Rates of Acute Cellular Rejection Within 3 Months After Liver Transplantation. Liver Transplant Off Publ Am Assoc Study Liver Dis Int Liver Transplant Soc. Published online October 26, 2019. doi: 10.1002/lt.25669 [DOI] [PMC free article] [PubMed] [Google Scholar]
- 12.Tapper EB. Frailty and Outcomes After Liver Transplantation. Curr Transplant Rep. 2019;6(1):1–6. doi: 10.1007/s40472-019-0222-4 [DOI] [PMC free article] [PubMed] [Google Scholar]
- 13.Sheshadri A, Cullaro G, Johansen KL, Lai JC. Association of Karnofsky Performance Status with Waitlist Mortality among Older and Younger Adults Awaiting Kidney Transplantation. Clin Transplant. Published online February 28, 2020. doi: 10.1111/ctr.13848 [DOI] [PMC free article] [PubMed] [Google Scholar]
- 14.Lai JC, Sonnenday CJ, Tapper EB, et al. Frailty in liver transplantation: An expert opinion statement from the American Society of Transplantation Liver and Intestinal Community of Practice. Am J Transplant Off J Am Soc Transplant Am Soc Transpl Surg. 2019;19(7):1896–1906. doi: 10.1111/ajt.15392 [DOI] [PMC free article] [PubMed] [Google Scholar]
- 15.Karnofsky D, Burchenal J. Evaluation of Chemotherpeutic Agents. N Y NY Columbia Univ. Published online 1949:19. [Google Scholar]
- 16.Orman ES, Ghabril M, Chalasani N. Poor Performance Status Is Associated With Increased Mortality in Patients With Cirrhosis. Clin Gastroenterol Hepatol. 2016;14(8):1189–1195.e1. doi: 10.1016/j.cgh.2016.03.036 [DOI] [PMC free article] [PubMed] [Google Scholar]
- 17.Tandon P, Reddy KR, O’Leary JG, et al. A Karnofsky performance status–based score predicts death after hospital discharge in patients with cirrhosis. Hepatology. 2017;65(1):217–224. doi: 10.1002/hep.28900 [DOI] [PubMed] [Google Scholar]
- 18.Khalid MA, Achakzai IK, Ahmed Khan S, et al. The use of Karnofsky Performance Status (KPS) as a predictor of 3 month post discharge mortality in cirrhotic patients. Gastroenterol Hepatol Bed Bench. 2018;11(4):301–305. [PMC free article] [PubMed] [Google Scholar]
- 19.McCabe P, Wong RJ. More severe deficits in functional status associated with higher mortality among adults awaiting liver transplantation. Clin Transplant. 2018;32(9):e13346. doi: 10.1111/ctr.13346 [DOI] [PubMed] [Google Scholar]
- 20.Thuluvath PJ, Thuluvath AJ, Savva Y. Karnofsky performance status before and after liver transplantation predicts graft and patient survival. J Hepatol. 2018;69(4):818–825. doi: 10.1016/j.jhep.2018.05.025 [DOI] [PubMed] [Google Scholar]
- 21.McCabe P, Galoosian A, Wong RJ. Patients with Alcoholic Liver Disease Have Worse Functional Status at Time of Liver Transplant Registration and Greater Waitlist and Post-transplant Mortality Which Is Compounded by Older Age. Dig Dis Sci. Published online October 22, 2019. doi: 10.1007/s10620-019-05891-1 [DOI] [PubMed] [Google Scholar]
- 22.Thuluvath PJ, Thuluvath AJ, Savva Y, Zhang T. Karnofsky Performance Status Following Liver Transplantation in Patients With Multiple Organ Failures and Probable Acute-on-Chronic Liver Failure. Clin Gastroenterol Hepatol. 2020;18(1):234–241. doi: 10.1016/j.cgh.2019.03.016 [DOI] [PubMed] [Google Scholar]
- 23.Péus D, Newcomb N, Hofer S. Appraisal of the Karnofsky Performance Status and proposal of a simple algorithmic system for its evaluation. BMC Med Inform Decis Mak. 2013;13(1):72. doi: 10.1186/1472-6947-13-72 [DOI] [PMC free article] [PubMed] [Google Scholar]
- 24.Feng S, Goodrich NP, Bragg-Gresham JL, et al. Characteristics associated with liver graft failure: the concept of a donor risk index. Am J Transplant Off J Am Soc Transplant Am Soc Transpl Surg. 2006;6(4):783–790. doi: 10.1111/j.1600-6143.2006.01242.x [DOI] [PubMed] [Google Scholar]
- 25.Jay C, Pugh J, Halff G, Abrahamian G, Cigarroa F, Washburn K. Graft quality matters: Survival after simultaneous liver-kidney transplant according to KDPI. Clin Transplant. 2017;31(5):e12933. doi: 10.1111/ctr.12933 [DOI] [PubMed] [Google Scholar]
- 26.Haugen CE, McAdams-DeMarco M, Holscher CM, et al. Multicenter Study of Age, Frailty, and Waitlist Mortality Among Liver Transplant Candidates: Ann Surg. Published online January 2019:1. doi: 10.1097/SLA.0000000000003207 [DOI] [PMC free article] [PubMed] [Google Scholar]
- 27.Kulkarni SS, Chen H, Josbeno DA, et al. Gait Speed and Grip Strength Are Associated With Dropping Out of the Liver Transplant Waiting List. Transplant Proc. 2019;51(3):794–797. doi: 10.1016/j.transproceed.2019.01.030 [DOI] [PubMed] [Google Scholar]
- 28.Lai JC, Covinsky KE, Dodge JL, et al. Development of a novel frailty index to predict mortality in patients with end-stage liver disease. Hepatology. 2017;66(2):564–574. doi: 10.1002/hep.29219 [DOI] [PMC free article] [PubMed] [Google Scholar]
- 29.Luo X, Leanza J, Massie AB, et al. MELD as a metric for survival benefit of liver transplantation. Am J Transplant. 2018;18(5):1231–1237. doi: 10.1111/ajt.14660 [DOI] [PMC free article] [PubMed] [Google Scholar]
- 30.Schaubel DE, Guidinger MK, Biggins SW, et al. Survival Benefit-Based Deceased-Donor Liver Allocation. Am J Transplant. 2009;9(4p2):970–981. doi: 10.1111/j.1600-6143.2009.02571.x [DOI] [PMC free article] [PubMed] [Google Scholar]
- 31.Lai JC, Dodge JL, Kappus MR, et al. Changes in frailty are associated with waitlist mortality in patients with cirrhosis. J Hepatol. Published online March 2020:S0168827820301914. doi: 10.1016/j.jhep.2020.03.029 [DOI] [PMC free article] [PubMed] [Google Scholar]
- 32.Williams FR, Berzigotti A, Lord JM, Lai JC, Armstrong MJ. Review article: impact of exercise on physical frailty in patients with chronic liver disease. Aliment Pharmacol Ther. 2019;50(9):988–1000. doi: 10.1111/apt.15491 [DOI] [PubMed] [Google Scholar]
- 33.Miles CD, Westphal S, Liapakis A, Formica R. Simultaneous Liver-Kidney Transplantation: Impact on Liver Transplant Patients and the Kidney Transplant Waiting List. Curr Transplant Rep. 2018;5(1):1–6. doi: 10.1007/s40472-018-0175-z [DOI] [PMC free article] [PubMed] [Google Scholar]
Associated Data
This section collects any data citations, data availability statements, or supplementary materials included in this article.


