

Abstract
Background and Objectives
It is difficult to predict poststroke outcome for individuals with severe motor impairment because both clinical tests and corticospinal tract (CST) microstructure may not reliably indicate severe motor impairment. Here, we test whether imaging biomarkers beyond the CST relate to severe upper limb (UL) impairment poststroke by evaluating white matter microstructure in the corpus callosum (CC). In an international, multisite hypothesis-generating observational study, we determined if (1) CST asymmetry index (CST-AI) can differentiate between individuals with mild-moderate and severe UL impairment and (2) CC biomarkers relate to UL impairment within individuals with severe impairment poststroke. We hypothesized that CST-AI would differentiate between mild-moderate and severe impairment, but CC microstructure would relate to motor outcome for individuals with severe UL impairment.
Methods
Seven cohorts with individual diffusion imaging and motor impairment (Fugl-Meyer Upper Limb) data were pooled. Hand-drawn regions-of-interest were used to seed probabilistic tractography for CST (ipsilesional/contralesional) and CC (prefrontal/premotor/motor/sensory/posterior) tracts. Our main imaging measure was mean fractional anisotropy. Linear mixed-effects regression explored relationships between candidate biomarkers and motor impairment, controlling for observations nested within cohorts, as well as age, sex, time poststroke, and lesion volume.
Results
Data from 110 individuals (30 with mild-moderate and 80 with severe motor impairment) were included. In the full sample, greater CST-AI (i.e., lower fractional anisotropy in the ipsilesional hemisphere, p < 0.001) and larger lesion volume (p = 0.139) were negatively related to impairment. In the severe subgroup, CST-AI was not reliably associated with impairment across models. Instead, lesion volume and CC microstructure explained impairment in the severe group beyond CST-AI (p's < 0.010).
Discussion
Within a large cohort of individuals with severe UL impairment, CC microstructure related to motor outcome poststroke. Our findings demonstrate that CST microstructure does relate to UL outcome across the full range of motor impairment but was not reliably associated within the severe subgroup. Therefore, CC microstructure may provide a promising biomarker for severe UL outcome poststroke, which may advance our ability to predict recovery in individuals with severe motor impairment after stroke.
Up to 80% of individuals have difficulty using their upper limb (UL) early after stroke,1-4 which often persists over the subsequent years.5 Patients frequently ask clinicians, “Will I recover function in my arm and hand?” Answering this question is challenging. Often a bedside examination or simple clinical test is used to estimate long-term outcome.6 Although clinical tests may provide a reliable indicator of outcome in individuals with mild-moderate UL impairment,7 they provide limited insight for individuals with severe impairment with little to no active movement.8,9 It is within the severe subgroup where neuroimaging-based biomarker(s) of outcome may have greatest effect on prognostic models.
The Stroke Recovery and Rehabilitation Roundtable (SRRR) taskforce defined a biomarker as a measure of underlying anatomical structure or physiologic processes that may be difficult to measure directly in humans but could be used to understand outcomes.6 This taskforce identified indices of corticospinal tract (CST) function or structure as the only clinical trial ready biomarker for the motor system. Although recent preliminary evidence suggests that indexing CST function is a promising indicator of outcome, there are reasons to expect that no single biomarker will perform equally well across all strata of disease severity. In particular, individuals with severe motor impairment present unique challenges for CST-based biomarkers due to floor effects.9 Function of the CST is commonly indexed as a binary outcome (motor evoked potential positive, MEP+, or negative, MEP−), which makes it difficult to develop a nuanced understanding of outcome. A systematic review that analyzed individual participant data10 demonstrated that while MEP status (MEP+ vs MEP−) was associated with severe UL impairment, there was a high degree of variability in outcome in the severe impairment subgroup (Fugl-Meyer UL [FM-UL], severe = ≤3011). Since this review, there have been few studies exploring candidate biomarkers in a large sample of participants with severe UL impairment (e.g., PREP29 included n = 39 participants with severe impairment).
Indexing CST microstructure using diffusion tensor imaging (DTI) can provide a continuous measure to understand motor impairment.12 CST microstructure has been used to quantify asymmetry between the ipsilesional and contralesional hemispheres8 or characterize lesion load (overlap between CST and stroke lesion).13 Past work has shown modest correlations between CST microstructure and motor outcomes13 but did not examine the severe cohort separately. An individual participant data review of only individuals with severe motor impairment demonstrated no relationship between CST asymmetry and motor outcome.10 Given the lack of validated biomarkers of severe UL motor impairment, it is important to evaluate alternative biomarkers in large cohorts of stroke survivors.
There is a growing appreciation that pathways beyond CST may advance our understanding of motor outcome poststroke.14,15 Exploration of secondary motor pathways was identified by the SRRR taskforce as a developmental priority for biomarker research.6 The role of association sensorimotor cortices has been considered,16,17 but this work was predominantly in individuals with mild-moderate motor impairment. Other preliminary candidate biomarkers considered by the SRRR taskforce were corpus callosum (CC) pathways.18 The CC is a large white matter structure that can be reliably indexed with DTI.19 There is growing evidence to suggest that CC microstructure relates to motor outcome, particularly in the chronic phase of recovery.20-22 Individuals with more extensive damage to the ipsilesional CST may rely more heavily on contributions from the contralesional hemisphere,23 increasing the relevance of CC microstructure in the severe subgroup. Previous work demonstrated that CC microstructure, particularly in the prefrontal subregion, was correlated with UL impairment in participants with moderately severe18 to severe22 impairment. Importantly, this region seemed to explain unique variance beyond the CST in individuals with severe UL impairment poststroke.22 These findings suggest that the CC may be a candidate biomarker of severe UL impairment.
Previous biomarker studies in stroke recovery have been small and preferentially favored enrolment of individuals with mild-moderate motor impairment in the chronic stage of recovery. Collection of a large, longitudinal neuroimaging data set that starts early poststroke is costly in time and resources. To consider candidate biomarkers rigorously before such an endeavor, we collaborated with an international, multisite group of investigators to retrospectively establish a large sample of individuals with clinically severe UL impairment to complete a hypothesis-generating observational study. Our aims were to determine if: (1) CST asymmetry index (CST-AI) can differentiate between individuals with mild-moderate and severe UL impairment and (2) other candidate DTI biomarkers relate to UL motor outcome in individuals with severe impairment poststroke. Based on previous work,18,22 we hypothesized that CST-AI would differentiate between mild-moderate and severe motor impairment, but CC microstructure would relate to motor outcome for individuals with severe UL motor impairment.
Methods
Standard Protocol Approvals, Registrations, and Patient Consents
Ethical approval (H15-00083/H09-00368/H11-03233/H13-01896/IRB00072542/REB15-1340/2004-3852/2017-4067/Pro00032516) was received to collect each of the original cohort data, which included provision for data sharing. eTable 1 (links.lww.com/WNL/C28) contains institutional review boards and approval numbers for each cohort. Written informed consent was obtained from all participants.
Participants
We approached a convenience sample of 7 principal investigators (6 agreed) who had DTI data to share that met the following eligibility criteria: adults (≥18 years) at any time-point post an ischemic or hemorrhagic stroke, scanning included DTI and T1-weighted images, and FM-UL scores consistent with severe impairment. In addition, we sought data from one site that met the above criteria, but the FM-UL values were consistent with mild-moderate motor impairment. We defined a priori FM-UL score >30 of 66 as mild-moderate and ≤30 as severe UL impairment. This cutoff is based on a hierarchical cluster analysis (n = 247)11 that was applied in our pilot studies10,22 that informed this study and is consistent with recommendations from experts.24 All scans were performed before any experimental training intervention protocol (i.e., baseline scans). Participants in the chronic phase were not receiving therapy, whereas some participants earlier poststroke may have been receiving usual care, which can be up to 3 h/d in North America.
Cohorts
Cross-sectional data were drawn from 7 clinical and research sites across North America: (1) Centre for Research and Imaging Facility BC Women's and Children's Hospital, and MRI Research Centre University of British Columbia (2) Protocol A and (3) Protocol B, Vancouver, Canada; (4) Emory University, Atlanta; (5) Hotchkiss Brain Institute, University of Calgary, Calgary, Canada; (6) University of California Irvine, Irvine; and (7) University of South Carolina, Columbia. These sites are referred to as cohorts throughout this article. Each cohort included data on demographics (age, sex), stroke-related information (time poststroke, lesion type, lesioned hemisphere), FM-UL scores, and DTI scans. Cohort specific eligibility criteria and imaging protocols are reported in eTables 1 and 2 (links.lww.com/WNL/C28).
Assessment of Motor Impairment
The FM-UL assessment was performed to index UL impairment. This measure consists of 33 items rated on a scale from 0 to 2, totaling a possible 66 points25; higher scores indicate less UL impairment. This is a valid and reliable test that has been recommended by the SRRR taskforce.26 The FM-UL score was administered by a licensed therapist who had undergone training in FM-UL measurement.
Assessment of Neuroimaging Biomarkers
Diffusion Imaging Processing
All investigators contributed raw data that were processed at the University of British Columbia by 2 investigators (K.S.H./J.K.F.) using FMRIB's Software Library (FSL), version 5.0.1,27 and the Diffusion Toolbox. Standard pipelines were used for data preprocessing:
Scans were corrected for motion and eddy current-induced distortions.
Diffusion volumes without a diffusion gradient applied (b0 images) were skull stripped and used to generate a binary brain mask using the Brain Extraction Tool (BET).
Diffusion tensors were fit on eddy-current corrected data using DTIFIT.
Probabilistic tractography preprocessing was performed using BEDPOSTX, modeling diffusion parameters accounting for multiple fiber orientations per voxel.28
Regions of interest (ROIs) were drawn in native DTI space on principle eigenvector maps by a single trained researcher (K.S.H.). Corticospinal tract ROIs were drawn in the axial plane at the level of the base of the corona radiata and in the posterior limb of the internal capsule at the level of the anterior commissure.29,30 If stroke damage prevented identifying the CST on the ipsilesional hemisphere, the ROI was drawn to mirror the contralesional hemisphere. For probabilistic tractography of the CST, the posterior limb of the internal capsule at the level of the anterior commissure was used as a seed and the corona radiata was set as a waypoint to constrain generated tracts. This tractography approach isolating CST tracts superior to the posterior limb of the internal capsule has been previously demonstrated to achieve good discrimination between severe and mild-moderate motor impairment.31 Corpus callosum ROIs were drawn on a single mid-sagittal plane slice.19,22 The CC was manually delineated into 5 subdivisions according to previously defined subdivisions that contain prefrontal (CC1), premotor (CC2), primary motor (CC3), primary somatosensory (CC4), and parietal/temporal fibers (CC5).19 For probabilistic tractography of the CC, each subdivision ROI was used as a seed region. Figure 1 presents 3D rendering of CST tracts, CC tracts, and the CC subdivisions.
Figure 1. Regions of Interest.
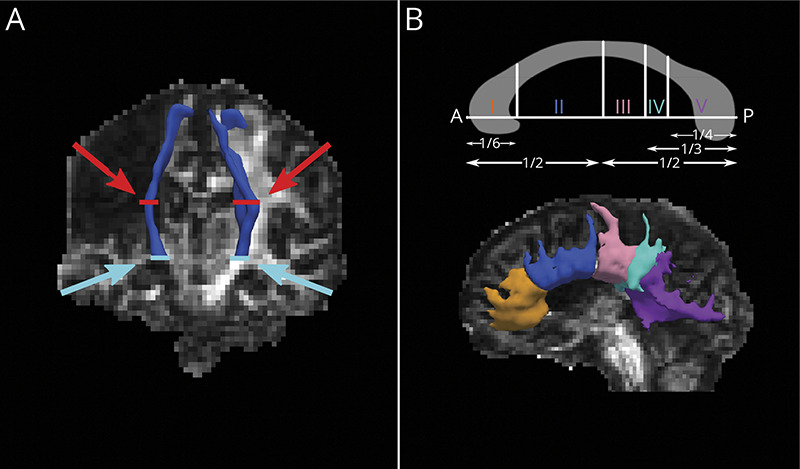
(A) 3D rendering of CST tracts (in blue) over the FA map of an individual with severe upper limb motor impairment. CST ROIs were drawn in the axial plane and are visualized in red at the level of the corona radiata (red arrows) and anterior commissure (blue arrows). (B) Top panel: parcellation scheme for CC subdivisions, according to Hofer & Frahm.19 CC ROIs were delineated based on proportional divisions of the anterior (A) to posterior (P) length of the CC on the midsagittal plane. (B) Bottom panel: 3D rendering of CC tracts derived from corresponding CC ROIs (I: orange, II: blue, III: pink, IV: teal, V: purple), visualized over the FA map of the same individual with severe upper limb motor impairment. CC = corpus callosum; CST = corticospinal tract; FA = fractional anisotropy; ROIs = regions of interest
Probabilistic tractography was performed separately for the CST and each of the 5 CC ROIs. For all tracts, probabilistic tractography was generated with 5,000 streamlines from the seed ROI with a curvature threshold of 0.2. The resulting tracts had a threshold applied (at 10% of total streamlines) and were subsequently binarized. The mean fractional anisotropy (FA) was extracted from probabilistic tractography masks.
To compute the CST-AI, the following calculation was performed:
 |
CST-AI provides a continuous index of estimated CST damage such that values closer to 1 indicate less symmetric CST FA (i.e., lower ipsilesional CST FA relative to contralesional CST), whereas values closer to 0 indicate symmetric FA between contralesional and ipsilesional CST. A negative value would indicate higher FA in the ipsilesional hemisphere than the contralesional hemisphere. If mean FA could not be extracted for the ipsilesional CST FA, the CST-AI was imputed as 1 to indicate high asymmetry between the ipsilesional contralesional hemispheres.
Stroke Lesion Masking
All investigators contributed stroke lesion masks which were manually drawn on structural T1-weighted (cohorts 3/5/6) or T2-weighted scans (cohorts 1/2/7), or semiautomatically generated through the Lesion Identification with Neighborhood Data Analysis (LINDA) toolkit31 (cohort 4). All lesion masks were visually inspected for consistency by a single experimenter (J.K.F.). Lesion volumes were calculated in subject-native space; LINDA-generated masks were back-projected to subject-native space (T1 space) before calculating lesion volumes. Structural scans were skull-stripped using BET. For individuals with large cortical lesions, stroke masks were filled with a voxel intensity corresponding to grey matter intensity to allow BET to accurately identify the outline of the brain. All BET skull strips were visually checked for accuracy by a single researcher (J.K.F.), and brain mask volumes were exported for each participant. Lesion volumes were normalized by total masked brain volumes (normalized lesion volume = lesion volume/brain mask volume *100) to account for intrasubject variability in brain size. To generate lesion overlap figures, all lesion masks were nonlinearly registered to Montreal Neurological Institute (MNI) MNI152 1 mm space using FSL's FNIRT.32 Quality of MNI registrations was verified (J.K.F.).
Statistical Analysis
Statistical analyses were conducted through a series of linear mixed-effects models in R V4.0.4.33-35 Missing data due to excessive head motion or CC streamlines that were unable to be generated were excluded from all models. Details of each model are presented as introduced in the Results section. Broadly, each model included the covariates of age (years), sex (male or female), normalized lesion volume (mL), and time from stroke to testing (days). We have not performed correction for multiple comparisons, given the hypothesis-generating nature of this study, and view the cost of false negatives (i.e., missing a promising result) to be especially high in this early phase research.36
Because individual participants were nested within different studies, models also included a random-effect of cohort (a categorical variable ranging from 1 to 7, indicated the study from which data were collected). Including this random-effect of cohort allows fair comparison of participants from different study sites that differed in their protocols, scanners, etc. Although formal effects of these between-sites factors were not included in the models, they are represented as a source of error in the random-effects. All models were estimated using full maximum likelihood to allow comparisons between nested models. Parameters were chosen based on bivariate plots of the data. To reduce the number of statistical tests, curvilinear/nonlinear effects were only included when there was clear evidence of a nonlinear pattern. The only variable that showed a nonlinear pattern was poststroke days; hence, the log of poststroke days is included as a covariate rather than a linear effect of poststroke days. Models were compared using Akaike's Information Criterion (AIC). The AIC is a measure of deviance (i.e., model fit) that also introduces a penalty for additional parameters to reduce overfitting and improve the generalizability of the model.37 Statistical significance of factors within a model used the Welch-Satterthwaite approximation of the degrees of freedom.35 See eAppendices 1.1–2.5 (links.lww.com/WNL/C28) for detailed statistical outputs of all models.
Data Availability
Available upon reasonable request.
Results
We included 116 individuals with stroke (n = 31 mild-moderate, n = 85 severe). Three participants had missing DTI data in specific regions (n = 1 CC1 to CC5, n = 1 CC3, n = 1 CC4) due to failure to generate probabilistic tractography streamlines secondary to lesion involvement. In addition, 3 cases were excluded because of excessive head motion, leading to poor quality scans. This resulted in 6 exclusions (5%; n = 1 mild-moderate, age 64 years, FM-UL = 56; n = 5 severe, age median 51 years, FM-UL median 25), which left 110 individuals with stroke (n = 30 mild-moderate, n = 80 severe). The interval between DTI and FM-UL collection was a median 0 days (mild-moderate median 0, interquartile range 0–0; severe median 0, interquartile range 0–7). As summarized in Table 1, severely impaired participants were younger, earlier poststroke, had a larger lesion volume, and higher CST-AI compared with mild-moderately impaired participants (indicating lower ipsilesional FA relative to contralesional FA). See eTable 1 (links.lww.com/WNL/C28) for cohort-level demographics.
Table 1.
Demographics for Participants Included in Statistical Analyses

Lesions are visualized in MNI space in Figure 2, separately for mild-moderate and severe subgroups. Some of our participants (n = 5 mild/moderate, n = 5 severe) had small contralesional infarcts in addition to the primary stroke infarct. These may be true bilateral strokes, covert lacunar infarcts, or small infarcts that occurred after the primary stroke infarct. For participants with bilateral infarcts, the side of the brain contralesional to the impaired UL was considered the ipsilesional hemisphere.
Figure 2. Stroke Lesion Overlap.
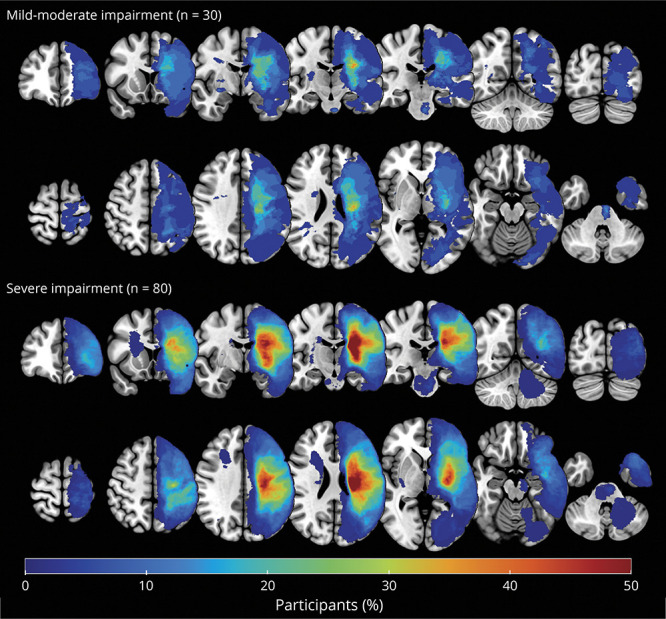
Lesion overlap figure of stroke lesions for the mild-moderate (top panel, n = 30) and severe (bottom panel, n = 80) impairment subgroups. For visualization, all symptomatic strokes were flipped to the left hemisphere for visualization over the MNI 152 T1 template. Color bar indicates the percentage of participants within each subgroup with lesion in this voxel, with blue indicating few participants with overlapping lesions and red indicating multiple participants with overlapping lesions.
Relationship Between UL Impairment and CST Microstructure
CST-AI was positively associated with impairment on average across all participants, b = −17.81, SE = 4.33, p < 0.001, after accounting for age, time poststroke, and sex. This indicates that individuals with more severe motor impairment (lower FM-UL scores) had higher CST-AI (lower ipsilesional CST FA relative to contralesional CST FA). Corpus callosum integrity was negatively associated with impairment, with greater fractional anisotropy associated with higher FM-UL scores, although the strength of this association varied by CC region (i.e., CC1: b = 75.05, SE = 26.73, p = 0.006; CC2: b = 62.56, SE = 19.25, p = 0.001; CC3: b = 54.62, SE = 22.96, p = 0.019; CC4: b = 41.59, SE = 24.74, p = 0.096; CC5: b = 56.34, SE = 21.78, p = 0.011); see eAppendices 1.1–2.5 (links.lww.com/WNL/C28) for model details. It is of interest that lesion volume was not significantly associated with impairment, b = −0.21, SE = 0.29, p = 0.474, controlling for the other variables in the model. These patterns emerge when the entire spectrum of impairment is considered, but the patterns change when stratified by subgroup (Figure 3). Toward the aim of identifying specific biomarkers for subgroups of motor impairment, in the subsequent sections, we compare the mild/moderate and severe subgroups with each other and then consider the severe subgroup in isolation.
Figure 3. Imaging-Behavior Relationships Differ Between Severe vs Mild-Moderate Impairment Subgroups.
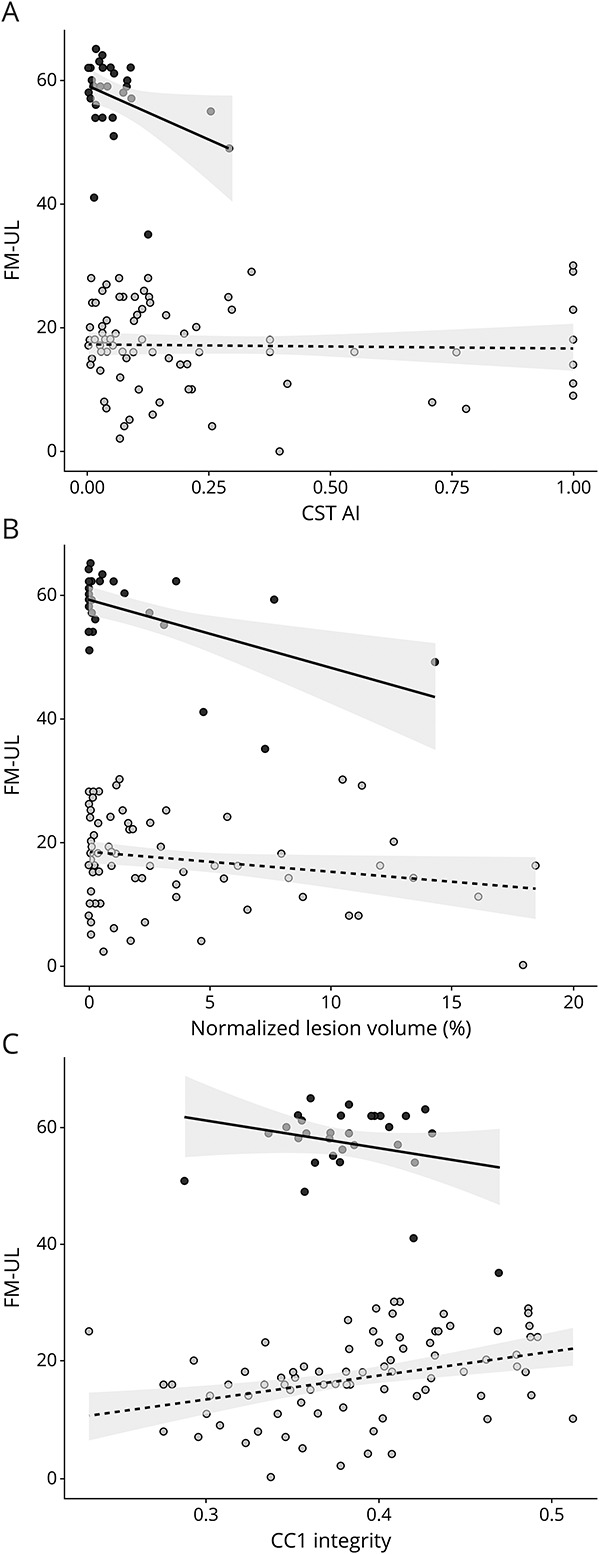
Fugl-Meyer Upper Limb (FM-UL) scores as a function of (A) corticospinal tract asymmetry index (CST-AI), (B) normalized lesion volume, and (C) integrity of the anterior corpus callosum (CC1 fractional anisotropy) in the mild-moderate and the severely impaired subgroup. Black dots indicate participants with mild-moderate impairment; light grey dots indicate participants with severe impairment. Lines indicate the ordinary least squares regression fit within each group, and the shaded area shows the 95% CI.
Increased Heterogeneity in Neuroanatomical Measures in Severely Impaired Individuals
Means and SDs for specific measures are given in Table 1, and the data are shown in Figure 4. Across measures, there was a general trend for increased neuroanatomical variability in the severely impaired participants relative to the mild-moderately impaired participants. Levene's test of heterogeneity showed that the difference in the variance between subgroups was not statistically significant for the FM-UL, F(1,108) = 2.13, p = 0.147, or normalized lesion volume, F(1,108) = 2.89, p = 0.090. However, there was greater variability in the severe subgroup for CST-AI, F(1,108) = 10.5, p < 0.001; CC1, F(1,108) = 11.25, p < 0.001; CC2, F(1,108) = 10.45, p = 0.002; CC3, F(1,108) = 13.48, p < 0.001; CC4, F(1,108) = 8.90, p = 0.004; and CC5, F(1,108) = 7.13, p = 0.009. Thus, variability between participants was not reliably different for behavioral or volumetric measures. However, across all white matter tract measures, there was significantly greater between-person variability among individuals with severe impairment.
Figure 4. Between-Group Differences in Behavior and Imaging Measures.

Fugl-Meyer Upper Limb (FM-UL) scores, corticospinal tract asymmetry index (CST-AI), normalized lesion volume, and corpus callosum (CC) microstructure across 5 compartments (CC1 through CC5 fractional anisotropy, from anterior to posterior) by group (mild-moderate vs severe). Black bars represent the mean of the data. *Denotes p < 0.05 on Levene's test of homogeneity of variance.
Effects of Lesion Volume and White Matter Tract Microstructure in Severely Impaired Individuals
Above and beyond CST-AI, lesion volume, and the other covariates, FM-UL scores were statistically significant and positively related to CC1, b = 40.57, SE = 14.29, p = 0.006; CC3, b = 31.74, SE = 11.96, p = 0.010; CC4, b = 34.61, SE = 12.94, p = 0.009; and CC5, b = 42.08, SE = 11.73, p < 0.001. Although positive, the relationship was not statistically significant for CC2, b = 18.61, SE = 10.66, p = 0.085. These relationships are shown in Figure 5, and full details of these models are given in Table 2.
Figure 5. Severe Upper Extremity Impairment and Corpus Callosum Microstructure.

Fugl-Meyer Upper Limb (FM-UL) scores among severely impaired individuals as a function of corpus callosum (CC) microstructure across the 5 different compartments of the CC (CC1 through CC5 fractional anisotropy, from anterior to posterior). Shaded regions reflect the 95% CI for the linear model for each CC region.
Table 2.
Parameter Estimates for Associations Between FM Scores and Neuroimaging Variables Among Severely Impaired Participants
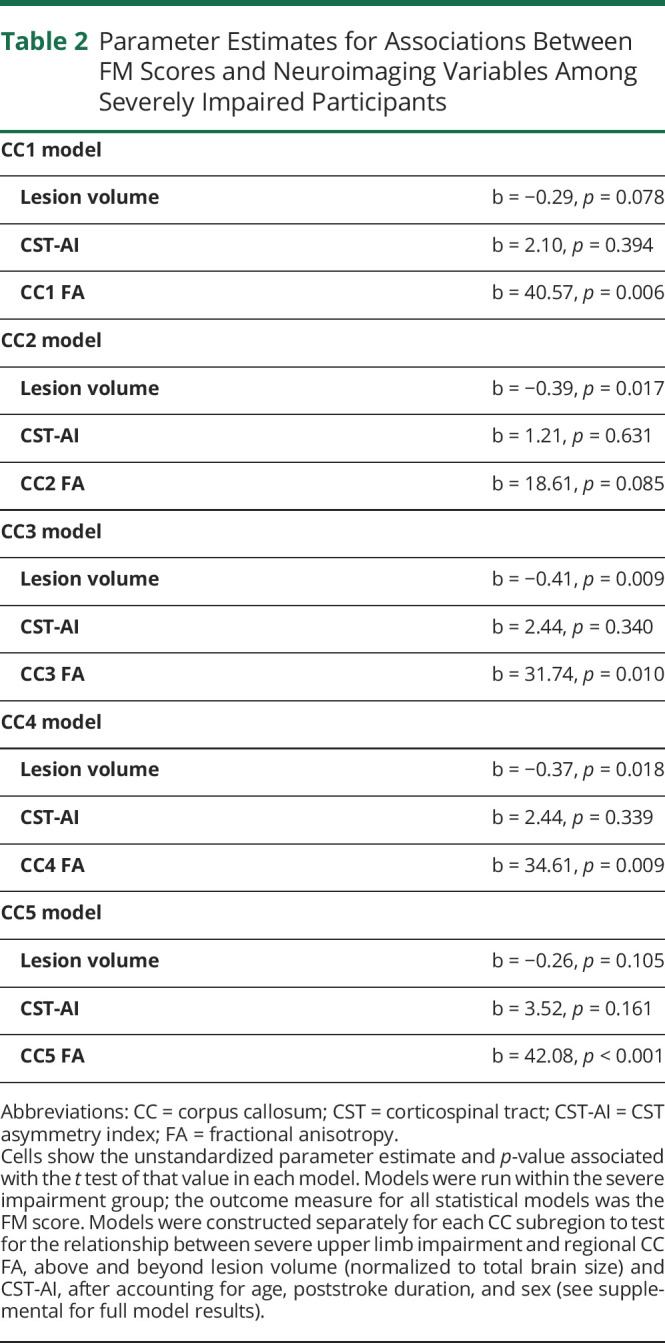
Across the different models for the different regions of the CC, there was generally evidence for a negative effect of lesion volume and nonsignificant effect of CST-AI (Table 2). The variation from model to model (or the changes from the model that did not include the CC) are due to different levels of collinearity between these neuroanatomical measures. For bivariate correlations between all neuroimaging measures, see eFigure 1 (links.lww.com/WNL/C28). Within linear mixed-effects models, age, poststroke duration, and sex did not significantly relate to FM-UL scores in any tested model; see eAppendices 1.1–2.5 for full model outputs.
Discussion
This hypothesis-generating observational study is the result of an international collaborative effort to identify candidate neuroimaging biomarkers specific to severe UL motor outcome poststroke. Consistent with previous research,8,9 in our data, CST-AI was related to motor impairment across the whole sample (mild-severe) such that individuals with mild impairment had less asymmetry in ipsilesional vs contralesional CST-FA. However, in a subgroup analysis, CST-AI was not related to motor outcome for the severe subgroup; instead, CC subregion microstructure (FA) significantly related to individual differences in severe motor impairment such that individuals with less severe motor impairment had higher FA in CC subregions. These data suggest CST microstructure alone because a biomarker limits our ability to account for variability in outcomes within severely impaired individuals.38
Individuals with severe UL motor impairment show a distinct neuroanatomical phenotype compared with individuals with mild-moderate UL impairment. Included individuals with severe stroke had larger lesion volumes and greater hemispheric asymmetry in CST microstructure compared with individuals with mild-moderate motor impairment. Furthermore, individuals with severe motor impairment showed greater variability in microstructural integrity for all the white matter regions we tested (CST and 5 subregions of the CC). The greater heterogeneity in FA in the severe subgroup might indicate that there are multiple neuroanatomical “pathways” to severe motor outcome. Assessing damage to white matter pathways beyond the CST is important to capture this heterogeneity in brain structure of individuals with severe impairment after stroke. This underscores the utility of DTI-derived biomarkers in this population because it provides a continuous metric (FA) that shows greater between-subject variability than lesion volume. Furthermore, DTI allows interrogation of individual tract anatomy, which gives the advantage of region-specific assessments of damage, rather than a global measure such as lesion volume.10 Recent findings using preclinical models of poststroke forelimb motor impairment highlight the importance of both lesion size and location in explaining variability in motor recovery.39 Future work should consider how factors such as time since stroke, and lesion size, location, and region-specific white matter microstructure interact longitudinally with motor outcome.
Previous work18,20 had demonstrated some relationships between CC FA and motor outcome in individuals with mild to severe upper extremity impairment after stroke. We also found an association across the spectrum of motor impairment but importantly identified that CC may uniquely mediate processes of recovery for individuals with severe impairment (FM-UL ≤ 30) after stroke. Relative to previous work, our study specifically focused on severe impairment and included a large sample with low FM-UL scores (i.e., <10) who have been historically neglected in stroke research.40 These findings highlight that with profound loss of descending ipsilesional CST projections, the contralesional hemisphere may become a site of compensatory motor output after stroke,41 perhaps by capitalizing on existing bilateral connectivity.42 For example, there is evidence that lower FA in the CST and CC correlates with greater bilateral activity in the motor cortices in response to unilateral movements of the paretic UL.43
Transcallosal motor projections have previously been implicated in stroke recovery by the interhemispheric competition model. This model arose from transcranial magnetic stimulation findings that showed an increase in inhibition from the contralesional hemisphere to the ipsilesional hemisphere in individuals with poorer motor outcomes.44 However, more recent data suggest that this model does not hold true for individuals with severe stroke.45 In individuals with severe, but not mild-moderate impairment, increasing excitability in the contralesional hemisphere may improve UL function46 and inhibition of the contralesional hemisphere can worsen outcome.23 These data suggest that the contralesional hemisphere may contribute to motor recovery in individuals with severe motor impairment and profound CST damage. In our sample, higher CC FA was associated with better outcome in the severe subgroup. As such, the CC might act as a compensatory pathway that mediates contralesional contributions to motor output after damage to the ipsilesional CST. The degree to which transcallosal projections provide meaningful contributions to motor recovery in severe stroke needs to be evaluated in future studies.
A surprising finding in our study was that multiple regions of the CC were related to motor impairment, extending beyond CC subregions with known roles in motor function. Our previous work found that CC1 FA was related to FM-UL in severely impaired individuals to a greater degree than CC2 or CC3.22 Furthermore, FA from CC1 related to motor impairment above CST-AI and CC2/CC3 in a subgroup of moderate-severely impaired individuals.18 We have previously interpreted these findings to indicate a reliance on prefrontal pathways to mediate recovery in individuals with severe impairment. However, in these previous studies we did not test contributions from CC4 or CC5. In this study, CC1, CC3, CC4, and CC5 correlated with motor impairment. This raises the question of whether relationships between CC microstructure and motor impairment reflect transcallosal contributions specific to anatomic regions serving motor function or rather if this finding suggests that overall health of brain white matter is an indicator of recovery potential in individuals with severe stroke.
There are potential explanations for the finding of widespread associations between CC microstructure and severe motor outcome. First, individuals with severe stroke had larger stroke lesions than the mild-moderate subgroup, which spanned a greater extent of the cortex. Thus, more CC fibers may have been directly lesioned in the severe subgroup. One previous study found that CC FA related to motor impairment only for individuals with lesion involvement in CC fibers.47 However, in our study, CC FA explained variance in motor impairment over and above lesion volume and CST-AI, suggesting an independent explanatory component of CC microstructure to severe outcome. In addition, in the present sample, CC FA was significantly different between mild-moderate and severely impaired subgroups in CC3 (motor) and CC4 (somatosensory); subregions expected to be directly affected by the stroke lesion. CC1, CC2, and CC5 did not have significantly lower FA in the severe subgroup. Future research should assess whether lesion location is a mediator of relationships between CC FA and outcome in individuals with severe motor impairment after stroke. The second possibility is that concurrent white matter disease with aging and cerebrovascular disease leads to degemination in white matter disease in transcallosal pathways.48 Previous DTI work has found that age-related white matter disease is associated with decreased FA in both the frontal (CC1) and posterior (CC5) poles,49 which may explain the contribution of these “nonmotor” CC regions to severe outcomes in this study. This suggests individual variability in the structural reserve of the brain may be at play; it is possible that overall health of white matter in the brain before a severe stroke affect the brain's recovery capacity.
Our collaboratively developed data set–reduced research “waste” and provided proof-of-principle evidence for an emerging research direction. We emphasize that these data are cross-sectional and represent a sample of individuals across the spectrum of early subacute to chronic poststroke recovery.50 We acknowledge that the interval between neuroimaging and clinical assessments in the severe subgroup was variable between cohorts. This was addressed statistically by controlling for cohort. To overcome potential environmental (e.g., competing appointments) and participant (e.g., fatigue) factors that can affect this interval, future studies should prioritize data collection to only key neuroimaging sequences and clinical measures. To affect clinical practice, the current results need to be validated in independent prospective cohorts that longitudinally collect data following individuals from the acute to the chronic phase of recovery. It would also be informative if samples collected categories of data, such as cardiac and metabolic risk factor profiles, and neuroimaging data, such as T2-weighted image, to investigate the role of age-related white matter disease in stroke recovery. Such data might collectively suggest the utility of routinely including these data in prognostic models. The data analyzed were collected on different scanners and with different acquisition parameters. To address this, we included cohort as a random-effect in our models to allow fair comparison of participants from different studies. We do not have neurophysiologic data to characterize CST function through MEPs using transcranial magnetic stimulation. Future studies should include both structural imaging and neurophysiologic data to evaluate the agreement and relative contribution of different biomarkers to severe UL impairment. Although evaluating for potential differences between men and women is important, we were not powered to detect interactions by sex. We did not have access to measures of UL strength, activity, or participation. Given FM-UL is highly correlated with such measures,51 it is likely that current findings regarding UL motor impairment extend to such additional dimensions of stroke outcome. Future should consider measures of everyday living using outcomes such as accelerometers to capture real-world use. Finally, for individuals who were in the subacute phase of recovery poststroke, we cannot know whether motor recovery was achieved later poststroke.
Our findings from the largest cohort to date of individuals with severe motor impairment suggest that the CC may be a biomarker of severe motor outcome after stroke. Our data advance insights into theoretical models of stroke recovery in the presence of profound loss of CST projections by implicating a role of CC pathways in severe stroke recovery. Stroke is a very heterogeneous condition. Biomarkers of UL outcome after stroke may be affected by distinct neurologic phenotypes between individuals presenting with different levels of motor impairment. This study supports a subgroup-based approach to the development of biomarkers to better understand outcome after stroke. In an era of precision medicine, our data indicate the feasibility of developing biomarkers that are specific to patient subgroups.
Acknowledgment
The Florey Institute of Neuroscience and Mental Health acknowledges strong support from the Victorian Government and in particular funding from an Operational Infrastructure Support Grant. Coauthor Sonja E. Findlater, PhD, died March 12, 2019.
Glossary
- AIC
Akaike's Information Criterion
- BET
Brain Extraction Tool
- CC
corpus callosum
- CST
corticospinal tract
- CST-AI
CST asymmetry index
- DTI
diffusion tensor imaging
- FA
fractional anisotropy
- FM-UL
Fugl-Meyer UL
- FSL
FMRIB's Software Library
- MEP−
motor evoked potential negative
- MEP+
motor evoked potential positive
- ROIs
regions of interest
- SRRR
Stroke Recovery and Rehabilitation Roundtable
- UL
upper limb
Appendix. Authors
Study Funding
M.R. Borich: NIH K12 HD055931. A. Borstad: AHA-Scientist Development Grant—PI Lynne Gauthier, ALB Co-I. L.A. Boyd: CIHR MOP-106651; Heart and Stroke Foundation of Canada/Centre for Stroke Recovery. J.C. Stewart: NIH R03 HD087481 and American Heart Association 15SDG24970011. J. M. Cassidy: NIH R00 HD091375, T32 AR047752-11A1. S.C. Cramer: NIH grants: K24 HD074722, R01 NS059909. S. Dukelow: CIHR MOP-106662. K.S. Hayward: NHMRC 1088449, MSFHR 11590. S.L. Liew: NIH grants: R01 NR105591, K01 HD091283.
Disclosure
S. C. Cramer serves as a consultant for Abbvie, Constant Therapeutics, MicroTransponder, Neurolutions, SanBio, Fujifilm Toyama Chemical Co., NeuExcell, Elevian, Medtronic, and TRCare. The remaining authors report no disclosures relevant to the manuscript. Go to Neurology.org/N for full disclosures.
References
- 1.Lawrence ES, Coshall C, Dundas R, et al. Estimates of the prevalence of acute stroke impairments and disability in a multiethnic population. Stroke. 2001;32(6):1279-1284. [DOI] [PubMed] [Google Scholar]
- 2.Nakayama H, Jorgensen HS, Rasschou HO, Olsen TS. Recovery of upper extremity function in stroke patients: the Copenhagen Stroke Study. Arch Phys Med Rehabil. 1994;75(4):394-398. [DOI] [PubMed] [Google Scholar]
- 3.Persson HC, Parziali M, Danielsson A, Sunnerhagen KS. Outcome and upper extremity function within 72 hours after first occasion of stroke in an unselected population at a stroke unit. A part of the SALGOT study. BMC Neurol. 2012;12:162. [DOI] [PMC free article] [PubMed] [Google Scholar]
- 4.Simpson L, Hayward KS, McPeake M, Field T, Eng JJ. Challenges of estimating accurate prevalence of arm weakness early after stroke. Neurorehabil Neural Repair. 2021;35(10):871-879. [DOI] [PMC free article] [PubMed] [Google Scholar]
- 5.Meyer S, Verheyden G, Brinkmann N, et al. Functional and motor outcome 5 years after stroke is equivalent to outcome at 2 months: follow-up of the collaborative evaluation of rehabilitation in stroke across Europe. Stroke. 2015;46(6):1613-1619. [DOI] [PubMed] [Google Scholar]
- 6.Boyd LA, Hayward KS, Ward NS, et al. Biomarkers of stroke recovery: consensus-based core recommendations from the stroke recovery and rehabilitation roundtable (SRRR). Int J Stroke. 2017;12(5):480-493. [DOI] [PMC free article] [PubMed] [Google Scholar]
- 7.Winters C, Heymans MW, van Wegen EE, Kwakkel G. How to design clinical rehabilitation trials for the upper paretic limb early post stroke? Trials. 2016;17(1):468. [DOI] [PMC free article] [PubMed] [Google Scholar]
- 8.Stinear CM, Barber PA, Petoe M, Anwar S, Byblow WD. The PREP algorithm predicts potential for upper limb recovery after stroke. Brain. 2012;135(pt 8):2527-2535. [DOI] [PubMed] [Google Scholar]
- 9.Stinear CM, Byblow WD, Ackerley SJ, Smith MC, Borges VM, Barber PA. PREP2: a biomarker-based algorithm for predicting upper limb function after stroke. Ann Clin Transl Neurol. 2017;4(11):811-820. [DOI] [PMC free article] [PubMed] [Google Scholar]
- 10.Hayward KS, Schmidt J, Lohse KR, et al. Are we armed with the right data? Pooled individual data review of biomarkers in people with severe upper limb impairment after stroke. NeuroImage Clin. 2017;13(6):310-319. [DOI] [PMC free article] [PubMed] [Google Scholar]
- 11.Woytowicz EJ, Rietschel JC, Goodman RN, et al. Determining levels of upper extremity movement impairment by applying a cluster analysis to the Fugl-Meyer assessment of the upper extremity in chronic stroke. Arch Phys Med Rehabil. 2017;98(3):456-462. [DOI] [PMC free article] [PubMed] [Google Scholar]
- 12.Kim B, Winstein C. Can neurological biomarkers of brain impairment Be used to predict poststroke motor recovery? A systematic review. Neurorehabil Neural Repair. 2017;31(1):3-24. [DOI] [PubMed] [Google Scholar]
- 13.Feng W, Wang J, Chhatbar PY, et al. Corticospinal tract lesion load: an imaging biomarker for stroke motor outcomes. Ann Neurol. 2015;78(6):860-870. [DOI] [PMC free article] [PubMed] [Google Scholar]
- 14.Jones TA, Adkins DL. Motor system reorganization after stroke: stimulating and training toward perfection. Physiology 2015;30(5):358-370. [DOI] [PMC free article] [PubMed] [Google Scholar]
- 15.Plow EB, Cunningham D, Varnerin N, Machado A. Rethinking stimulation of brain in stroke rehabilitation: why higher-motor areas might be better alternatives for patients with greater impairments. Neuroscientist. 2015;21(3):225-240. [DOI] [PMC free article] [PubMed] [Google Scholar]
- 16.Park CH, Kou N, Ward NS. The contribution of lesion location to upper limb deficit after stroke. J Neurol Neurosurg Psychiatry. 2016;87(12):1283-1286. [DOI] [PMC free article] [PubMed] [Google Scholar]
- 17.Rondina JM, Filippone M, Girolami M, Ward NS. Decoding post-stroke motor function from structural brain imaging. NeuroImage Clin. 2016;12:372-380. [DOI] [PMC free article] [PubMed] [Google Scholar]
- 18.Mang CS, Borich MR, Brodie SM, et al. Diffusion imaging and transcranial magnetic stimulation assessment of transcallosal pathways in chronic stroke. Clin Neurophysiol. 2015;126(10):1959-1971. [DOI] [PubMed] [Google Scholar]
- 19.Hofer S, Frahm J. Topography of the human corpus callosum revisited–comprehensive fiber tractography using diffusion tensor magnetic resonance imaging. NeuroImage. 2006;32(3):989-994. [DOI] [PubMed] [Google Scholar]
- 20.Stewart JC, Dewanjee P, Tran G, et al. Role of corpus callosum integrity in arm function differs based on motor severity after stroke. NeuroImage Clin. 2017;14:641-647. [DOI] [PMC free article] [PubMed] [Google Scholar]
- 21.Nazarova M, Kulikova S, Piradov MA, et al. Multimodal assessment of the motor system in patients with chronic ischemic stroke. Stroke. 2021;52(1):241-249. [DOI] [PubMed] [Google Scholar]
- 22.Hayward KS, Neva JL, Mang CS, et al. Interhemispheric pathways are important for motor outcome in individuals with chronic and severe upper limb impairment post stroke. Neural plasticity. 2017;4281532. [DOI] [PMC free article] [PubMed] [Google Scholar]
- 23.Bradnam LV, Stinear CM, Barber PA, Byblow WD. Contralesional hemisphere control of the proximal paretic upper limb following stroke. Cereb Cortex. 2012;22(11):2662-2671. [DOI] [PMC free article] [PubMed] [Google Scholar]
- 24.Dobkin BH, Carmichael ST. The specific requirements of neural repair trials for stroke. Neurorehabil Neural Repair. 2016;30(5):470-478. [DOI] [PMC free article] [PubMed] [Google Scholar]
- 25.Fugl-Meyer AR, Jaasko L, Leyman I, Olsson S, Steglind S. The post-stroke hemiplegic patient. 1. a method for evaluation of physical performance. Scand J Rehabil Med. 1975;7(1):13-31. [PubMed] [Google Scholar]
- 26.Kwakkel G, Lannin N, Borschmann K, et al. Standardised measurement of sensorimotor recovery in stroke trials: consensus-based core recommendations from the Stroke Recovery and Rehabilitation Roundtable (SRRR). Int J Stroke. 2017;12(5):451-461. [DOI] [PubMed] [Google Scholar]
- 27.fsl.fmrib.ox.ac.uk/fsl.
- 28.Behrens TE, Berg HJ, Jbabdi S, Rushworth MF, Woolrich MW. Probabilistic diffusion tractography with multiple fibre orientations: what can we gain? Neuroimage. 2007;34(1):144-155. [DOI] [PMC free article] [PubMed] [Google Scholar]
- 29.Stinear CM, Barber PA, Smale PR, Coxon JP, Fleming MK, Byblow WD. Functional potential in chronic stroke patients depends on corticospinal tract integrity. Brain. 2007;130(pt 1):170-180. [DOI] [PubMed] [Google Scholar]
- 30.Feldman SJ, Boyd LA, Neva JL, Peters S, Hayward KS. Extraction of corticospinal tract microstructural properties in chronic stroke. J Neurosci Methods. 2018;301:34-42. [DOI] [PubMed] [Google Scholar]
- 31.Pustina D, Coslett HB, Turkeltaub PE, Tustison N, Schwartz MF, Avants B. Automated segmentation of chronic stroke lesions using LINDA: lesion identification with neighborhood data analysis. Hum Brain Mapp. 2016;37(4):1405-1421. [DOI] [PMC free article] [PubMed] [Google Scholar]
- 32.Andersson JLR, Jenkinson M, Smith S. Non-linear Registration Aka Spatial Normalisation; FMRIB Technical Report TR07JA2. 2007. Accessed January 5, 2022. fmrib.ox.ac.uk/datasets/techrep/tr07ja2/tr07ja2.pdf. [Google Scholar]
- 33.R: a language and environment for statistical computing. R Found Stat Comput. 2019. Accessed January 5, 2022. R-project.org/. [Google Scholar]
- 34.Bates D, Maechler M, Bolker B, Walker S. Fitting linear mixed-effects models using lme4. J Stat Softw. 2015;67(1):1-48. [Google Scholar]
- 35.Kuznetsova A, Brockhoff PB, Christensen RHB. lmerTest package: tests in linear mixed effects models. J Stat Softw. 2017;82(13):1-26. [Google Scholar]
- 36.Rothnam KJ. No adjustments are needed for multiple comparisons. Epidemiology. 1990;1(1):43-46. [PubMed] [Google Scholar]
- 37.Long JD. Longitudinal Data Analysis for the Behavioral Sciences Using R. Sage; 2012. [Google Scholar]
- 38.Sterr A, Conforto AB. Plasticity of adult sensorimotor system in severe brain infarcts: challenges and opportunities. Neural Plasticity. 2012;2012:970136. [DOI] [PMC free article] [PubMed] [Google Scholar]
- 39.Jeffers MS, Touvykine B, Ripley A, et al. Poststroke impairment and recovery are predicted by task-specific regionalization of injury. J Neurosci. 2020;40(31):6082-6097. [DOI] [PMC free article] [PubMed] [Google Scholar]
- 40.Hawe RL, Scott SH, Dukelow S. Taking proportional out of stroke recovery. Stroke. 2018;50:204-211. [DOI] [PubMed] [Google Scholar]
- 41.Buetefisch CM. Role of the contralesional hemisphere in post-stroke recovery of upper extremity motor function. Front Neurol. 2015;6:214. [DOI] [PMC free article] [PubMed] [Google Scholar]
- 42.Carson RG. Inter-hemispheric inhibition sculpts the output of neural circuits by co-opting the two cerebral hemispheres. J Physiol. 2020:598(21):4781-4802. [DOI] [PubMed] [Google Scholar]
- 43.Wang LE, Tittgemeyer M, Imperati D, et al. Degeneration of corpus callosum and recovery of motor function after stroke: a multimodal magnetic resonance imaging study. Hum Brain Mapp. 2012;33(12):2941-2956. [DOI] [PMC free article] [PubMed] [Google Scholar]
- 44.Murase N, Duque J, Mazzochio R, Cohen LG. Influence of interhemispheric interaction on motor function in chronic stroke. Ann Neurol. 2004;55(3):400-409. [DOI] [PubMed] [Google Scholar]
- 45.Di Pino G, Pellegrino G, Assenza G, et al. Modulation of brain plasticity in stroke: a novel model for neurorehabilitation. Rev Nat Rev Neurol. 2014;10(10):597-608. [DOI] [PubMed] [Google Scholar]
- 46.Sankarasubramanian V, Machado AG, Conforto AB, et al. Inhibition versus facilitation of contralesional motor cortices in stroke: deriving a model to tailor brain stimulation. Clin Neurophysiol. 2017;128(6):892-902. [DOI] [PMC free article] [PubMed] [Google Scholar]
- 47.Koh CL, Tang PF, Chen HI, Hsu YC, Hsieh CL, Tseng WI. Impaired callosal motor fiber integrity and upper extremity motor impairment are associated with stroke lesion location. Neurorehabil Neural Repair. 2018;32(6-7):602-612. [DOI] [PubMed] [Google Scholar]
- 48.Cox SR, Ritchie SJ, Tucker-Drob EM, et al. Ageing and brain white matter structure in 3,513 UK Biobank participants. Nat Commun. 2016;7:13629. [DOI] [PMC free article] [PubMed] [Google Scholar]
- 49.Seiler S, Fletcher E, Hassan-Ali K, et al. Cerebral tract integrity relates to white matter hyperintensities, cortex volume, and cognition. Neurobiol Aging. 2018;72:14-22. [DOI] [PMC free article] [PubMed] [Google Scholar]
- 50.Bernhardt J, Hayward KS, Kwakkel G, et al. Agreed definitions and a shared vision for new standards in stroke recovery research: the Stroke Recovery and Rehabilitation Roundtable taskforce. Int J Stroke. 2017;12(5):444-450. [DOI] [PubMed] [Google Scholar]
- 51.Wei JX, Tong KY, Hu XL. The responsiveness and correlation between Fugl-Meyer Assessment, Motor Status Scale, and the Action Research Arm Test in chronic stroke with upper-extremity rehabilitation robotic training. Int J Rehabil Res. 2011;34(4):349-356. [DOI] [PubMed] [Google Scholar]
Associated Data
This section collects any data citations, data availability statements, or supplementary materials included in this article.
Data Availability Statement
Available upon reasonable request.