

Abstract
Background
Several school‐based interventions are effective in improving child diet and physical activity, and preventing excessive weight gain, and tobacco or harmful alcohol use. However, schools are frequently unsuccessful in implementing such evidence‐based interventions.
Objectives
1. To evaluate the benefits and harms of strategies aiming to improve school implementation of interventions to address student diet, physical activity, tobacco or alcohol use, and obesity.
2. To evaluate the benefits and harms of strategies to improve intervention implementation on measures of student diet, physical activity, obesity, tobacco use or alcohol use; describe their cost or cost‐effectiveness; and any harms of strategies on schools, school staff or students.
Search methods
We used standard, extensive Cochrane search methods. The latest search was between 1 September 2016 and 30 April 2021 to identify any relevant trials published since the last published review.
Selection criteria
We defined 'Implementation' as the use of strategies to adopt and integrate evidence‐based health interventions and to change practice patterns within specific settings. We included any trial (randomised controlled trial (RCT) or non‐randomised controlled trial (non‐RCT)) conducted at any scale, with a parallel control group that compared a strategy to implement policies or practices to address diet, physical activity, overweight or obesity, tobacco or alcohol use by students to 'no intervention', 'usual' practice or a different implementation strategy.
Data collection and analysis
We used standard Cochrane methods. Given the large number of outcomes reported, we selected and included the effects of a single outcome measure for each trial for the primary (implementation) and secondary (student health behaviour and obesity) outcomes using a decision hierarchy. Where possible, we calculated standardised mean differences (SMDs) to account for variable outcome measures with 95% confidence intervals (CI). For RCTs, we conducted meta‐analyses of primary and secondary outcomes using a random‐effects model, or in instances where there were between two and five studies, a fixed‐effect model. The synthesis of the effects for non‐randomised studies followed the 'Synthesis without meta‐analysis' (SWiM) guidelines.
Main results
We included an additional 11 trials in this update bringing the total number of included studies in the review to 38. Of these, 22 were conducted in the USA. Twenty‐six studies used RCT designs. Seventeen trials tested strategies to implement healthy eating, 12 physical activity and six a combination of risk factors. Just one trial sought to increase the implementation of interventions to delay initiation or reduce the consumption of alcohol. All trials used multiple implementation strategies, the most common being educational materials, educational outreach and educational meetings.
The overall certainty of evidence was low and ranged from very low to moderate for secondary review outcomes.
Pooled analyses of RCTs found, relative to a control, the use of implementation strategies may result in a large increase in the implementation of interventions in schools (SMD 1.04, 95% CI 0.74 to 1.34; 22 RCTs, 1917 participants; low‐certainty evidence). For secondary outcomes we found, relative to control, the use of implementation strategies to support intervention implementation may result in a slight improvement on measures of student diet (SMD 0.08, 95% CI 0.02 to 0.15; 11 RCTs, 16,649 participants; low‐certainty evidence) and physical activity (SMD 0.09, 95% CI −0.02 to 0.19; 9 RCTs, 16,389 participants; low‐certainty evidence). The effects on obesity probably suggest little to no difference (SMD −0.02, 95% CI −0.05 to 0.02; 8 RCTs, 18,618 participants; moderate‐certainty evidence). The effects on tobacco use are very uncertain (SMD −0.03, 95% CIs −0.23 to 0.18; 3 RCTs, 3635 participants; very low‐certainty evidence). One RCT assessed measures of student alcohol use and found strategies to support implementation may result in a slight increase in use (odds ratio 1.10, 95% CI 0.77 to 1.56; P = 0.60; 2105 participants). Few trials reported the economic evaluations of implementation strategies, the methods of which were heterogeneous and evidence graded as very uncertain. A lack of consistent terminology describing implementation strategies was an important limitation of the review.
Authors' conclusions
The use of implementation strategies may result in large increases in implementation of interventions, and slight improvements in measures of student diet, and physical activity. Further research is required to assess the impact of implementation strategies on such behavioural‐ and obesity‐related outcomes, including on measures of alcohol use, where the findings of one trial suggest it may slightly increase student risk. Given the low certainty of the available evidence for most measures further research is required to guide efforts to facilitate the translation of evidence into practice in this setting.
Keywords: Child, Humans, Diet, Exercise, Nicotiana, Obesity, Obesity/prevention & control, Policy, Randomized Controlled Trials as Topic, Tobacco Use
Plain language summary
Improving the implementation of school‐based policies and practices to improve student health
Key messages
• Schools and their staff implement interventions to address student healthy eating, physical activity, obesity, and tobacco or alcohol use better when strategies are used to support them to do so. • School‐based interventions whose implementation is supported may be slightly more effective in improving student healthy eating, physical activity, obesity or tobacco use. • Most studies do not report economic evaluation of strategies to support implementation of interventions in schools or assess any potential adverse effects.
What did we want to find out?
We wanted to find out how effective strategies were in supporting the implementation of school‐based interventions to address student diet, physical activity, unhealthy weight gain, and tobacco or alcohol use. We wanted to know if they were cost‐effective and if they had any adverse effects. Examples of strategies include methods of improving quality, education and training, feedback on how the school was doing, prompts and reminders, and educational resources (e.g. manuals).
What did we do?
We updated a previous search we had conducted for studies that compared the use of a strategy to support intervention implementation to those that had not, or that had compared two or more different implementation strategies. The studies had looked at strategies to support the implementation of interventions in schools that addressed student nutrition, physical activity, obesity, or tobacco or alcohol use. We compared and summarised the results and rated our confidence in the evidence, based on factors such as study methods and sizes.
What did we find?
We found 11 new trials to add to those identified in our previous search, bringing the total number of included studies to 38. Most were conducted in the USA and examined strategies to implement healthy eating or physical activity interventions. We found, compared with a control, the use of implementation strategies may result in large improvements in the implementation of interventions in schools, and slight improvements in student healthy eating and physical activity. There was probably little to no effect on student obesity. The effects of implementation strategies on tobacco use are very uncertain. Few trials assessed any economic benefits of the use of intervention implementation support strategies or any potential adverse effects for schools, staff or students.
What were the limitations of the evidence?
Despite our review showing that the use of implementation strategies resulted in large improvements in programme implementation, the studies used methods likely to introduce errors in their results and inconsistencies across included studies, and were primarily conducted in one country (USA). As a result, we have low confidence in the impact strategies to support implementation have on improving the implementation of intervention in schools and most of secondary outcomes (downgraded for risk of bias and variation in methods and results).
How up to date is this evidence?
We searched databases between 1 September 2016 and 30 April 2021.
Summary of findings
Summary of findings 1. Comparison of strategies for enhancing the implementation of school‐based policies or practices targeting risk factors for chronic disease.
| Outcome | Anticipated absolute effects | Relative effect (95% CI) | № of participants (studies) | Certainty of the evidence | What happens | |
| Risk with control | Risk with experimental | |||||
| Implementation of policies, practices or programmes that promote student health in schools | Mean PA practices achieved 0.5 (SD 0.7)a | SMD of 1.04 is equivalent to an increase in the implementation of 0.73 of a school chronic disease prevention policy or practice | SMD 1.04 SD higher (0.74 higher to 1.34 higher) | 897 schoolsb (22 RCTs) |
⊕⊕⊖⊖ Lowc | Implementation strategies may result in a large increase in the implementation of interventions in schools. |
| Student diet | Dietary diversity score (range 0–9) mean 4.54 (SD 1.22)d | SMD of 0.08 is equivalent to an improvement in dietary diversity score of 0.10 units | SMD 0.08 SD higher (0.02 higher to 0.15 higher) | 16,649 participants (11 RCTs) | ⊕⊕⊖⊖ Lowe | Implementation strategies may result in slight improvements in student nutrition outcomes. |
| Student physical activity | Mean steps/day 2556.85 (SD 557.27)f | SMD of 0.09 is equivalent to an improvement of 50 steps/day more | SMD 0.09 SD higher (0.02 lower to 0.19 higher) | 16,389 participants (9 RCTs) | ⊕⊕⊖⊖ Lowg | Implementation strategies may result in slight improvements in student physical activity outcomes. |
| Student obesity | Mean BMI 19.1 (SD 3.7)h | SMD of −0.02 is equivalent to a reduction of BMI by 0.074 points |
SMD 0.02 SD lower (0.05 lower to 0.02 higher) | 18,618 participants (8 RCTs) | ⊕⊕⊕⊖ Moderatei | Implementation strategies probably result in little to no difference in measures of student obesity. |
| Student tobacco use | See comments | See comments | SMD 0.03 SD lower (0.23 lower to 0.18 higher) | 3635 participants (3 RCTs) | ⊕⊖⊖⊖ Very lowj | We are very uncertain about the effect of implementation strategies on tobacco use outcomes. |
| Adverse events | See comment | See comment | — | (3 RCTs) | ⊕⊕⊖⊖ Lowk | Interventions had little to no impact of on adverse events. |
| Cost‐effectiveness | See comment | See comment | — | (4 RCTs) | ⊕⊖⊖⊖ Very lowl | We are uncertain whether strategies to improve the implementation of school‐based policies, practices or programmes targeting risk factors for chronic disease are cost‐effective. |
| BMI: body mass index; PA: physical activity; RCT: randomised controlled trial; SD: standard deviation; SMD: standardised mean difference. | ||||||
| GRADE Working Group grades of evidence High certainty: we are very confident that the true effect lies close to that of the estimate of the effect. Moderate certainty: we are moderately confident in the effect estimate: the true effect is likely to be close to the estimate of the effect, but there is a possibility that it is substantially different. Low certainty: our confidence in the effect estimate is limited: the true effect may be substantially different from the estimate of the effect. Very low certainty: we have very little confidence in the effect estimate: the true effect is likely to be substantially different from the estimate of effect. | ||||||
aBaseline estimates and SDs used from Sutherland 2020. bNumber of school reported rather than participants as implementation data were not reported at the participant level and may have included school, class, individual or some other level data. cDowngraded one level for unclear/high risk of bias and one level for substantial heterogeneity (I2 = 81%; 50% to 90% considered substantial heterogeneity). cBaseline estimates and SD used from de Villiers 2015. dDowngraded one level for unclear/high risk of bias and one level for substantial heterogeneity (I2 = 63%; 50% to 90% considered substantial heterogeneity). eBaseline estimates and SD used from Nathan 2020. fDowngraded one level for substantial heterogeneity (I2 = 83%; 50% to 90% considered substantial heterogeneity) and one level for imprecision as 95% CI included both benefits and harms. gBaseline estimates and SD used from Naylor 2006. hDowngraded one level for imprecision as 95% CI included both benefits and harms. iDowngraded one level for unclear/high risk of bias, one level for substantial heterogeneity (I2 = 81%; 50% to 90% considered high heterogeneity), and one level for imprecision as 95% CI include both benefits and harms. jDowngraded one level for unclear/high risk of bias and one level for small number of studies reporting adverse outcomes. kDowngraded one level for unclear/high risk of bias, one level for indirectness given the small number of studies providing assessment on cost‐effectiveness, and one level for imprecision given the small number of schools in total.
Background
Description of the condition
Five health risks (i.e. poor diet, physical inactivity, tobacco smoking, risky alcohol consumption and obesity) are the most common modifiable causes of chronic disease (Murray 2020). These risk factors, all among the top 20 risk factors contributing to global death and disability, each account for a significant proportion of the total global disease burden: dietary risks (14.1%), physical inactivity (1.4%), tobacco smoking (7.9%), alcohol misuse (4.3%) and high body‐mass index (BMI) (8.9%) (Institute for Health 2020). Together, they were responsible for more than 650 million years lived with disability and 26 million deaths in 2019 (Institute for Health 2020). As a consequence, reducing the impact of these modifiable health risks in the community has been identified as a public health priority, and this has not changed since the early 2010s (WHO 2011; WHO 2021).
Targeting health risks in children is an important chronic disease prevention strategy, as health behaviours established in childhood are likely to track into adulthood (Cruz 2018; Hayes 2019). Schools are an attractive setting for the implementation of child‐focused chronic disease‐prevention interventions as they offer continuous and intensive contact with children for prolonged periods (WHO 2017). Furthermore, evidence from systematic reviews support a range of benefits from school‐based health interventions (Brown 2019; Foxcroft 2011; Hodder 2017; Jacob 2021; Liu 2019; Thomas 2013). For instance, classroom based physical activity interventions are effective in increasing children's physical activity as well as other health and education outcomes (Martin 2017). Systematic reviews, including one Cochrane Review, found school‐based prevention interventions of one year or more in duration were effective in reducing smoking rates by up to 12% (Thomas 2013). Similarly, previous Cochrane Reviews have reported examples of effective school‐based obesity and alcohol prevention interventions (Brown 2019; Foxcroft 2011). Finally, systematic review evidence also suggests, when implemented, school food policy interventions are generally effective in improving the food environment and dietary intake of school students (Micha 2018). Given such evidence, international chronic disease prevention strategies recommend the implementation of effective interventions targeting student diet, physical activity, tobacco and alcohol use and excessive weight gain (Ministry of Health 2011; WHO 2012; Australian Health Minister' Advisory Council 2017; Gassner 2022). Currently, the implementation of evidence‐based chronic disease‐prevention interventions in schools is suboptimal. Research conducted in the USA, Canada and Australia, for example, suggests that less than 10% of schools are compliant with legislation, policy or nutrition guidelines regarding the sale and promotion of healthy foods in schools (Chriqui 2013; De Silva‐Sanigorski 2011; Downs 2012; Vine 2021). In Australia, one report highlighted that 24% of schools did not provide students with 150 minutes of structured physical activity each week (Nathan 2020), as recommended by the sector (NSW Government 2021). In one national survey in Japan, just 14.3% of municipalities had implemented a smoke‐free policy in all elementary and junior high schools (Kayaba 2005), while studies in India reported a minority of schools implement policies prohibiting the use of tobacco by staff inside school buildings (Pradhan 2021).
Description of the intervention
Effective school‐based interventions to reduce chronic disease risks cannot improve population health outcomes if school systems and staff do not implement them (Eccles 2009; MacDonald 2016). However, the process of translating research into practice is complex. As a conceptual guide, the US National Institutes of Health described five phases of the translation (T) process (T0 to T4) from research discovery to population health impact (Glasgow 2012; Khoury 2010). Earlier phases (T0 to T2) focus on basic science, epidemiology and testing the efficacy of health interventions. T3 is dedicated to research designed to increase the implementation of evidence‐based interventions (also referred to as practices, policies or programmes) in practice (Glasgow 2012). This is achieved through 'implementation strategies' — techniques designed to change practice patterns within specific settings to improve the 'implementation' of evidence‐based health interventions (Glasgow 2012; Rabin 2008). There are several implementation strategies that have the potential to improve the likelihood of schools' implementation of interventions (e.g. policies and practices) to promote student health and reduce the risk of future disease including those listed in the Cochrane Effective Practice and Organisation of Care (EPOC) taxonomy (EPOC 2015). Such strategies include continuous quality improvement processes, educational materials, performance monitoring, local consensus processes and educational outreach visits. To build the evidence regarding the impact of these strategies on measures of intervention implementation, the conduct of implementation trials has been recommended (Wolfenden 2021).
How the intervention might work
Schools are complex environments in which health interventions may be implemented (Kremser 2011). A range of factors, operating at multiple levels, may influence the success of implementation efforts (Darlington 2018). The mechanisms by which implementation strategies facilitate implementation of interventions in this setting are under‐researched and not well understood (Darlington 2018; Lee 2018). Theories and frameworks, such as Normalisation Process Theory or the Theoretical Domains Framework, can be applied to gain insight as to how such strategies can be used to support the implementation of a school‐based chronic disease prevention interventions (Cane 2012; May 2018; Rapley 2018). Similarly, comprehensive implementation frameworks describe a number of factors within schools, and external to them, that can influence the success of implementation including: characteristics of the intervention, individuals (i.e. knowledge skills, attitudes), the organisation (i.e. organisational culture) and the broader environmental contexts (Damschroder 2009), such as system‐wide policies. Similarly, systematic reviews of diet (Ronto 2020), physical activity (Cassar 2019; Nathan 2018), and substance use (Waller 2017) interventions in schools have identified a range of barriers or facilitators impacting their implementation including, the prevailing political or funding environment, school readiness to change, school priorities, the support of key school constituents (e.g. parent and teachers) and staff knowledge, skill, time and resources. The selection of implementation strategies should be based on those known (have evidence of) or believed (theoretically) to be able to overcome barriers to implementation within a given context (Department of Health 2018).
Why it is important to do this review
Studying the effectiveness of implementation strategies provides important information to guide future implementation research. Such evidence is also important to inform the decisions of policymakers and practitioners responsible for ensuring evidence‐based chronic disease prevention interventions are sufficiently implemented to yield health benefits. A number of systematic reviews have been conducted describing the effectiveness of strategies to implement practice guidelines and improve professional practice of clinicians in clinical settings, such as audit and feedback (Tuti 2017), reminders (Arditi 2017), education meetings (Forsetlund 2021), and incentives (Heider 2020). To our knowledge, few systematic reviews of implementation trials have been conducted assessing the impacts of implementation strategies in schools, including our 2017 Cochrane Review (Rabin 2010; Naylor 2015; Wolfenden 2017). These reviews concluded that evidence regarding the effectiveness of implementation strategies in this setting is uncertain. Given the policy relevance of such research, and as the literature searches of these reviews were undertaken several years ago, and a number of likely eligible studies have been published since, an update of our Cochrane Review is warranted. Specifically, this review aims to update our previous Cochrane Review (Wolfenden 2017), and provide evidence for how health promotion practitioners, education systems and other stakeholders can design and better implement interventions in the school setting to promote the health of students.
Objectives
1. To evaluate the benefits and harms of strategies aiming to improve school implementation of interventions to address student diet, physical activity, tobacco or alcohol use, and obesity.
2. To evaluate the benefits and harms of strategies to improve intervention implementation on measures of student diet, physical activity, obesity, tobacco use or alcohol use; describe their cost or cost‐effectiveness; and any harms of strategies on schools, school staff or students.
Methods
Criteria for considering studies for this review
Types of studies
Strategies to improve the implementation of interventions are often complex and have been evaluated using a wide variety of methods and research designs. While results of randomised controlled trials (RCTs) are considered more robust and are commonly used to assess the impact of implementation strategies (Brown 2017; Wolfenden 2016a), the use of randomised designs can be impractical or inappropriate for complex interventions (Glasgow 1999). As such, and to provide a more comprehensive assessment of the broader body of evidence, we included any trial (RCT or non‐RCT) with a parallel control group examining the effect of an implementation intervention published in any language. We included the following trial designs:
RCTs and cluster‐RCTs;
non‐RCTs and cluster non‐RCTs; and
controlled before‐after studies (CBAs), cluster‐CBAs.
Studies assessing any strategy aiming to improve the implementation of interventions in a school setting that targeted healthy eating, physical activity, tobacco or alcohol prevention, or obesity prevention (or combination of) were eligible. To be included, trials were required to report between‐group comparisons of the impact of a defined implementation strategy on an implementation outcome. Given the emergence of this literature, and as a limited number of new studies were anticipated, we did not apply an exclusion criteria based on a minimum number of clusters per group.
Types of participants
,We included studies set in schools (e.g. elementary, primary, secondary, middle, high and central schools) where the age of students was typically between five and 18 years. Study participants could be any stakeholders who may influence the uptake, implementation or sustainability of a target health‐promoting intervention (policy, practice or programme) in schools, including students, teachers, managers, cooks or other staff of schools and education departments. Study participants may also have included administrators, officials or representatives of school services, or other health, education, government or non‐government personnel responsible for encouraging or enforcing the implementation of health promoting interventions in this setting. We excluded studies or arms of trials assessing implementation performed by research staff.
Types of interventions
We included studies that tested implementation strategies designed to improve the implementation of interventions (policies, practices or programmes) targeting student diet, physical activity, prevention of tobacco or alcohol use, or obesity. Studies could compare the effects of implementation strategies with: 1. no active implementation strategy (inclusive of delayed implementation strategy, usual practice or minimal support); or 2. other implementation strategies. For trials that did not describe comparison conditions, but reported the findings against a comparison group, we assumed that the comparison was usual practice.
To be eligible for inclusion, studies had to include strategies to improve implementation by those involved in the usual delivery, uptake or use of interventions in schools (e.g. usual teaching staff). We defined implementation strategies as methods or techniques used to enhance the adoption, implementation and sustainability of an evidence‐based intervention (Proctor 2013). A number of taxonomies describing distinct implementation strategies exist (EPOC 2015; Powell 2015). In this review, we used the EPOC taxonomy to describe implementation strategies. Strategies could include quality improvement initiatives, education and training, performance feedback, prompts and reminders, implementation resources (e.g. manuals), financial incentives, penalties, communication and social marketing strategies, professional networking, use of opinion leaders, implementation consensus processes or other strategies consistent with the previous review. Strategies could be directed at individuals, classes, or whole schools or broader systems.
Types of outcome measures
Primary outcomes
Implementation of policies, practices or programmes that promote student health in schools
The primary review outcome was a measure of school intervention implementation. Implementation measures were those that assessed the delivery (i.e. implementation) of an intervention by usual school personnel. It could include measures of the comprehensiveness, completeness or quality of implementation, for example, the mean number of curricula lessons taught or the proportion of schools implementing canteen services consistent with guidelines. Attitudes regarding implementation, such as measures of school or other stakeholder acceptability or feasibility were not considered measures of implementation. We included trials reporting only follow‐up data of an implementation outcome (i.e. no baseline data) if it used a randomised design as baseline values were assumed to have been equivalent, or if the baseline values could be assumed to be zero (e.g. the implementation of a curriculum not available at baseline).
Given the large number of potential implementation measures reported in trials, we selected and included the effects of a single trial outcome measure for each trial, consistent with previous reviews (Tang 2021). We developed a hierarchy for measure selection based on that employed by Tang and colleagues (Tang 2021). Specifically, we prioritised continuous (over dichotomous) measures of implementation outcomes; where multiple continuous outcomes were reported, we selected the outcomes considered most valid (e.g. objective measures were selected over self‐report measures); otherwise we randomly selected one of the continuous outcome measures using the RANDBETWEEN function in Microsoft Excel (Microsoft Corporation 2013). For trials reporting only dichotomous outcomes, and where there was sufficient information, we sought to re‐express effect sizes as continuous standardised outcomes. We selected the dichotomous outcome measure considered most valid; otherwise, we randomly selected a dichotomous outcome using the RANDBETWEEN function in Microsoft Excel (Microsoft Corporation 2013). This represented a change in approach from the previously published version of this review where we extracted all eligible measures of implementation and summarised their effects.
The included outcome measures may have been derived from data obtained from audits of school records, questionnaires or surveys of staff, direct observation or recordings, examination of routinely collected information from government departments (such as compliance with food standards or breaches of department regulations) or other sources.
Secondary outcomes
Diet
Physical activity
Obesity
Tobacco use
Adverse events
Costs
Data on secondary outcomes were only extracted for measures corresponding to the implementation outcomes reported in the included trials. For example, in a trial of an intervention targeting physical activity and healthy eating, but where an implementation strategy and implementation outcome data were only reported for healthy eating interventions, we extracted only data related to diet (e.g. foods or beverages consumed by students or student BMI, or both). Secondary outcomes included measures of the following student risk factors: poor diet, physical inactivity, tobacco or alcohol use, or obesity. If an intervention targeted multiple risk factors, we selected outcomes and extracted data for each risk factor addressed.
Similar to the selection of measures of the primary outcome, we did not include all eligible measures of secondary outcomes for all reported risk factors. Instead, we included a single outcome for each risk using a decision hierarchy following the guidance of Section 3.2.4.3 of the Cochrane Handbook for Systematic Reviews of Interventions (McKenzie 2022a; Tang 2021); where we prioritised continuous (over dichotomous) measures of implementation outcomes; and outcomes considered most valid. This new approach was different to the previous version of this review and required the re‐extraction and selection of outcomes for inclusion in this update. Specifically, we worked systematically through the hierarchy, in descending order starting at each level (and progressing each step) until we identified a measure of an eligible risk factor. Where we identified multiple measures at the same level and step, we randomly selected a single measure. The hierarchy for each risk factor is explained below.
Diet
-
Level 1: validated measures of student diet (e.g. food record, validated food frequency):
step 1: whole day estimates of diet including measures of the quantity or frequency of foods or nutrients consumed (e.g. total calories consumed; daily serves of fruit and vegetables, measure of macronutrient intake, or score‐based measures of diet quality); then
step 2: part day (e.g. during school hours) estimates of student diet.
-
Level 2: non‐validated measures of student diet (e.g. food record, validated food frequency):
step 1: whole day estimates of diet including measures of the quantity or frequency of foods or nutrients consumed (e.g. total calories consumed; daily serves of fruit and vegetables, measure of macronutrient intake, or score‐based measures of diet quality); then
step 2: part day (e.g. during school hours) estimates of student diet.
Within this hierarchy, for obesity prevention studies, or those undertaken in the context of an obesity prevention initiative (as defined by authors of the included studies), we gave preference to measures of energy intake over other dietary intake outcomes. For trials that were not undertaken in the context of an obesity prevention initiative, we gave preference to other measures of dietary intake. Also, where score‐based measures were used to assess diet or nutritional quality, the total questionnaire scores representing whole diet were included in preference to subgroup scores representing specific diet components (e.g. de Villiers 2015). Where summary estimates for questionnaires were split for healthy and unhealthy food groups, the healthy food estimates were included (Hoelscher 2010). As food purchased for consumption has been identified to represent a reliable estimate of food intake, we included food purchase data in this review; however, we gave preference to measures of actual consumptions when both were available (e.g. Taylor 2018).
Physical activity
-
Level 1: device‐measured physical activity (e.g. accelerometer, pedometer):
step 1: whole‐day estimates of physical activity;
step 2: part‐day (e.g. during school hours) estimates of physical activity;
step 3: measures of physical activity intensity (whole day then part day).
-
Level 2: self‐reported measures of physical activity:
step 1: whole‐day estimates of physical activity;
step 2: part‐day (e.g. during school hours) estimates of physical activity;
step 3: measures of physical activity intensity (whole day then part day).
Level 3: self‐report data of fitness was extracted.
Obesity
Level 1: objectively measured BMI, with BMI z‐scores preferred over non‐standardised BMI scores if available.
Level 2: other objective estimates of anthropometry (e.g. weight, waist circumference).
Level 3: self‐reported estimates of anthropometry (e.g. self‐reported weight).
Tobacco use
Level 1: validated self‐reported measures of tobacco use (e.g. current tobacco use).
Level 2: non‐validated self‐reported measures of smoking rates.
Level 3: other estimates of tobacco use (e.g. cigarette butt counts).
'Current use' measures were preference for inclusion over 'ever use' measures.
Alcohol use
Level 1: validated self‐reported measures of alcohol use (e.g. 24‐hour recall, Alcohol Use Disorders Identification Test).
Level 2: non‐validated self‐reported measures of alcohol use.
Current or daily use, or measures of drinking at harmful levels (e.g. binge‐drinking) were preferences over 'ever use' measures.
Cost and adverse events
The following data on cost and adverse events were also extracted.
All estimates of absolute costs, relative or incremental costs, or any assessment of the cost‐effectiveness of strategies to improve implementation of policies, programmes or practices in schools; and
Any reported unintended adverse consequences of a strategy to improve implementation of policies, programmes or practices in schools; these could include adverse impacts on child health (e.g. unintended changes in other risk factors, injury), school operation or staff attitudes (e.g. impacts on staff motivation or cohesion following implementation), or the displacement of other key programmes, curricula or practice.
Search methods for identification of studies
We performed a comprehensive search for both published and unpublished research studies across a broad range of information sources to reflect the cross‐disciplinary nature of the topic. Articles published in any language were eligible and there were no restrictions regarding article publication dates.
Electronic searches
We searched the following electronic databases between 1 September 2016 and 30 April 2021 to identify any relevant trials published since the last published review (Wolfenden 2017):
the Cochrane Library including the Cochrane Central Register of Controlled Trials (CENTRAL);
MEDLINE (Ovid);
MEDLINE In‐Process & Other Non‐Indexed Citations (Ovid);
Embase Classic and Embase (Ovid);
PsycINFO (Ovid);
Education Resource Information Center (ERIC; Proquest);
Cumulative Index to Nursing and Allied Health Literature (CINAHL; Ebsco);
Dissertations and Theses (Proquest); and
SCOPUS (SCOPUS).
We adapted the MEDLINE search strategy for each database using database‐specific subject headings, where available (Appendix 1). We included filters used in other systematic reviews for research design (Waters 2011), population (Guerra 2014), physical activity and healthy eating (Dobbins 2013; Guerra 2014; Jaime 2009), obesity (Waters 2011), tobacco use prevention (Thomas 2013), and alcohol misuse (Foxcroft 2011). A search filter for intervention (implementation strategies) was developed based on previous reviews (Wolfenden 2016), and common terms in implementation and dissemination research (Rabin 2008).
Searching other resources
We screened reference lists of all included trials for citations of potentially relevant studies and contacted authors of included studies for other potentially relevant trials. We handsearched all publications between 1 July 2011 and 30 April 2021 in the journals: Implementation Science and Journal of Translational Behavioral Medicine. We also conducted searches of the World Health Organization International Clinical Trials Registry Platform (ICTRP) (apps.who.int/trialsearch/), and the US National Institutes of Health registry (clinicaltrials.gov) from 30 August 2016 to 30 April 2021. We consulted with experts in the field to identify other relevant research. To identify companion papers of identified eligible trials, we also conducted Google Scholar searches of the first 100 citations identified by a search of the trial name or title.
Data collection and analysis
Selection of studies
In this update, pairs of review authors (from SMc, CW, KN, KO, SY, FS and CB) independently screened titles and abstracts using Covidence (Covidence). We obtained full texts of all remaining potentially relevant or unclear articles and pairs of review authors (from SMc, NN, SY, RS, FT, FS, CB, KN and KO) independently reviewed these against our inclusion criteria. Studies identified as potentially eligible that were also authored by a member of the review team had their eligibility independently assessed by a review author who had no part in the conduct of the study to confirm eligibility. We used Google Translate for abstracts or had translation conducted by non‐English‐speaking collaborators. At each stage of the screening process, we resolved disagreements by discussion and consensus between the two review authors and, where required, by consulting a third review author (LW; arbitration was not required on any study LW was an author on). We recorded reasons for exclusion of studies at this stage in the Characteristics of excluded studies table.
Data extraction and management
Pairs of review authors (from SMc, CB, KN, KO) independently extracted data in duplicate using a piloted data extraction form. We resolved any disagreements in data extraction by discussion and consensus, or by consulting a third author (LW; arbitration was not required on any study LW was an author on), where required.
For all outcomes, where there were differences in published information between peer‐reviewed and grey literature for the same trial, we used data from peer‐reviewed publications. Where key data were missing from the study reports, we attempted to contact the authors to obtain missing information.
We extracted and reported the following study characteristics:
information regarding study eligibility, study design, date of publication, school type, country, participant/school demographic/socioeconomic characteristics, number of experimental conditions and information to allow assessment of risk of study bias;
information describing the characteristics of the implementation strategy, including the duration, intervention (policy, programme, practice), information to allow classification against the EPOC Group 'Taxonomy of Interventions', and data describing consistency of the execution of the strategy with a planned delivery protocol (EPOC 2015). Data extractors coded descriptions of implementation strategies using the EPOC taxonomy descriptors;
information on extracted trial outcomes, including the data collection method, validity of measures used, effect size, measures of outcome variability, costs and adverse outcomes; and
information on the source(s) of research funding and potential conflicts of interest.
Two review authors (SM, LW) independently extracted statistical data for primary outcomes, in consultation with statisticians (CL, EN). One author (SM) entered data into a statistical spreadsheet for analysis. All analyses were performed in R 4.0.5 (R Core Team 2021).
For secondary outcomes, two review authors independently extracted secondary outcome data (SMc, CB, KN and KO). One review author (KO) entered the data in to a spreadsheet for analysis and a second review author checked it (SM). Analyses on secondary outcomes were performed in Review Manager 5 (Review Manager 2020).
Assessment of risk of bias in included studies
We conducted risk of bias assessment on the selected implementation outcome and secondary outcomes of interest. For included trials, we used Cochrane's RoB 1 tool for assessing risk of bias, which includes assessments based on six domains (selection bias, performance bias, detection bias, attrition bias, reporting bias and other sources of bias) (Higgins 2011). We also included additional criteria for cluster‐RCTs including 'recruitment to cluster', 'baseline imbalance', 'loss of clusters', 'incorrect analysis' and 'compatibility with individually randomised trials'. We included an additional criterion 'potential confounding' for the assessment of the risk of bias in non‐randomised trial designs. We assessed domains as having 'low', 'high', or 'unclear' risk of bias in accordance with the Cochrane Handbook for Systematic Reviews of Interventions (Higgins 2011). We intend to reassess and update risk of bias tools in future updates in line with Cochrane guidance given new developments in this area.
We assessed overall risk of bias by review outcome at the study level by categorising studies based on risk of bias assessments for each domain. Overall risk of bias by study was determined for the primary outcome as:
low risk if 50% or more of the domains were assessed at low risk of bias;
high risk of bias if 50% or more of the domains were at high risk of bias;
unclear risk of bias if 50% or more of the domains were low or unclear risk of bias.
Where there was an even number of domains, we made a more conservative (i.e. high over unclear, unclear over low) overall domain bias (Egan 2018; Heath 2002; Hoelscher 2010; Simons‐Morton 1988). Two review authors (CB, SMc) assessed risk of bias independently for each study. We resolved any disagreements by discussion and consensus or, if required, by involving an additional author (LW; arbitration was not required on any study LW was an author on).
Measures of treatment effect
Where we performed meta‐analyses, we expressed the intervention effect for both continuous and dichotomous outcomes as a standardised mean difference (SMD) with 95% confidence interval (CI). We used this approach given the difference in measures reported in the included studies and as we were primarily interested in whether the use of implementation strategies had an effect broadly on implementation, or risk behaviour‐ or weight‐related outcomes rather than any specific measures of these outcomes. We interpreted the magnitude of effect size using the benchmarks suggested by Cohen, considering an SMD of 0.2 a small effect, 0.5 a medium effect and 0.8 a large effect (Cohen 1988).
Unit of analysis issues
We examined clustered studies for unit of analysis errors and recorded these if they occurred in the risk of bias tables. For both the primary and secondary outcomes, where possible, we used the intracluster correlation coefficient (ICC) provided in the manuscripts. If this was not available, we attempted to contact authors to provide ICCs. Failing this, for the implementation outcomes, we calculated the trials' effective sample size using an ICC of 0.02 as this represented a conservative value based off similar trials (Delk 2014). For the secondary outcomes, we used an ICC of 0.06 for both nutrition and physical activity outcomes. These were based off the mean of ICCs for nutrition and physical activity reported in Naylor 2006 (physical activity) and Story 2000 (nutrition). We calculated the design effect using the formula provided in the Cochrane Handbook for Systematic Reviews of Interventions (Higgins 2011).
Dealing with missing data
When outcomes, methods or results of the studies were missing or unclear, we contacted the corresponding authors of the published trial to supply the data. Any information provided was incorporated into the review as appropriate. Any evidence of potential selective reporting or incomplete reporting of trial data was documented in the risk of bias tables. Our analyses were conducted using the intention‐to‐treat principle.
Assessment of heterogeneity
We assessed clinical heterogeneity by narratively describing similarities and differences in the characteristics of the study designs, settings, populations, implementation strategies, comparison groups and outcome measures. We assessed statistical heterogeneity using the I2 statistic with findings summarised in a forest plot and considered the following I2 statistic categories, together with other methodological and clinical considerations in the interpretation of heterogeneity:
0% to 40% might not be important (low heterogeneity);
30% to 60% might represent moderate heterogeneity;
50% to 90% might represent substantial heterogeneity and
75% to 100% might represent considerable heterogeneity.
Assessment of reporting biases
We compared published reports with information in trial registers and protocols to assess selective reporting bias where such information was available. Where we suspected selective reporting bias (via assessment of risk of bias in included studies), we attempted to contact study authors and ask them to provide missing outcome data. We reported instances of potential reporting bias in the risk of bias summary.
We used visual inspection of funnel plots to assess for publication bias. We used the trim and fill method to estimate the number of missing studies from funnel plots for the primary analysis (Duval 2000).
Data synthesis
We present the effects of interventions grouped first according to comparison (implementation strategy versus no active implementation strategy; implementation strategy versus alternate implementation strategy), second by trial design (RCTs and non‐RCTs) and finally by outcome.
For multi‐arm trials with a control group, we combined the active implementation strategy arms and compared it with the no active implementation strategy. We used the 'dmetar' package to pool multiple control or treatment arms (Harrer 2019). For multi‐arm trials with no control group ('no‐intervention' or usual care), we combined the 'more‐intensive' arms and compared it with the 'least‐intensive' implementation strategy arm. Where studies used multiple follow‐up periods, we used data from the final (most recent) study follow‐up.
For the study by Perry and colleagues the standard deviation (SD) in the control group was assumed to be equal to the SD in the treatment group and the two groups were assumed to have equal sample sizes (Perry 2004).
To describe the effects of implementation strategies reported in all included studies, for both non‐RCTs and RCTs, we reported the SMD of the primary review outcome. For continuous measures, we calculated an SMD using reported means and SDs. For dichotomous outcomes, we calculated the odds ratios (ORs) (from the raw n/N (%), i.e. number of events divided by the sample size) and transformed them to an SMD using the methods described in Anzures‐Cabrera and colleagues, where sufficient information was available in the published paper or on request from authors to do so (Anzures‐Cabrera 2011).
Randomised controlled trials
For the primary comparison, where the effects of implementation strategies were compared with a no active implementation strategy (e.g. no strategy or usual care) meta‐analysis was undertaken where possible. For both primary and secondary outcomes, we pooled data from RCTs in random‐effects meta‐analysis using the SMD (and 95% CIs). For primary trial outcomes, we calculated the SMD using the large‐sample approximation to compute sampling variances. We performed meta‐analyses using the 'metafor' package (Viechtbauer 2010). For secondary outcomes, we pooled data using generic inverse variance method using the Review Manager 5 software (Review Manager 2020). We used the random‐effects model in instances where data from five or more studies were available to pool, otherwise we used a fixed‐effect model. We selected postintervention follow‐up data over change‐from‐baseline data for inclusion in the meta‐analysis.
For three cluster‐RCTs, we selected the implementation measure (based on the hierarchy described above) for which clustering had not been accounted for by the original study (Nathan 2020; Sallis 1997; Sutherland 2017). For example, in Sutherland 2017, the implementation measure we selected was clustered at the teacher level; however, comparisons between groups were made using a t‐test.
Given the small number of RCTs reporting economic evaluations or measures of adverse effects, and their considerable heterogeneity, we presented the findings narratively. Similarly, and for the same reasons, we synthesised the findings of RCTs comparing two or more active implementation strategies narratively.
Non‐randomised studies
For the primary comparison, where the effects of implementation strategies were compared with a no active implementation strategy, we synthesised the findings of non‐RCTs based on guidance from the 'Synthesis without meta‐analysis' (SWiM) reporting guidelines (Campbell 2020; McKenzie 2022b). Specifically, for primary review outcomes, we described the findings across studies using vote counting based on the direction of effect (McKenzie 2022b) and reporting of the range of standardised effects and median. For comparisons of two or more active implementation strategies, and for analyses of all secondary outcomes (where standardised effects were not calculated), we summarised the effects of implementation strategies narratively, including the use of vote counting based on the direction of effect.
Subgroup analysis and investigation of heterogeneity
We undertook a preplanned subgroup analysis for studies in which implementation was attempted at scale – defined as 50 or more schools in the intervention group.
Additionally, we described the effects of implementation strategies by the following subgroups:
school type: that is, studies undertaken in elementary (students aged five to 12 years); middle (students aged 11 to 14 years) and high (students aged 12 to 18 years) school or those undertaken across school types (post hoc);
the health behaviour or risk factor targeted by the intervention (diet, physical activity, obesity, tobacco or alcohol) (post hoc).
These groupings were selected as they were considered of interest to public health policymakers and practitioners engaged in the production of the review, were exploratory, and were not prespecified. They were also considered the population and intervention characteristics that may most likely explain any observed heterogeneity. Using pooled data from RCTs, we undertook exploratory analyses to first test for subgroup differences (interaction), then describe the effects of implementation strategies by subgroups, and finally to describe any changes in observed statistical heterogeneity.
Sensitivity analysis
For pooled synthesis of the primary review implementation outcome we performed two sensitivity analyses. In the first, we removed studies from the meta‐analysis with an overall high risk of bias. In the second, we imputed ICC values of 0.01 and 0.05 for cluster‐RCTs that either did not account for clustering in the selected implementation measure and where study authors did not report ICC values.
Summary of findings and assessment of the certainty of the evidence
We generated a summary of findings table to present the key findings of included studies for the main comparison intervention versus no active implementation strategy), based on recommendations of the Cochrane EPOC group and the Cochrane Handbook for Systematic Reviews of Interventions (Table 1; Higgins 2019). The summary of findings table included a list of primary outcome (implementation) in the review, a description of the intervention effect, the number of participants and studies addressing the outcome, and a GRADE assessment for the overall certainty of evidence for each outcome. We used data from RCTs only and for studies reporting the effects of interventions versus no active implementation strategy for the summary of findings table, as this was considered of primary interest to end‐users. We used GRADE to assess the certainty of the body of evidence through consideration of study limitations (inadequate sequence generation, lack of allocation concealment, lack of blinding participants/providers, lack of blinding outcome assessors, loss to follow‐up, selective outcome reporting and other bias), consistency of effect, imprecision, indirectness and publication bias. Two review authors (from SM, RH, KO) independently assessed the overall certainty of evidence using the GRADE system and consulted a third review author (LW) where consensus on any issues arising could not be reached. The certainty of the body of evidence for each individual outcome was graded accordingly as 'high', 'moderate', 'low' and 'very Low' in accordance with the Cochrane Handbook for Systematic Reviews of Interventions (Higgins 2011).
Results
Description of studies
See Characteristics of included studies; Characteristics of excluded studies; and Characteristics of ongoing studies tables.
Results of the search
The searches for the previous review (Wolfenden 2017), and this review update generated 31,156 citations (18,957 previous review; 12,199 this review update), after removal of duplicates. After screening the titles and abstracts, we removed 30,402 titles (18,572 previous review; 11,830 this review update) and reviewed the full texts of 754 records (385 previous review; 369 this review update). Of these, 11 new studies from 19 publications were identified for inclusion in this update, bringing the total number of studies included in this review to 38 (Figure 1). Additionally, we identified 17 ongoing studies (20 records) that are likely to meet the study inclusion criteria (see Characteristics of ongoing studies table).
1.
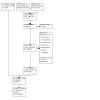
Study flow diagram.
Included studies
Types of studies
Of the 38 included trials 22 were conducted in the USA (Alaimo 2015; Cheung 2018; Cunningham‐Sabo 2003; Delk 2014; Egan 2018; French 2004; Gingiss 2006; Hager 2018; Heath 2002; Hoelscher 2010; Lytle 2006; McCormick 1995; Mobley 2012; Perry 1997; Perry 2004; Sallis 1997; Saunders 2006; Simons‐Morton 1988; Story 2000; Taylor 2018; Whatley Blum 2007; Young 2008), with the remaining trials undertaken in India (Mathur 2016; Saraf 2015), Australia (Hodder 2017; Nathan 2012; Nathan 2016; Nathan 2020; Sutherland 2017; Sutherland 2020; Waters 2017; Wolfenden 2017; Yoong 2016), Canada (Bremer 2018; Naylor 2006), New Zealand (Farmer 2017), the Netherlands (Evenhuis 2020), and South Africa (de Villiers 2015).
In the assessment of implementation outcomes, eight studies employed RCT designs (Cunningham‐Sabo 2003; de Villiers 2015; Lytle 2006; Mobley 2012; Nathan 2016; Saunders 2006; Wolfenden 2017; Yoong 2016), 18 cluster‐RCT designs (Delk 2014; Farmer 2017; French 2004; Hager 2018; Hodder 2017; Mathur 2016; McCormick 1995; Nathan 2020; Naylor 2006; Perry 1997; Perry 2004; Saraf 2015; Story 2000; Sutherland 2017; Sutherland 2020; Taylor 2018; Waters 2017; Young 2008), and 12 non‐RCT designs (Alaimo 2015; Bremer 2018; Cheung 2018; Egan 2018; Evenhuis 2020; Gingiss 2006; Heath 2002; Hoelscher 2010; Nathan 2012; Sallis 1997; Simons‐Morton 1988; Whatley Blum 2007). Trial designs used to evaluate implementation outcomes differed at times from those used to assess secondary outcomes pertaining to student risk factors. For example, Saunders and colleagues assessed school level implementation outcomes (RCT design) as well as the impact of intervention implementation on individual student outcomes located within schools (cluster‐RCT) (Saunders 2006). There was variability in the types of participants, implementation strategies and outcomes reported.
Participants
Trials recruited samples of between two (Taylor 2018) and 723 (Nathan 2012) schools. In five trials, 50 or more schools were allocated to the intervention group to receive implementation support (Alaimo 2015; Cheung 2018; Gingiss 2006; Nathan 2012; Perry 1997). Most trials were conducted in elementary schools catering for children aged five to 12 years (Cheung 2018; Cunningham‐Sabo 2003; de Villiers 2015; Egan 2018; Farmer 2017; Heath 2002; Hoelscher 2010; Nathan 2012; Nathan 2016; Nathan 2020; Naylor 2006; Perry 1997; Perry 2004; Sallis 1997; Simons‐Morton 1988; Story 2000; Sutherland 2017; Taylor 2018; Waters 2017; Wolfenden 2017; Yoong 2016). Eight were conducted in middle schools where children are aged 11 to 14 years (Alaimo 2015; Delk 2014; Gingiss 2006; Lytle 2006; McCormick 1995; Mobley 2012; Saraf 2015; Young 2008), one in both elementary and middle schools (Bremer 2018), and seven in high schools only typically catering for children aged 12 or 13 years to 18 years of age (Evenhuis 2020; French 2004; Hodder 2017; Mathur 2016; Saunders 2006; Sutherland 2020; Whatley Blum 2007). Only one trial recruited from primary, middle and high schools (Hager 2018). Fourteen studies reported they were conducted in low‐income regions or in schools with students from predominantly low‐income households (Alaimo 2015; de Villiers 2015; Farmer 2017; Hager 2018; Heath 2002; Hodder 2017; Hoelscher 2010; Lytle 2006; Mathur 2016; Mobley 2012; Nathan 2012; Sutherland 2017; Sutherland 2020; Waters 2017).
Interventions
There was variability in the implementation strategies employed. All trials comprised of multiple discrete implementation strategies, the most common being: educational materials, educational outreach and educational meetings (Table 2). The EPOC taxonomy descriptors of the implementation strategies employed by included trials are described in (Table 3).
1. Interventions across studies.
| Trial | Audit and feedback | Clinical practice guidelines | Continuous quality improvements |
External funding |
Education games |
Education materials |
Education meeting |
Education outreach visits |
Inter‐ professional education |
Length of consultation |
Local consensus process |
Local opinion leader |
Managerial supervision | Monitoring performance of delivery | Pay for performance | Procurement and distribution of supplies | Tailored intervention |
The use of communication technology |
Other |
| Alaimo 2015 | — | X | — | X | — | X | — | X | — | — | X | — | — | — | — | — | X | — | — |
| Bremer 2018 | — | — | — | — | — | X | X | — | — | — | — | — | — | — | — | — | — | — | X |
| Cheung 2018 | — | — | — | — | — | X | X | — | — | — | — | — | — | — | — | — | X | — | — |
| Cunningham‐Sabo 2003 | — | X | — | — | — | X | X | X | — | — | — | — | — | — | — | — | — | — | — |
| de Villiers 2015 | — | — | — | — | — | X | X | X | — | — | — | X | — | — | — | — | — | — | — |
| Delk 2014 | — | X | — | — | — | — | X | X | — | — | X | — | — | — | — | — | X | — | X |
| Egan 2018 | X | — | — | — | — | — | X | X | — | — | — | — | — | — | — | — | X | — | — |
| Evenhuis 2020 | X | — | — | — | — | X | — | X | — | — | — | — | — | — | — | — | X | — | — |
| Farmer 2017 | X | — | — | X | — | — | — | — | — | — | X | — | — | — | — | — | X | — | — |
| French 2004 | — | — | — | — | — | — | X | — | — | — | X | — | — | — | X | — | X | — | — |
| Gingiss 2006 | — | — | — | X | — | X | X | — | — | X | — | — | — | — | — | — | — | ||
| Hager 2018 | — | — | — | X | — | X | X | — | — | — | — | X | — | — | — | — | X | — | — |
| Heath 2002 | — | — | — | — | — | X | X | X | — | — | — | — | — | — | — | — | — | — | — |
| Hodder 2017 | X | — | — | X | — | X | X | X | — | — | X | — | — | — | — | — | — | — | — |
| Hoelscher 2010 | — | — | — | — | — | X | X | X | — | — | X | — | — | — | X | — | — | X | X |
| Lytle 2006 | — | — | — | — | — | X | X | — | — | — | X | X | — | — | — | — | — | — | — |
| Mathur 2016 | — | — | X | — | — | X | X | — | — | — | X | X | — | — | — | — | — | — | — |
| McCormick 1995 | — | — | — | — | — | X | X | — | — | — | X | — | — | — | — | — | — | — | — |
| Mobley 2012 | — | — | — | X | X | X | X | X | — | — | — | — | — | — | — | — | X | X | X |
| Nathan 2012 | — | — | — | — | — | X | X | — | — | — | X | X | — | X | — | — | X | — | X |
| Nathan 2016 | X | — | X | — | — | X | X | — | — | — | X | X | — | — | — | — | X | — | X |
| Nathan 2020 | — | — | — | — | — | X | — | X | — | — | — | X | — | — | — | — | X | — | X |
| Naylor 2006 | — | — | — | — | — | X | X | X | — | — | X | — | — | — | — | — | X | — | X |
| Perry 1997 | — | — | — | — | — | X | X | X | — | — | — | — | — | — | — | — | — | — | X |
| Perry 2004 | — | — | — | — | — | X | X | X | — | — | X | — | — | — | — | — | — | — | X |
| Sallis 1997 | — | — | — | — | X | X | X | — | X | — | — | — | — | — | — | — | — | X | |
| Saraf 2015 | — | — | — | — | X | X | X | — | — | — | X | X | — | — | — | — | X | — | X |
| Saunders 2006 | — | — | — | — | — | X | X | X | — | — | X | X | — | — | — | — | — | — | X |
| Simons‐Morton 1988 | — | — | — | — | — | X | — | X | — | — | X | X | X | X | — | — | — | — | X |
| Story 2000 | — | — | — | — | — | — | X | — | — | — | — | — | — | — | — | — | — | — | X |
| Sutherland 2017 | X | — | — | — | — | X | X | X | — | — | — | X | — | — | — | — | — | — | X |
| Sutherland 2020 | X | X | — | — | — | X | X | X | X | — | — | X | — | — | — | — | — | — | X |
| Taylor 2018 | — | — | — | X | — | X | — | X | — | — | X | — | — | — | — | — | — | — | X |
| Waters 2017 | — | — | — | — | — | — | — | — | — | — | — | — | — | — | — | — | X | — | — |
| Whatley Blum 2007 | — | X | — | X | — | X | X | X | — | — | X | — | — | — | — | X | — | — | X |
| Wolfenden 2017 | X | — | X | X | — | X | X | X | — | — | X | X | — | — | — | — | X | — | X |
| Yoong 2016 | X | — | X | — | — | X | — | — | — | — | — | — | — | — | — | — | X | — | — |
| Young 2008 | — | — | — | — | — | X | X | X | X | — | X | X | — | — | — | — | — | — | — |
2. Definition of Effective Practice and Organisation of Care (EPOC) subcategories utilised in the review.
| EPOC subcategory | Definition |
| Audit and feedback | A summary of health workers’ performance over a specified period of time, given to them in a written, electronic or verbal format. The summary may include recommendations for clinical action. |
| Clinical practice guidelines | Clinical guidelines are systematically developed statements to assist healthcare providers and patients to decide on appropriate health care for specific clinical circumstances'(US IOM). |
| Educational materials | Distribution to individuals, or groups, of educational materials to support clinical care, i.e. any intervention in which knowledge is distributed. For example this may be facilitated by the Internet, learning critical appraisal skills; skills for electronic retrieval of information, diagnostic formulation; question formulation. |
| Educational meetings | Courses, workshops, conferences or other educational meetings. |
| Educational outreach visits, or academic detailing | Personal visits by a trained person to health workers in their own settings, to provide information with the aim of changing practice. |
| External funding | Financial contributions such as donations, loans, etc. from public or private entities from outside the national or local health financing system. |
| Inter‐professional education | Continuing education for health professionals that involves > 1 profession in joint, interactive learning. |
| Length of consultation | Changes in the length of consultations. |
| Local consensus processes | Formal or informal local consensus processes, for example agreeing a clinical protocol to manage a patient group, adapting a guideline for a local health system or promoting the implementation of guidelines. |
| Local opinion leaders | The identification and use of identifiable local opinion leaders to promote good clinical practice. |
| Managerial supervision | Routine supervision visits by health staff. |
| Monitoring the performance of the delivery of healthcare | Monitoring of health services by individuals or healthcare organisations, for example by comparing with an external standard. |
| Other | Strategies were classified as other if they did not clearly fit within the standard subcategories. |
| Pay for performance – target payments | Transfer of money or material goods to healthcare providers conditional on taking a measurable action or achieving a predetermined performance target, for example incentives for lay health workers. |
| Procurement and distribution of supplies | Systems for procuring and distributing drugs or other supplies. |
| Tailored interventions | Interventions to change practice that are selected based on an assessment of barriers to change, for example through interviews or surveys. |
| The use of information and communication technology | Technology based methods to transfer healthcare information and support the delivery of care. |
Seventeen trials tested strategies to implement healthy eating policies, programmes or practices (Alaimo 2015; Cunningham‐Sabo 2003; de Villiers 2015; Evenhuis 2020; French 2004; Heath 2002; Lytle 2006; Mobley 2012; Nathan 2012; Nathan 2016; Perry 2004; Simons‐Morton 1988; Story 2000; Taylor 2018; Whatley Blum 2007; Wolfenden 2017; Yoong 2016), 12 tested strategies targeting physical activity policies or practices (Bremer 2018; Cheung 2018; Delk 2014; Egan 2018; Farmer 2017; Nathan 2020; Naylor 2006; Sallis 1997; Saunders 2006; Sutherland 2017; Sutherland 2020; Young 2008), and three targeted tobacco policies and practices (Gingiss 2006; Mathur 2016; McCormick 1995). Six trials targeted a combination of health behaviours, with four examining implementation of healthy eating and physical activity policies or practices (Hager 2018; Hoelscher 2010; Perry 1997; Waters 2017), and one trial examining policies or practices to improve implementation of tobacco control, healthy eating and physical activity initiatives (Saraf 2015). One trial examined tobacco and alcohol use (Hodder 2017).
Outcomes
Three trials collected implementation outcome (primary) follow‐up data up to six months postbaseline (Bremer 2018; Evenhuis 2020; Sutherland 2017), three trials at more than six to 11 months (Nathan 2020; Naylor 2006; Taylor 2018), one trial at 11 to 15 months (Nathan 2012) and 18 trials at 12 to 14 months (Cheung 2018; Delk 2014; Egan 2018; Farmer 2017; Hager 2018; Heath 2002; Hoelscher 2010; Mathur 2016; McCormick 1995; Nathan 2016; Saraf 2015; Saunders 2006; Simons‐Morton 1988; Story 2000; Sutherland 2020; Whatley Blum 2007; Wolfenden 2017; Yoong 2016). Another six trials collected follow‐up data at two years postbaseline (Alaimo 2015; Cunningham‐Sabo 2003; French 2004; Gingiss 2006; Perry 2004; Young 2008), one collected data at two and a half years (Sallis 1997), four trials at three years (de Villiers 2015; Hodder 2017; Lytle 2006; Perry 1997), and two at three and a half years (Mobley 2012; Waters 2017).
Eight trials used observation‐based measures to assess implementation outcomes (primary outcomes) (French 2004; Lytle 2006; Mathur 2016; Perry 2004; Sallis 1997; Story 2000; Sutherland 2017; Whatley Blum 2007). A further 10 trials used school records or documents (Cunningham‐Sabo 2003; Delk 2014; Evenhuis 2020; Heath 2002; Mobley 2012; Nathan 2016; Perry 1997; Taylor 2018; Wolfenden 2017; Yoong 2016). One school conducted chemical analysis (Simons‐Morton 1988), one school had researchers complete an implementation checklist (McCormick 1995), and one school conducted situational analysis (de Villiers 2015). Sixteen studies asked staff members (principals, teachers, canteen personnel, etc.) to complete surveys, interviews, checklists or activity logs (Alaimo 2015; Bremer 2018; Cheung 2018; Egan 2018; Farmer 2017; Gingiss 2006; Hager 2018; Hodder 2017; Nathan 2012; Nathan 2020; Naylor 2006; Saraf 2015; Saunders 2006; Sutherland 2020; Waters 2017; Young 2008). One study surveyed students on teacher‐led physical activity breaks (Hoelscher 2010).
Twelve trials assessed student physical activity (secondary outcome) at follow‐up (Bremer 2018; Farmer 2017; Hoelscher 2010; Nathan 2020; Naylor 2006; Perry 1997; Sallis 1997; Saraf 2015; Saunders 2006; Sutherland 2017; Waters 2017; Young 2008). Physical activity behaviours were assessed using accelerometer (Farmer 2017; Nathan 2020; Sutherland 2017; Young 2008), pedometer (Naylor 2006), participant recall (Saunders 2006), student or parent (or both) questionnaire (Bremer 2018; Saraf 2015; Waters 2017), observation (Hoelscher 2010; Perry 1997), and fitness‐tests (Sallis 1997). Seventeen trials assessed child nutritional intake or food selection, 13 using questionnaires (Alaimo 2015; Cunningham‐Sabo 2003; de Villiers 2015; Evenhuis 2020; French 2004; Hoelscher 2010; Lytle 2006; Mobley 2012; Saraf 2015; Simons‐Morton 1988; Story 2000; Waters 2017; Whatley Blum 2007), three using observation (Perry 2004; Taylor 2018; Wolfenden 2017). and one using menu and recipe data (Perry 1997). Eleven trials collected anthropometric measures, assessed objectively, from participants (Cunningham‐Sabo 2003; Farmer 2017; Heath 2002; Hoelscher 2010; Mobley 2012; Naylor 2006; Perry 1997; Sallis 1997; Saunders 2006; Waters 2017; Young 2008). Three trials assessed tobacco use, two using questionnaires (Hodder 2017; Saraf 2015) and one used observational data (Mathur 2016). One trial assessed student alcohol use via a questionnaire (Hodder 2017).
Three trials included a measure that was specified in the study methods as an assessment of potential unintended adverse effects (Mobley 2012; Taylor 2018; Wolfenden 2017), and three trials reported cost analyses (Heath 2002; Mobley 2012; Taylor 2018).
Types of comparisons
Of the 38 included studies, 29 compared the implementation strategy to no intervention, usual care/minimal support comparison group (Alaimo 2015; Bremer 2018; Cheung 2018; de Villiers 2015; Egan 2018; Evenhuis 2020; Farmer 2017; French 2004; Hager 2018; Hodder 2017; Lytle 2006; Mathur 2016; McCormick 1995; Mobley 2012; Nathan 2012; Nathan 2016; Nathan 2020; Naylor 2006; Perry 1997; Perry 2004; Sallis 1997; Saunders 2006; Sutherland 2017; Sutherland 2020; Taylor 2018; Waters 2017; Whatley Blum 2007; Wolfenden 2017; Yoong 2016). Two were comparative effectiveness studies (Delk 2014; Hoelscher 2010), and seven studies did not describe the comparison condition and so we assumed the comparison was usual practice (Cunningham‐Sabo 2003; Gingiss 2006; Heath 2002; Saraf 2015; Simons‐Morton 1988; Story 2000; Young 2008) (therefore, 36 studies included in the intervention versus non‐intervention, usual care/minimal support comparison).
Of the 36 studies that compared the implementation strategy to a control group, 33 compared to usual practice or waitlist control (usual practice: Alaimo 2015; Bremer 2018; Cheung 2018; Egan 2018; Evenhuis 2020; Farmer 2017; French 2004; Hager 2018; Hodder 2017; Lytle 2006; Mathur 2016; Mobley 2012; Nathan 2016; Nathan 2020; Naylor 2006; Perry 1997; Perry 2004; Sallis 1997; Saunders 2006; Sutherland 2017; Sutherland 2020; Taylor 2018; Waters 2017; Whatley Blum 2007; Wolfenden 2017; Yoong 2016; minimal support control (waitlist): de Villiers 2015; McCormick 1995; Nathan 2012). Of those comparing to minimal support, schools in Nathan 2012 received support (unspecified) from a non‐government agency to assist with implementation of a fruit and vegetable break if this was sought. In McCormick 1995, control schools received curricula in the post and technical assistance upon request. In de Villiers 2015, principals at schools in the control arm received a booklet with "tips" for healthy schools and a guide to resources that could be accessed to assist in creating a healthier school environment.
Thirty‐one of the studies that compared the implementation strategy to a control group were two arm trials (Bremer 2018; Cheung 2018; Cunningham‐Sabo 2003; de Villiers 2015; Evenhuis 2020; Farmer 2017; French 2004; Gingiss 2006; Heath 2002; Hodder 2017; Lytle 2006; Mathur 2016; McCormick 1995; Mobley 2012; Nathan 2012; Nathan 2016; Nathan 2020; Perry 2004; Sallis 1997; Saraf 2015; Saunders 2006; Simons‐Morton 1988; Story 2000; Sutherland 2017; Sutherland 2020; Taylor 2018; Waters 2017; Whatley Blum 2007; Wolfenden 2017; Yoong 2016; Young 2008), and five included more than two trial arms (Alaimo 2015; Egan 2018; Hager 2018; Naylor 2006; Perry 1997).
In the Child and Adolescent Trial for Cardiovascular Health (CATCH) trial, schools were randomly assigned to either an experimental condition or a control condition (Perry 1997). Of the 56 schools assigned to intervention, 28 schools were randomly assigned to an experimental arm targeting the same implementation outcomes and including the same implementation strategies, but were also asked to implement programmes targeting families. Implementation data for the two intervention groups were combined in the reporting of the paper and the combined data used in this review. The Sports, Play, and Active Recreation for Kids (SPARK) trial randomised schools to two active strategies and one control condition (Sallis 1997). Data were only extracted for two of the three assigned groups; the control group where implementation support was not provided and an experimental group where implementation support was provided to usual teaching staff to implement the intervention. The third group, where physical activity practices were implemented by external specialist physical education teachers hired by the research team was excluded as per review inclusion criteria. Of the two studies that were comparative effectiveness trials, Hoelscher 2010 had four comparison groups which were split into two categories; high and low implementers. The low implementers included a control group and an intervention group which only received one strategy. The high implementers contained two groups, one which received two and the other which received three implementation strategies. Delk 2014 had three comparison groups included, one which received the basic training only intervention (Basic), one which received the basic training only intervention plus facilitator support (Basic Plus), and a third which received the basic training only intervention plus facilitator support and a social marketing campaign (Basic Plus SM).
Excluded studies
We considered 330 papers to be ineligible. Primary reasons for exclusion included inappropriate: outcome (204 papers); study design (71 papers); intervention (17 papers); duplicates (15 papers); comparator (13 papers); setting (eight papers) and population (two papers). Studies were excluded based on 'inappropriate outcomes' if they: did not report any implementation outcomes; did not report implementation outcomes for both intervention and control groups; or did not report between‐group differences in implementation outcomes. In the Characteristics of excluded studies table, we reported a subset of key excluded studies. A full list of excluded studies is available on request.
Risk of bias in included studies
Assessment of risk of bias considered study design and reporting characteristics relevant to the implementation outcomes of the included studies (Figure 2; Figure 3). Risk of bias assessments for secondary outcomes are available in the Characteristics of included studies table.
2.
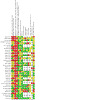
Risk of bias summary: review authors' judgements about each risk of bias item for each included study.
3.
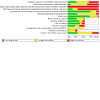
Risk of bias graph: review authors' judgements about each risk of bias item presented as percentages across all included studies.
Allocation
All 12 non‐RCTs had a high risk of selection bias for both random sequence generation and concealment of allocation (Alaimo 2015; Bremer 2018; Cheung 2018; Egan 2018; Evenhuis 2020; Gingiss 2006; Heath 2002; Hoelscher 2010; Nathan 2012; Sallis 1997; Simons‐Morton 1988; Whatley Blum 2007). For the 18 trials with cluster‐RCT designs, seven were considered low risk for random sequence generation (Farmer 2017; Hodder 2017; Nathan 2020; Saraf 2015; Sutherland 2017; Sutherland 2020; Waters 2017). Four of the eight trials using RCT designs were considered low risk for random sequence generation (de Villiers 2015; Nathan 2016; Wolfenden 2017; Yoong 2016). The remaining 15 trials were at unclear risk of selection bias (Cunningham‐Sabo 2003; Delk 2014; French 2004; Hager 2018; Lytle 2006; Mathur 2016; McCormick 1995; Mobley 2012; Naylor 2006; Perry 1997; Perry 2004; Saunders 2006; Story 2000; Taylor 2018; Young 2008). The bias for concealment was unclear for nine RCTs (Cunningham‐Sabo 2003; de Villiers 2015; Hager 2018; Lytle 2006; Mobley 2012; Nathan 2016; Saunders 2006; Wolfenden 2017; Yoong 2016). One RCT was at high risk of concealment bias (Taylor 2018). One cluster‐RCT was at risk of bias (Farmer 2017). Three cluster were at low risk of concealment bias (Nathan 2020; Sutherland 2020; Waters 2017). The remaining 12 cluster‐RCTs were at unclear risk of concealment bias (Delk 2014; French 2004; Hodder 2017; Mathur 2016; McCormick 1995; Naylor 2006; Perry 1997; Perry 2004; Sallis 1997; Story 2000; Sutherland 2017; Young 2008).
Blinding
All studies were considered to have high risk of performance bias, due to participants and research personnel not being blind to group allocation.
Only six studies had a low risk for implementation outcome assessment (detection bias), as this was conducted by staff who were blind to group allocation (Mobley 2012; Nathan 2016; Sutherland 2017; Taylor 2018; Wolfenden 2017; Yoong 2016). Of the remaining 33 studies, detection bias was high for 26 studies primarily due to the use of self‐report measures (Bremer 2018; Cunningham‐Sabo 2003; Delk 2014; de Villiers 2015; Egan 2018; Evenhuis 2020; Farmer 2017; French 2004; Gingiss 2006; Hager 2018; Heath 2002; Hodder 2017; Hoelscher 2010; Mathur 2016; McCormick 1995; Nathan 2012; Nathan 2020; Naylor 2006; Perry 1997; Perry 2004; Saraf 2015; Saunders 2006; Story 2000; Sutherland 2020; Waters 2017; Young 2008). For six studies, the risk of detection bias was unclear (Alaimo 2015; Cheung 2018; Lytle 2006; Sallis 1997; Simons‐Morton 1988; Whatley Blum 2007).
Incomplete outcome data
For 28 studies, the risk of attrition bias was low, as either all or most schools were still participating in the study at follow‐up, and their data included in the analyses. Three studies had a high attrition bias (Delk 2014; Gingiss 2006; McCormick 1995). In particular, Gingiss 2006 reported 25 (19%) schools were lost for the survey of the school principal and 50 (37%) schools were lost for the Health Co‐ordinator survey. Attrition bias was unclear for seven studies (Bremer 2018; Farmer 2017; Hager 2018; Nathan 2020; Naylor 2006; Sallis 1997; Taylor 2018). For the remaining studies, the risk of attrition bias was low.
Selective reporting
Assessed at a study level, the risk of reporting bias was low for 12 studies as protocols, design papers or reports were available, and they reported all a priori determined outcomes (Bremer 2018; Cunningham‐Sabo 2003; de Villiers 2015; Evenhuis 2020; Mathur 2016; Mobley 2012; Nathan 2016; Naylor 2006; Sutherland 2017; Wolfenden 2017; Yoong 2016; Young 2008). Three studies were at high risk of reporting bias as not all a priori outcomes that were mentioned in study protocols were reported at the time of screening (Farmer 2017; Hodder 2017; Nathan 2020). A total of 23 trials did not have a published protocol paper or trial registration record and, therefore, it was unclear whether reporting bias had occurred.
Other potential sources of bias
A total of 27 studies were at low risk of other bias. Ten studies were at unclear risk for other sources of bias as they were unclear if at risk of contamination (Bremer 2018; Cunningham‐Sabo 2003; Delk 2014; Gingiss 2006; Hager 2018; Hodder 2017; Nathan 2020; Perry 2004; Saraf 2015; Waters 2017). One study was at high risk of other sources of bias as it appeared to be at high risk of contamination (Taylor 2018).
Risk of bias in cluster studies
Eighteen studies used a cluster‐RCT design (Delk 2014; Farmer 2017; French 2004; Hager 2018; Hodder 2017; Mathur 2016; McCormick 1995; Nathan 2020; Naylor 2006; Perry 1997; Perry 2004; Saraf 2015; Story 2000; Sutherland 2017; Sutherland 2020; Taylor 2018; Waters 2017; Young 2008). Therefore, we assessed the potential risk of additional biases for this group. Three non‐RCTs also accounted for clustering and were assessed against additional bias domains (Bremer 2018; Cheung 2018; Evenhuis 2020).
Recruitment to cluster
For the potential risk of recruitment (to cluster) bias, 11 studies were at low risk as randomisation to groups occurred either after recruitment or after baseline assessment (French 2004; Hager 2018; Mathur 2016; Naylor 2006; Perry 1997; Perry 2004; Saraf 2015; Story 2000; Sutherland 2017; Sutherland 2020; Young 2008). One study was at high risk of bias as baseline data collection occurred prior to randomisation; however, they reconsented at each data point for follow‐up evaluations (Waters 2017). Nine studies had an unclear risk of bias (Bremer 2018; Cheung 2018; Delk 2014; Evenhuis 2020; Farmer 2017; Hodder 2017; McCormick 1995; Nathan 2020; Taylor 2018).
Baseline imbalance
Regarding risk of bias due to baseline imbalances, 14 studies had a low risk due to the random allocation of schools to experimental groups, stratification by school characteristics, or adjustments for baseline differences being made within the analyses (Cheung 2018; Delk 2014; Evenhuis 2020; Farmer 2017; French 2004; Hager 2018; McCormick 1995; Nathan 2020; Perry 1997; Perry 2004; Story 2000; Sutherland 2017; Sutherland 2020; Young 2008), and four studies were at unclear risk (Hodder 2017; Mathur 2016; Naylor 2006; Saraf 2015). The remaining three studies had high risk of bias (Bremer 2018; Taylor 2018; Waters 2017).
Loss of clusters
Fifteen studies were at low risk of bias regarding loss of clusters (Evenhuis 2020; French 2004; Hager 2018; Hodder 2017; Mathur 2016; McCormick 1995; Nathan 2020; Naylor 2006; Perry 1997; Perry 2004; Saraf 2015; Story 2000; Sutherland 2020; Taylor 2018; Young 2008). Two studies were at unclear risk of bias (Bremer 2018; Farmer 2017). Four studies were at high risk of bias (Cheung 2018; Delk 2014; Sutherland 2017; Waters 2017).
Incorrect analysis
Nine studies had a low risk for incorrect analysis as the appropriate statistical analysis was undertaken to allow for clustering within groups (Cheung 2018; Evenhuis 2020; Farmer 2017; Nathan 2020; Naylor 2006; Perry 1997; Sutherland 2020; Waters 2017; Young 2008). Seven studies were at high risk for incorrect analysis (Delk 2014; Hager 2018; Mathur 2016; McCormick 1995; Saraf 2015; Story 2000; Taylor 2018), while for five studies the analysis performed was unclear (Bremer 2018; French 2004; Hodder 2017; Perry 2004; Sutherland 2017).
Compatibility with individually randomised trials
All 21 cluster‐RCTs and clustered, non‐RCTs were at unclear risk for compatibility with individually randomised trials as we were unable to determine whether a herd effect existed (behaviour of people in a group acting collectively without centralised direction).
Potential confounding for non‐randomised trials
For the 12 studies with non‐RCT designs, one was at low risk of bias as adjustments were made for confounding (Cheung 2018). For eight studies, it was unclear whether confounders were adequately adjusted for (Alaimo 2015; Bremer 2018; Egan 2018; Evenhuis 2020; Heath 2002; Hoelscher 2010; Sallis 1997; Whatley Blum 2007). Three studies were at high risk of bias due to potentially confounding factors (Gingiss 2006; Nathan 2012; Simons‐Morton 1988).
Overall risk of bias
Twelve studies were at low overall risk of bias (de Villiers 2015; Evenhuis 2020; Mobley 2012; Nathan 2016; Naylor 2006; Perry 1997; Story 2000; Sutherland 2017; Sutherland 2020; Wolfenden 2017; Yoong 2016; Young 2008). Sixteen were at an unclear overall risk of bias (Bremer 2018; Cheung 2018; Cunningham‐Sabo 2003; Delk 2014; Farmer 2017; French 2004; Hager 2018; Hodder 2017; Lytle 2006; Mathur 2016; McCormick 1995; Nathan 2020; Perry 2004; Sallis 1997; Saraf 2015; Saunders 2006). Ten studies were at a high risk of overall bias (Alaimo 2015; Egan 2018; Gingiss 2006; Heath 2002; Hoelscher 2010; Nathan 2012; Simons‐Morton 1988; Taylor 2018; Waters 2017; Whatley Blum 2007).
Effects of interventions
See: Table 1
Implementation strategies compared with usual care or minimal support control
Meta‐analysis of randomised trials
Twenty‐five RCTs compared an implementation strategy with a usual care or minimal support control. Twenty‐two of these were included in a meta‐analysis. Relative to the comparison, there was a large effect, supporting improved implementation among schools receiving implementation support, although there was evidence of considerable heterogeneity (SMD 1.04, 95% CI 0.74 to 1.34; I2 = 82.4%; 1917 participants; low‐certainty evidence; Figure 4). Visual inspection of the funnel plot was suggestive of publication bias; however, trimfill analyses of the distribution of effects found no missing studies on either the left or right side of the pooled point estimated (Figure 5). There were similar effects sizes following sensitivity analyses removing three trials at high risk of bias (SMD 1.02, 95% CI 0.71 to 1.33; I2 = 86.0%; Figure 6), and when ICC of 0.01 (SMD 1.04; 95% CI 0.73 to 1.35; I2 = 82.5%; Figure 7) and an ICC of 0.05 (SMD 1.04, 95% CI 0.73 to 1.35; I2 = 81.9%; Figure 8) were assumed for trials that had not adjusted for clustering.
4.
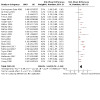
Forest plot of primary outcome (implementation).
5.
Funnel plot for primary outcome (implementation).
6.
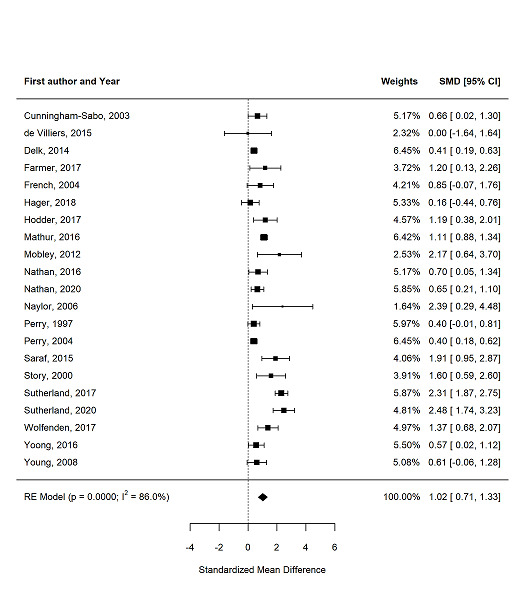
Sensitivity analysis – standardised mean difference between implementation and control groups in implementation trials, excluding trials with a high risk of bias.
7.

Sensitivity analysis – standardised mean difference between implementation and control groups in implementation trials, with effective sample size calculated using an intracluster correlation coefficient of 0.01.
8.

Sensitivity analysis – Standardised mean difference between implementation and control groups in implementation trials, with effective sample size calculated using an intracluster correlation coefficient of 0.05.
Narrative synthesis of non‐randomised trials
The direction of effect reported in 10 of the 11 non‐RCTs favoured the group receiving implementation support, compared with a usual practice or minimal support control (Table 4). Among the eight non‐RCTs where standardised effects (SMD) could be calculated, the effects ranged from 0.30 to 6.90 with a median of 0.59, with no trial reporting a 'small' effect and three a 'large' effect (Alaimo 2015; Egan 2018; Evenhuis 2020; Gingiss 2006; Nathan 2012; Sallis 1997; Simons‐Morton 1988; Whatley Blum 2007).
3. Summary of intervention, measures and absolute intervention effect size in included studies.
| Author, date Design | Targeted risk factors | Implementation strategy (according to the EPOC taxonomy) | Comparison | Measures, length of follow‐up, measurement type | Author reported effect size | Standardised effect size: SMD |
| Randomised and cluster randomised trials | ||||||
|
Cunningham‐Sabo 2003 cRCTa |
Nutrition | Clinical practice guidelines, educational materials, educational meetings, educational outreach visits or academic detailing | Usual practice | % calories total fat breakfast (less is better), 2 years, 5‐day menu and recipe data collection. | FU LS mean −3.3 (SE 1.50); P = 0.03 | 0.66 (95% CI 0.02 to 1.30) |
|
de Villiers 2015 cRCTa |
Nutrition | Local opinion leaders, educational materials, educational outreach visits, educational meetings | Minimal support control | % schools with nutrition related policy (more is better), 3 years, situational analysis (included a structured interview with the school principal and completion of an observation schedule). | No effect estimate between groups reported. FU n/N: intervention 7/8; control 7/8 |
0 (95% CI −1.64 to 1.64) |
|
French 2004 cRCT |
Nutrition | Local consensus processes, tailored intervention, educational meetings, pay for performance | Usual practice or waitlist control | % low fat à la carte foods (more is better), 2 years, observation of lunchtime meals offered. | No effect estimate between groups reported. FU mean: intervention 42.0 (range 28–58); control 27.7 (16–39) |
0.85 (95% CI −0.07 to 1.76) |
|
Hager 2018 cRCT |
Nutrition, PA | Tailored interventions, educational meetings, external funding, educational materials, local opinion leaders | Usual practice or waitlist control | Implementation score (more is better), 1 year, online survey. | FU mean: 0.70; P = 0.501b | 0.16 (95% CI −0.44 to 0.76) |
|
Lytle 2006 cRCTa |
Nutrition | Educational materials, educational meetings, local opinion leaders, local consensus processes | Usual practice or waitlist control | % of items in the foods to promote category (more is better), 3 years, 5‐day service observations. | P = 0.04 (1‐tailed test), no other data reported | NA |
|
Mobley 2012 cRCTa |
Nutrition | Educational games, educational meetings, external funding, tailored intervention, educational materials, educational outreach or academic detailing, other, the use of information and communication technology | Usual practice or waitlist control | % eliminate milk > 1% fat, all other added sugar beverages and 100% juice only served in < 150 g (more is better), about 3.5 years, data collection on all food/beverage product labels. | No effect estimate between groups reported. FU %: intervention 94%; control 6% |
2.17 (95% CI 0.64 to 3.70) |
|
Nathan 2016 cRCTa |
Nutrition | Audit and feedback, continuous quality improvement, education materials, education meeting, local consensus process, local opinion leader, tailored intervention, other | Usual practice | Healthy canteen items represent > 50% of products listed on the menu (more is better), 1 year, canteen menu audits. | FU RR (95% CI): 2.03 (95% CI 1.01 to 4.08); P = 0.03 | 0.70 (95% CI 0.05 to 1.34) |
|
Perry 1997 cRCT |
Nutrition, PA | Educational materials, educational meetings, educational outreach visits or academic detailing, other | Usual practice or waitlist control | Cholesterol in lunches provided (mean milligrams) (less is better), 3 years, menu analysis. | FU mean (SD): intervention 74.9 (SD 18.8); control 83.2 (SD 22.6), P = significant difference | 0.40 (95% CI −0.01 to 0.81) |
|
Perry 2004 cRCT |
Nutrition | Educational meetings, educational outreach visits or academic detailing, educational materials, local consensus processes, other | Usual practice or waitlist control | Number of fruits and vegetables available at cafeteria (more is better), 2 years, canteen observations. | FU MD 0.48 (SE 0.11); P < 0.01 | 0.40 (95% CI 0.18 to 0.62) |
|
Saraf 2015 cRCT |
Nutrition, PA and tobacco | Educational games, educational materials, educational meetings, local consensus processes, local opinion leaders, tailored Interventions, other | Usual practice | Schools having a healthy food policy (more is better), 1 year, survey data. | FU n/N: intervention 16/19; control 3/21; P < 0.01 | 1.91 (95% CI 0.95 to 2.87) |
|
Story 2000 cRCT |
Nutrition | Educational meetings, other | Usual practice | Mean number of fruit and vegetable choices available at cafeteria (more is better), 1 year, observation of food service staff. | No effect estimate between groups reported. Data for 4th and 5th year combined by review authors FU mean: intervention 4.05 (SD 0.66), control 2.9 (SD 0.68) |
1.60 (95% CI 0.59 to 2.60) |
|
Taylor 2018 cRCTa |
Nutrition | Incentives, educational materials, educational outreach visits or academic detailing | Usual practice or waitlist control | Number of fruit items offered daily at cafeteria (more is better), 9 months, based on produce expenditure. | FU mean: intervention 4.17 (SD 0.98); control 4.17 (SD 0.75); P = 1.00 | 0 (95% CI −1.13 to 1.13) |
|
Waters 2017 cRCT |
Nutrition, PA | Educational materials, educational outreach visits or academic detailing; local consensus approach, tailored interventions | Usual practice | Existence of Healthy Eating Policy (more is better), 3.5 years, principal survey. | No effect estimate between groups reported. FU n (%): intervention 9 (75%); control 2 (20%) |
1.52 (95% CI 0.31 to 2.73) |
|
Wolfenden 2017 cRCTa |
Nutrition | Audit and feedback, continuous quality improvement, external funding, education materials, education meeting, education outreach visits or academic detailing, local consensus process, local opinion leader, tailored intervention | Usual practice | Healthy items represented > 50% of canteen menu (more is better), 12–14 months, menu assessment. | FU RR 3.06 (95% CI 1.64 to 5.68); P < 0.01 | 1.37 (95% CI 0.68, 2.07) |
|
Yoong 2016 cRCTa |
Nutrition | Audit and feedback, continuous quality improvement, education materials, tailored intervention | Usual practice | Percentage of green (healthy) items on canteen menu (more is better), 12 months, menu audit. | FU estimate difference 10.55 (95% CI 2.06 to 19.05); P = 0.014 | 0.57 (95% CI 0.02 to 1.12) |
|
Farmer 2017 cRCT |
PA | Incentives, local consensus approach, tailored interventions | Usual practice | Play space evaluation score (total) (more is better), 1 year, principal survey. | FU MD 4.50 (95% CI 1.82 to 7.18); P = 0.005 | 1.20 (95% CI 0.13 to 2.26) |
|
Nathan 2020 cRCT |
PA | Educational outreach visits, centralised technical support, mandate change, identify and prepare champions, provide ongoing consultation, educational material | Usual practice | Teacher implementation (minutes) of a PA policy (structured physical activities) across the week (more is better), 9 months, teacher log book data. | FU MD 36.60 (95% CI 2.68 to 70.51); P = 0.04 | 0.65 (95% CI 0.21 to 1.10) |
|
Naylor 2006 cRCT |
PA | Educational materials, educational meetings, educational outreach meetings or academic detailing, local consensus process, other, tailored interventions | Usual practice or waitlist control | Minutes per week of planned PA (more is better), 11 months, teacher activity log. | No effect estimate between groups reported. FU mean: usual practice schools: 91.4 (95% CI 70.7 to 112.2); champion schools: 137.8 (95% CI 117.0 to 158.6); liaison schools: 154.8 (95% CI 136.6 to 173.0) |
2.39 (95% CI 0.29 to 4.48) |
|
Saunders 2006 cRCTa |
PA | Educational materials, educational meetings, educational outreach visits or academic detailing, local consensus processes, local opinion leaders, other | Usual practice or waitlist control | Implementation score (more is better), 12 months, survey. | Did not report aggregate results by group | NA |
|
Sutherland 2017 cRCT |
PA | Audit and feedback, education materials, education meeting, education outreach visits or academic detailing, local opinion leader, other | Usual practice or waitlist control | Overall lesson quality score (more is better), 6 months, observation checklist. | FU mean: intervention 57.5; control 36.0; P < 0.0b | 2.31 (95% CI 1.87 to 2.75) |
|
Sutherland 2020 cRCT |
PA | Audit and feedback, educational materials, educational meetings, educational outreach visits or academic detailing, clinical practice guidelines, interprofessional education, local opinion leaders, other | Usual practice | Mean number of PA practices implemented (more is better), 12 months, survey. | FU MD 3.2 (95% CI 2.5 to 3.9); P < 0.001 | 2.48 (95% CI 1.74 to 3.23) |
|
Young 2008 cRCT |
PA | Education materials, education meetings, educational outreach visits or academic detailing, interprofessional education, local consensus processes, local opinion leaders | Usual practice | Mean number of PA programmes implemented semesters 1–4 (more is better), 2 years, survey. | FU mean: intervention 15.2 (SD 10.8); control 10.1 (SD 4.0); P = 0.8 | 0.61 (95% CI −0.06 to 1.28) |
|
Hodder 2017 cRCT |
Tobacco, alcohol | Educational outreach visits, educational meetings, local consensus processes, educational materials, external funding, audit and feedback | Usual practice | Number of programmes components used by teachers (more is better), 3 years, survey. | FU mean: intervention 3.1 (SD 1.83); control 1.2 (SD 0.87); P = 0.004 | 1.19 (95% CI 0.38 to 2.01) |
|
Mathur 2016 cRCT |
Tobacco | Local opinion leader, continuous quality improvement, education materials, education meeting, local consensus process | Usual practice or waitlist control | School policy or rule specifically prohibiting smokeless tobacco use inside school (more is better), 12 months, policy observation checklist. | FU OR 7.54 (95% CI 4.92, 11.60); P value not reported | 1.11 (95% CI 0.88 to 1.34) |
|
McCormick 1995 cRCT |
Tobacco | Educational meetings, local consensus processes, educational materials | Minimal support control | Number of curriculum activities taught by each teacher, 1 year, implementation checklist. | FU mean: intervention 68.11; control 67.99; P = not significantb | NA |
| Non‐randomised controlled trials and cluster non‐randomised controlled trials | ||||||
|
Alaimo 2015 Non‐randomised |
Nutrition | Clinical practice guidelines, educational materials, educational outreach visits or academic detailing, external funding, local consensus processes, tailored interventions | Usual practice or waitlist control | Mean nutrition education and practice score (more is better), 2 years, survey. | FU mean: intervention 5.9 (SD 3.2); control 4.8 (SD 3.7); P = not significant | 0.32 (95% CI −0.23 to 0.87) |
|
Evenhuis 2020 Non‐randomised |
Nutrition | Educational materials, educational meeting, audit with feedback, educational outreach visit or academic detailing | Waitlist control | Healthy products available in the cafeteria (more is better), 6 months, audit by canteen supervisor. | FU mean: intervention 77.20 (SD 13.41); control 60.10 (SD 15.67); P = not significant | 1.12 (95% CI 0.18 to 2.07) |
|
Heath 2002 Non‐randomised |
Nutrition | Educational materials, educational meetings, educational outreach visits or academic detailing | Usual practice | % of fat in breakfast served (less is better), 12 months, menu and recipe audit. | FU %: intervention 20.0%; control 19.2%; P = not significantb | NA |
|
Nathan 2012 Non‐randomised |
Nutrition | Educational materials, educational meetings, local consensus processes, local opinion leaders, other, monitoring the performance of the delivery of the healthcare, tailored interventions | Minimal support control | Prevalence of fruit and vegetable break (more is better), 11–15 months, principal report. | FU OR 1.91 (95% CI 1.47 to 2.48); P < 0.1 | 0.59 (95% CI 0.32 to 0.86) |
|
Simons‐Morton 1988 Non‐randomised |
Nutrition | Educational materials, educational outreach visits or academic detailing, local consensus processes, local opinion leaders, managerial supervision, monitoring of performance, other | Usual practice | Fat content in grams per 100 g school cafeteria lunches served (less is better), 1 year, chemical analysis. | No effect estimate between groups reported. FU mean: intervention school 1: −1.8; intervention school 2: −3.4; control school 1: −1.1; control school 2: 0.3 |
0.36 (95% CI 0.07 to 0.66) |
|
Whatley Blum 2007 Non‐randomised |
Nutrition | Clinical practice guidelines, educational materials, educational meetings, educational outreach visits or academic detailing, external funding, distribution of supplies, local consensus process, other | Usual practice or waitlist control | % meeting nutrient and proportion criteria – à la carte (more is better), 1 year, observations. | No effect estimate between groups reported. FU mean: intervention 69.2 (SD 3.7); control 23.3 (SD 7.6) |
6.90 (95% CI 2.99 to 10.81) |
|
Bremer 2018 Non‐randomised |
PA | Educational meetings, educational materials | Usual practice | Quantity of PE classes score (more is better), 20 weeks, teacher survey. | FU MD: t(27) = −0.23; P = 0.82 | NA |
|
Cheung 2018 Non‐randomised |
PA | Educational meeting, educational materials | Usual practice | Total PA time (before school, after school, in class, recess and PE time) (more is better), 1 year, teacher survey. | FU MD 36.3 (95% CI 16.2 to 56.4); P < 0.01 | NA |
|
Egan 2018 Non‐randomised |
PA | Educational materials; Educational outreach visit or academic detailing, tailored intervention, audit and feedback | Waitlist control | Implementation score (more is better), 12 months, coded interviews with teachers. | FU MD: Mann‐Whitney U analyses 5; P = 0.04 | 0.78 (95% CI −0.88 to 2.44) |
|
Sallis 1997 Non‐randomised |
PA | Educational materials, educational meetings, educational outreach visits or academic detailing, length of consultation, other | Usual practice or waitlist control | Amount of PE per week (minutes) (more is better), 2.5 years, direct observation. | FU mean: intervention 64.6 (95% CI 59.0, 70.2); control 38.0 (27.9, 48.1); P < 0.001 | 1.10 (95% CI 0.55 to 1.64) |
|
Gingiss 2006 Non‐randomised |
Tobacco | Educational meetings, educational outreach visits, external funding, local consensus processes | Usual practice | % of schools extremely or moderately active in providing faculty or staff cessation support (more is better), 2 years, survey | No effect estimate between groups reported. FU %: intervention 37%; control 26% |
0.30 (95% CI −0.32 to 0.91) |
aData analysed at the school level. bMeasure of variance not reported.
CI: confidence interval, cRCT: cluster randomised controlled trial; EPOC: Effective Practice and Organisation of Care; FU: follow‐up; LS: least squares; MD: mean difference; NA: not applicable (estimate of SMD unable to be determined, results are described narratively); n/N: number of events/sample size; OR: odds ratio, PA: physical activity; PE: physical education; RCT: randomised controlled trial; RR: risk ratio; SD: standard deviation; SE: standard error; SMD: standardised mean difference.
Subgroups
Implementation 'at scale'.
Randomised controlled trials
One RCT assessed the impact of a strategies to achieve implementation at scale, that is, across at least 50 schools assigned to the intervention group. In Perry 1997, which sought to improve the nutritional quality of school menus, there was a non‐significant reduction in milligrams of cholesterol in school lunches following a range of implementation support strategies including educational materials; educational meeting; educational outreach visits; and other (mean difference −5.8 (SE 4.2) mg cholesterol; P = 0.17). The effect was equivalent to an SMD of 0.40 mg cholesterol (Perry 1997).
Non‐randomised trials
All four non‐RCTs of strategies that sought to achieve implementation 'at scale' had an effect in a direction favouring the group receiving implementation support relative to comparison group. The standardised effects sizes for these studies ranged from an SMD of 0.30 to 0.59 (Alaimo 2015; Gingiss 2006; Nathan 2012). Two studies had CIs that crossed zero (Alaimo 2015; Gingiss 2006).
School type
Randomised controlled trials
Subgroup analysis by school type found no effect (Q of moderators (QM) = 3.70, I2 = 79.4, P = 0.30, degrees of freedom (df) = 3). Point estimates for trials undertaken in middle and high schools were higher than those undertaken in elementary schools, however, heterogeneity remained high (high: SMD 1.21, 95% CI 1.00 to 1.42; I2 = 75.9%; 3 RCTs; middle: SMD 1.17, 95% CI 0.65 to 1.68; I2 = 69.7%; 3 RCTs; elementary: SMD 0.93, 95% CI 0.55 to 1.30; I2 = 80.1%; 14 RCTs). One trial included multiple school types (SMD 0.16, 95% CI −0.44 to 0.76; Figure 9).
9.
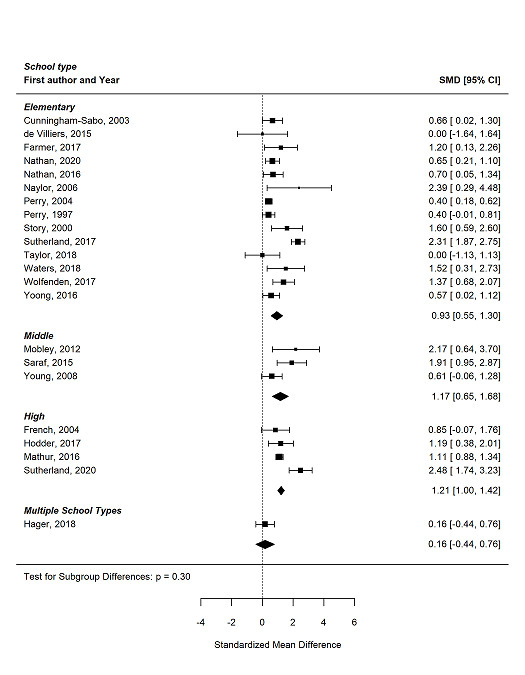
Standardised mean difference between intervention and control groups in implementation trials.
Non‐randomised trials
The direction of effect reported in all non‐RCTs favoured the group receiving implementation support, regardless of the type of school targeted by the implementation strategy. Standardised effects ranged from 0.31 to 1.10 for elementary, 0.32 for middle, to 1.10 to 6.90 for high and 0.30 to 0.59 for strategies targeting multiple school types. Effect sizes could not be determined for two studies (Bremer 2018; Heath 2002; Table 4).
Targeted risk factor
Randomised controlled trials
Tests for subgroup differences by risk factor among trials included in meta‐analyses was not significant (QM = 7.30, I2 = 72.6%, P = 0.12, df = 4) (Figure 10). However, there was variation in point estimates ranging from an SMD 0.41 (95% CI 0.09 to 0.74; I2 = 48.2%; 3 RCTs) among trials of strategies targeting the implementation of nutrition and physical activity interventions (combined) to SMD 1.53 (95% CI 0.78 to 2.28; I2 = 85.6%; 6 RCTs) for trials of strategies targeting the implementation of physical activity interventions (alone) (Figure 11). Heterogeneity was reduced, and the I2 statistic was below50% in all risk factor subgroups.
10.
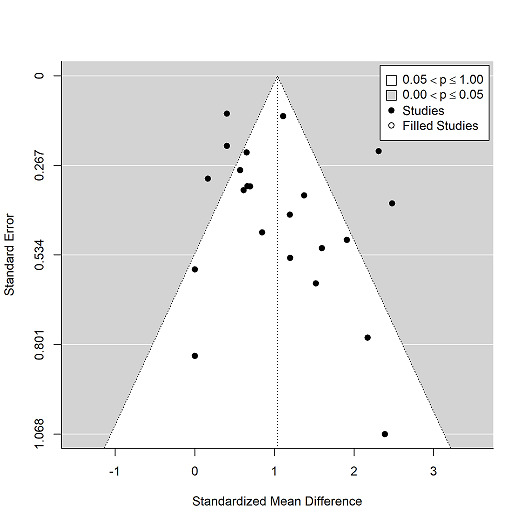
Funnel plot – Standardised mean difference between intervention and treatment groups in implementation trials by standard error.
11.
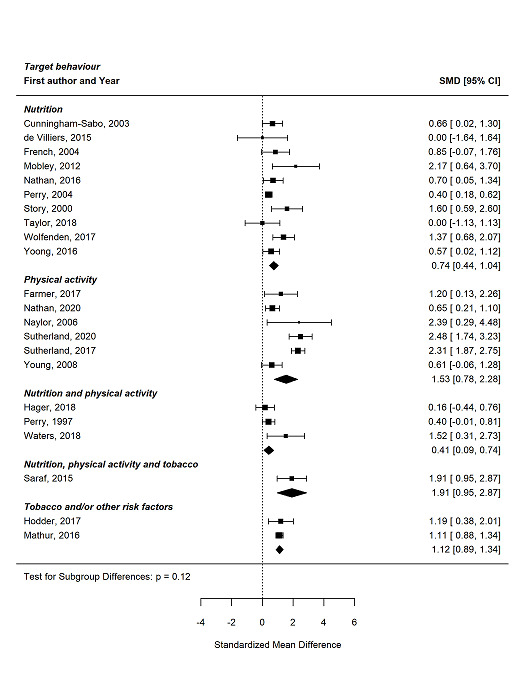
Standardised mean difference between intervention and treatment groups in implementation trials, grouped by target behaviour.
Non‐randomised trials
The direction of effect reported in all non‐RCTs favoured the group receiving implementation support, regardless of the risk factor targeted by the intervention. The standardised effects sizes for these studies ranged from an SMD of 0.32 to 6.90 among trials of strategies targeting nutrition, and 0.31 to 1.10 for those targeting physical activity. One non‐RCT examined the effect of strategies to implement tobacco‐related policies and practices in schools, the effects of which were small (SMD 0.30).
Comparisons of different implementation strategies
Six trials compared different implementation strategies. Three were RCTs (Delk 2014; Hager 2018; Naylor 2006), and three were non‐RCTs (Alaimo 2015; Egan 2018; Hoelscher 2010). Two trials were comparative effectiveness studies (Delk 2014; Hoelscher 2010), and four trials included multiple arms (Alaimo 2015; Egan 2018; Hager 2018; Naylor 2006).
Randomised controlled trials
The Central Texas CATCH compared the effects of three combinations of implementation strategies in an effort to promote the implementation of activity breaks by classroom teachers in a cluster‐RCT (Delk 2014). The 'Basic' arm included a local consensus process (team developed at each school), clinical practice guidelines (activity break guidelines for teachers) and educational meetings (teaching training of guidelines) while the 'Basic Plus' arm consisted of all the basic activities plus educational outreach visits (monthly facilitator visits) and tailored interventions (individualised strategies to promote activity breaks on school campuses). The 'Basic Plus‐SM' consisted of all the aforementioned strategies plus asocial marketing campaign. Among teachers who indicated they had conducted activity breaks in the last week, there was a slight increase in the number of days' activity breaks they had conducted in two of the three intervention groups (Basic Plus: baseline mean 1.90, SD 1.2; follow‐up mean 2.01, SD 1.2; effective sample size 151; Basic Plus‐SM: baseline mean 1.90, SD 1.3; follow‐up mean 2.00, SD 1.3, effective sample size = 216; P = not significant). The 'Basic' arm showed a slight decrease in the number of activity breaks conducted (baseline mean 2.05, SD 1.4; follow‐up mean 1.74, SD 1.1; effective sample size = 167; P = not reported).
Hager 2018 included three arms. One received the Wellness Champions for Change Training (WCC), one received WCC plus additional Technical Assistance (WCC+TA) and one was a delayed training arm. Change in local wellness policy implementation score (a 29‐item survey used to create a sum score: fully implemented (3 points), partially implemented (2 points), underdevelopment (1 point)) was greater in the WCC arm at follow‐up (mean 12.92, SD 20.7) than in the WCC+TA arm (mean 8.95, SD 29.0) and the delayed intervention arm (mean 3.30, SD 17.7).
Naylor 2006 compared two interventions with usual practice (UP). In the Champion schools (CS), classrooms received Actions Bins that contained resources for physical activity. The initial training was also provided to a school champion (a person who was willing to support colleagues), support was not provided to each classroom. In the Liaison Schools (LS), teachers had weekly training with an individual who would come to the classroom and mentor and demonstrate physical activity. Action Bins were also provided and enhanced with resources if requested. At follow‐up, both CS and LS schools performed more minutes per week of physical activity then UP schools (MD: CS versus UP: 137.8 minutes/week, 95% CI 117.0 to 158.6; P < 0.001; LS versus UP: 154.8 minutes /week, 95% CI 136.6 to 173.0; P < 0.0014).
Non‐randomised trials
The Travis County CATCH trial compared the effects of two different implementation strategies to support the implementation of the CATCH programme aimed at preventing child obesity in a non‐randomised design (Hoelscher 2010). The first implementation strategy included educational meetings (training and booster sessions for team members from each school), educational materials (CATCH co‐ordination kit providing "how‐to" implementation instructions), local consensus process (community meetings), pay for performance (USD2000 to USD5000 for exemplary CATCH implementation), the use of information and communication technologies (social marketing strategies), educational outreach visits (facilitator visits) and other (family fun events) supports to implement the programme. The second included the same implementation strategies, however, the level of support was more intense and often included elements to engage the community in supporting implementation. For example, there were more‐frequent educational outreach visits, educational meetings targeting community members, community members were engaged in consensus processes, and there were additional implementation resources such as guides and the inclusion of the Centers for Disease Control and Prevention School Health Index as a planning tool. For the selected implementation outcome (days/week of physical teacher led activity breaks) the difference in means at follow‐up between the more and less intensive intervention was −0.1 (P = 0.16, 15 schools; assumed number, unable to confirm with authors), indicating the less intensive intervention had a higher mean of days/week teacher‐led physical activity breaks at follow‐up.
The PACES trial by Egan 2018 included four schools with differing treatment levels. School A received one implementation approach (community of practice; Level 1; EPOC strategy educational meetings). School B received the first two approaches (community of practice and community‐based participatory research; Level 2; EPOC strategies Educational meetings, education outreach visits, tailored intervention, and audit and feedback). School C received three approaches (community of practice, community‐based participatory research and service learning; Level 3; EPOC strategies Educational meetings, education outreach visits, tailored intervention, and audit and feedback). School D acted as a control condition. The implementation score (where a larger positive number indicates a positive impact on the intervention) for School B had the greatest change at follow‐up despite being the second in intervention intensity (change 3.37; 3 classrooms). This was followed by School C which received the highest intensity intervention (change 1.10; 3 classrooms), the School D which was the control school (change −0.93; 3 classrooms) and School A (change −4.87; 3 classrooms).
Alaimo 2015 combined their implementation outcome 'Mean Nutrition Education and/or Practice Change Score' for all three comparative effectiveness arms and as such the effects between each arm could not be described.
Secondary outcomes
Effectiveness of implementation strategies on measures of student diet, physical activity, tobacco or alcohol use and obesity
Diet
Randomised controlled trials
Eleven RCTs or cluster‐RCTs provided data on child diet. Meta‐analysis of these studies found strategies to support the implementation of nutrition policies and practices were associated with a small effect (SMD 0.08, 95% CI 0.02 to 0.15; I2 = 63%; 16,649 participants; low‐certainty evidence; Analysis 2.1; Figure 12). One study that could not be included in the meta‐analysis found little differences in the selected measure of student intake (fat) between groups (French 2004).
2.1. Analysis.
Comparison 2: Secondary outcomes, Outcome 1: Nutrition
12.
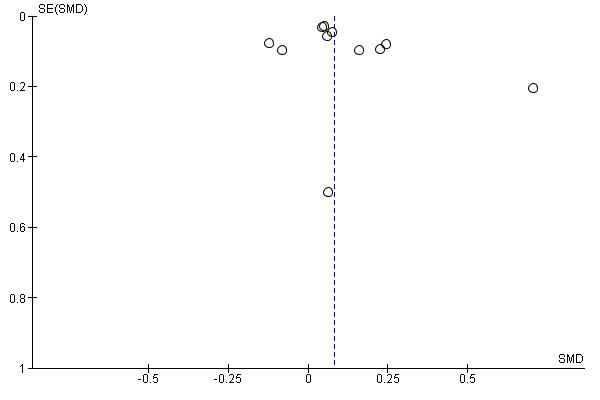
Funnel plot for secondary outcome (nutrition).
Non‐randomised trials
Five non‐RCTs reported child measures of diet, two of which were undertaken in the context of obesity prevention (Hoelscher 2010; Whatley Blum 2007). The direction of effect for all five of these favoured students of schools receiving implementation support. Two studies reported results by boys and girls (and not combined). Evenhuis 2020 found purchases of less‐healthy products decreased among boys and girls in schools receiving implementation support relative to control. Whatley Blum 2007 found little difference in the consumption of sugar‐sweetened beverages for boys and girls of schools receiving implementation support compared to control schools. Alaimo 2015 found per cent of kilocalories from fat varied between −0.7% and 0.2% among students in schools receiving implementation support relative to control. There were little to no differences were on measures of total calories (Simons‐Morton 1988) and healthy food index (Hoelscher 2010).
Physical activity
Randomised controlled trials
Nine RCTs and cluster‐RCTs provided data on student physical activity (Farmer 2017; Nathan 2020; Naylor 2006; Perry 1997; Saraf 2015; Saunders 2006; Sutherland 2017; Waters 2017; Young 2008). Pooled meta‐analysis suggested a slight increase in physical activity data in the intervention groups when compared to control (SMD 0.09, 95% CI −0.02 to 0.19; I2 = 83%; 16,389 participants; low‐certainty evidence; Analysis 2.2).
2.2. Analysis.
Comparison 2: Secondary outcomes, Outcome 2: Physical activity
Non‐randomised trials
Three non‐RCTs provided data on physical activity (Bremer 2018; Hoelscher 2010; Sallis 1997). The direction of effect for across studies was mixed. Sallis 1997 reported device recorded times for a student one‐mile run at two‐year follow‐up by group and gender. Girls, but not boys, in schools where the intervention was implemented by class teachers receiving implementation support had faster one‐mile run times than control. Bremer 2018 reported greater physical activity by students in control schools; however, the effect was uncertain with CIs crossing zero (MD −0.07, 95% CI −0.16 to 0.01; P = 0.09). Hoelscher 2010 reported the number of days students were engaged in at least 30 minutes of vigorous physical activity and found a small, albeit non‐significant, increase in the those attending schools receiving support to implement the intervention (difference of mean difference = 0.3, P = 0.111).
Overweight, obesity and adiposity
Randomised trials
Eight RCTs or cluster‐RCTs reported student BMI or BMI z‐score outcomes; all were included in the meta‐analysis. Implementation strategies probably result in little to no difference in obesity (SMD −0.02, 95% CI −0.05 to 0.02; I2 = 5%; 18,618 participants; moderate‐certainty evidence; Analysis 2.3).
2.3. Analysis.
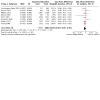
Comparison 2: Secondary outcomes, Outcome 3: Obesity
Non‐randomised trials
The three non‐RCTs reported varied effects on measures of BMI z‐score/BMI. The direction of effect for one of these favoured students of schools receiving implementation support. In the Travis County CATCH Project, a comparative effectiveness trial, students of schools receiving support to implement the CATCH BasicPlus and Community intervention had 7% greater reductions in the proportion of overweight students (P = 0.051) and a 1.7% reduction in the proportion of students who were obese (P = 0.33) compared to those implementing CATCH BasicPlus (Hoelscher 2010). In the El Paso CATCH trial, there was no difference in BMI between groups at follow‐up (effect size not reported) (Heath 2002). Finally, while impacts on BMI were not reported postintervention in a trial of the implementation of the SPARK programme, interim analyses suggests that the intervention had no impact on child BMI (Sallis 1997).
Tobacco
Randomised controlled trials
Three cluster‐RCTs reported on student tobacco outcomes (Hodder 2017; Mathur 2016; Saraf 2015). Meta‐analysis found very uncertain evidence about the effect of implementation strategies on measures of tobacco use (SMD −0.03, 95% CIs −0.23 to 0.18; I2 = 81%; 3635 participants; very low‐certainty evidence; Analysis 2.4).
2.4. Analysis.
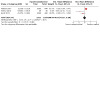
Comparison 2: Secondary outcomes, Outcome 4: Tobacco
Non‐randomised trials
No non‐RCTs assessed tobacco use.
Alcohol use
Randomised controlled trials
One trial examined the impact of an intervention of alcohol use. Hodder 2017 compared a three‐year whole of school interventions that addressed 16 broad individual, environmental protective strategies to usual care. At three‐year follow‐up, the direction of effects suggested that the strategy to support the implementation of the intervention may slightly increase measures of alcohol use; however, the effects were uncertain and the CIs crossed zero (OR 1.10, 95% CI 0.77 to 1.56; P = 0.60; 2105 participants; low‐certainty evidence).
Non‐randomised trials
No non‐RCTs assessed alcohol use.
Unintended consequences and adverse effects of strategies
Three RCTs included a measure that was specified in the study methods as an assessment of potential unintended adverse effects. Mobley 2012 found no impact of the intervention on the percentage of students passing maths and reading state‐wide texts after three years (4603 participants). School attendance increased in both study arms from baseline to follow‐up (control: 8.7% to 9.9%, intervention: 8.9% to 10.2%; 4603 participants). There were also drops in disciplinary action in both groups but they were not regarded to be an effect of the intervention. Wolfenden 2017 reported changes in canteen profitability as a potential adverse outcome of canteen menu modulation and found no differences between intervention and control schools. Taylor 2018 examined fruit and vegetable waste at lunchtime and found no differences between intervention and control groups in food wastage (112 students observed). The certainty of this evidence was low (downgraded for risk of bias and for the small number of studies reporting adverse outcomes).
Four trials did not specify outcomes as measures of adverse effects in their study methods; however, they did interpret study findings to suggest that the implementation of policies and practices did not cause unintended harms (Cunningham‐Sabo 2003; French 2004; Naylor 2006; Perry 1997). For example, French 2004 reported that strategies to improve school food service did not adversely impact on school revenue (29 schools). Perry 1997 reported that implementation of a programme to lower the fat and saturated fat content of school meals had no impact on other aspect of nutritional quality of the school meals. Two trials reported no changes in height (Cunningham‐Sabo 2003, 1409 participants; Perry 1997, 4008 participants), or weight of students (Cunningham‐Sabo 2003, 1409).
Cost or cost‐effectiveness of strategies
Four RCTs undertook an economic evaluation of implementation strategies specifically and were reported in two papers: Reilly 2018 (which described the economic evaluation of three included studies) and Waters 2017. Reilly 2018 examined implementation strategies to improve the implementation of a healthy school canteen policy undertaken by three included studies (Nathan 2016; Wolfenden 2017; Yoong 2016). Studies were categorised based on the intensity (number of strategies employed) of the implementation strategies as low (Yoong 2016), medium (Nathan 2016), or high (Wolfenden 2017). The study included costs associated with the delivery of the implementation support strategies of the included trials such as support staff salary costs; menu collection and assessment, feedback reports training, and management; as well as canteen staff training expenses such as venue hire, catering and the provision of canteen equipment. The total cost of implementation support per school was AUD4771 for the high‐intensity intervention (Wolfenden 2017), AUD2216 for the medium‐intensity intervention (Nathan 2016), and AUD2102 for the low‐intensity intervention (Yoong 2016). The incremental cost‐effectiveness ratios, representing the cost per each additional school compliant with the healthy canteen policy compared to usual support were AUD2982 (high‐intensity), AUD2627 (medium‐intensity) and AUD4730 (low‐intensity). Waters 2017 examined the 'Fun 'n Healthy in Moreland!' intervention, which included offering schools access to a Community Development Worker to act as a knowledge broker and assist in developing intervention programme strategies and resources. Their cost‐analysis included the Community Development Workers' salaries, school resources and parent expenses. The cost of the intervention over the full period of the study was AUD229 (per child for 3.5 years), approximately AUD65 per child per year. The certainty of this evidence was graded as very low (downgraded for risk of bias, indirectness and imprecision).
Four studies did not include an assessment of the cost implementation strategies specifically; however, they reported some economic evaluations. Taylor 2018 examined procurement records related to the Shaping Healthy Choices Program (provision of USD3000 was a strategy used to increase procurement of regionally grown produce). Monthly expenditure was divided by the number of meals served to determine a mean US dollar spent per student per day. Total, regional and non‐regional expenditure were found to be higher in intervention schools compared to control schools (total: 14 cents for intervention versus 4 cents for control; regional: 6 cents for intervention versus 3 cents for control; 8 cents for non‐regional versus 1 cent for control). The TACOS trial, which aimed to increase the availability of lower fat á la cart food items reported no impact of the intervention on school food service revenue (French 2004). The HEALTHY study found no between‐groups difference in school revenue or expenses following the provision of implementation support (Mobley 2012). One non‐RCT, conducted by Brown and colleagues (see under Heath 2002), examined the cost‐effectiveness of the CATCH intervention using estimates from the CATCH El Paso Trial from a societal perspective. The study reported the CATCH intervention to be cost‐effective when compared to estimated costs associated with obesity and quality‐adjusted life‐years beyond the age of 40 years, with a cost‐effectiveness ratio of USD900 and net benefit of USD68,125.
Discussion
Summary of main results
The primary objective of the review was to examine the effectiveness of strategies aiming to improve the implementation of school‐based policies, programmes or practices that promote healthy, or reduce unhealthy behaviours relating to child diet, physical activity, obesity, and tobacco or alcohol use. The review update included 11 new studies, bringing the total number of trials in the review to 38. Overall, the findings from synthesis of randomised trials suggest that implementation strategies are effective, relative to usual care or minimal support control, in improving the implementation of chronic disease prevention interventions. The effects of such strategies may also yield small improvements in some chronic disease risks behaviours targeted by the intervention. Few studies reported economic evaluations, or assessed adverse effects. The overall certainty of evidence (GRADE) was very low to moderate across implementation and risk factor outcomes.
Consistent with previous Cochrane Reviews examining implementation strategies in childcare services (Wolfenden 2016) and workplaces (Wolfenden 2018), the review team encountered a number of similar methodological issues which complicated synthesis and interpretation of the findings of the review. Among these was the diversity of implementation strategies examined. Several implementation strategies, most notably educational materials, educational outreach and educational meetings, were commonly used. However, trials included a variety of implementation strategies in different combinations. While an overall pooled synthesis was possible, there are currently insufficient trials to examine the effects of discrete implementation strategies. As the evidence base develops the potential to undertake such analyses will improve. Implementation strategies were also often poorly described. Classification of strategies using the EPOC taxonomy was further complicated as the Taxonomy has been developed to describe strategies to improve implementation or professional practice of health services or practitioners, which were often not relevant for the school setting (EPOC 2015). More recently published taxonomies that have been modified for the schools setting may be useful in future review updates(Cook 2019).
Overall completeness and applicability of evidence
The review identified an immature but developing evidence‐base. Trials examining implementation strategies in the school setting is dominated by studies conducted in the USA (22 of 38 studies) with more emerging in Australia (nine of 38 studies). The applicability of the review to other countries, particularly low‐ and middle‐income countries is, therefore, limited. Given the importance of contextual factors in implementation outcomes (Durlak 2008), more research in jurisdictions that have different schooling systems to those in the USA and Australia is warranted.
Quality of the evidence
The overall certainty of the randomised trial evidence was low for implementation outcomes and moderate to very low for secondary outcomes. The collective certainty of evidence was downgraded due to risk of bias, inconsistency and indirectness considerations. All trials were considered to be at high risk of performance bias, and all non‐randomised designs were at high risk of bias due to selection bias from both random sequence generation and allocation concealment. Most trials were small, recruiting relatively small numbers of schools or school staff, limiting the precision of estimated effects.
Potential biases in the review process
A number of strategies were employed in the conduct of the review to reduce the risk of bias. We undertook a comprehensive search in this update, screening an additional 8000 citations, to the more than 18,000 screened in the original review. This included searches of trial registers and handsearching of journals. We also utilised published search filters to maximise the likely capture of relevant studies. However, as a developing field, terminology in implementation science is still evolving, which may have increased the likelihood that relevant studies may not have been captured in the search strategy (Mazza 2013). The search did capture all relevant trials included in an earlier systematic review of implementation strategies conducted by the Agency for Healthcare Research and Quality (Rabin 2010). Nonetheless, as terminology in the field develops, search terms may need to be refined in future review updates.
Agreements and disagreements with other studies or reviews
Overall, the effects of implementation strategies on measures of intervention implementation were large and equivalent to an improvement, relative to a usual care or minimal support control, of one standard deviation (SMD 1.04, 95% CI 0.74 to 1.34). While we are not aware of any systematic reviews that report pooled effects on measures of implementation in schools for comparison, the effect size is twice that found in a recent Cochrane Review of implementation strategies in childcare services (Wolfenden 2020). It is also larger than found for implementation strategies targeting the implementation of health interventions in clinical settings including primary care (Rankin 2018; Tang 2021; Wiggin 2021). Such findings are encouraging, suggesting substantive improvement in implementation of interventions targeting chronic disease risks in this setting.
While subgroup analyses were exploratory, and largely failed to explain the observed heterogeneity evident in pooled analyses, their findings are note‐worthy. Subgroup analyses of implementation strategies executed at scale found they achieved standardised effect sizes ranging from 0.3 to 0. 59. While these can be characterised as 'moderate'‐sized effects, they are smaller than the point estimate of meta‐analysis combining effects of all RCTs (SMD 1.04; 95% CI 0.74 to 1.34), regardless of their scale. This finding is consistent with previous reviews that have reported effect attenuation with increasing scale of implementation and underscore the considerable challenges of efforts to do so (Lane 2021; McCrabb 2019; Sutherland 2022). There were no subgroup differences in pooled analyses by the targeted risk factors; however, there were differences between subgroups by school type, with the effects of implementation strategies greatest in high schools. As secondary schools in many school systems employ dedicated health and physical education staff, they may have greater support for expertise and resources to facilitate the implementation of health promotion initiatives. Further research may be required to explore such hypotheses.
Despite implementation strategies achieving relatively large improvements in the implementation of interventions, their effects on student health outcomes were typically small and uncertain, in many cases the 95% CIs crossed zero. For example, we found pooled effects from RCTs yielded effects for physical activity equivalent to just 50 steps per day, and an improvement in measures of dietary diversity score of 0.1 of an SD. While improvements on such measures are associated the onset of chronic disease, the size of the effects reported in are likely to yield only limited population health impacts on chronic disease (Anderson 2019; Chung 2018; Fernandes 2010; van der Pols 2007; Weres 2022). The findings may reflect the relatively small and heterogeneous effects of school‐based interventions on such student health outcomes per se, as demonstrated in systematic reviews of their effectiveness (Dobbins 2013). That is, interventions capable of only small effects will produce small effects when implemented well. If this is the case, greater investment in the development of more potent chronic disease prevention interventions that are amenable to implementation in schools may be required. Optimisation processes represent one mechanism to develop and improve the effects of interventions and their implementation strategies to improve student health outcomes (Lewis 2021; Wolfenden 2019). Alternatively, the findings suggests that school‐based approaches alone will be insufficient to meaningfully mitigate the burden of chronic disease, and should be seen as part of broader, whole of community efforts.
Few studies reported measures assessing potential adverse effects or economic evaluations. This finding is consistent with reviews of implementation trials in other settings including childcare services, workplaces (Wolfenden 2018), and sporting clubs (McFadyen 2018), and with bibliographic and other studies that have suggested less than 10% of implementation studies collect or report such outcomes (Eisman 2020; Wolfenden 2016a). These outcomes are considered core to prudent public health decision‐making, including in decision frameworks of the World Health Organization (Rehfuess 2019). The lack of such evidence present challenges for policymakers and practitioners, who must appraise the relative cost and potential for adverse effects of initiatives to improve the implementation of evidence‐based chronic disease prevention interventions in this setting. Addressing this evidence gap represents a priority for the field (Hoomans 2014).
Authors' conclusions
Implications for practice.
The review provides evidence supporting the use of implementation strategies to improve the implementation of interventions targeting risk factors for chronic disease in schools.
While a range of strategies have been tested, the review does not provide evidence to guide selection of specific strategy components. Maximising the effects of implementation efforts may best be achieved through thorough formative evaluation. This includes consultation with schools and school systems to identify barriers or enablers to intervention implementation, and the codevelopment of appropriate, and contextually relevant implementation support strategies. A number of implementation frameworks are currently available to support such work. Among the most commonly used are the Theoretical Domains Framework, and the Consolidated Framework for Implementation in Research (CFIR) (Cane 2012; Damschroder 2009; French 2012).
Evidence regarding the effects of strategies to implement interventions in schools on student health outcomes is uncertain. Policymakers and practitioners should pay careful attention to the selection of interventions for implementation to ensure that they are sufficiently effective and amenable to implementing in the setting.
Implications for research.
Schools are one of the most valuable settings for population‐level interventions to improve child health. Despite this, there remains a surprising lack of controlled trials examining the impact of the strategies to implement initiatives to address chronic disease risks in this setting. For example, Cochrane Reviews have identified 53 randomised trials testing the efficacy of school‐based programmes to prevent alcohol misuse (Foxcroft 2011). However, we have identified just one trial of strategies to implement the alcohol prevention programmes in this setting. There is a need to reorient research investment to address this important evidence gap.
The review identified a need for the development and use of robust measures for the assessment of implementation outcomes. A number of the included trials included self‐report measures such as questionnaires, teacher‐completed log books and telephone interviews, of which just two were reported to have been validated. The reliability and validity of self‐reported measures of policy or practice implementation are questionable, particularly for use in trials given the potential for socially desirable responding (Greene 2008).
While not unique to the field of implementation (Lau 2015), of particular concern was the lack of consideration to the costs of implementing health promoting policies or practices, or their unintended adverse effects. Information regarding costs and adverse effects are particularly salient for health decision makers who must weigh the benefits of intervention with their harms and costs to community (Wolfenden 2010; Wolfenden 2015).
Approaches to implementation are not immune to unintended consequences (Pettigrew 2012). Future research should incorporate logic models to identify potential harms associated with implementing health promotion programmes in schools, and include measures to prospectively measure both harms and implementation costs.
What's new
| Date | Event | Description |
|---|---|---|
| 17 February 2023 | Amended | Label on Figure 4 'favours intervention' and 'favours control' were switched to show the correct direction of effect |
History
Protocol first published: Issue 5, 2015 Review first published: Issue 11, 2017
| Date | Event | Description |
|---|---|---|
| 1 July 2022 | New citation required and conclusions have changed | Search updated April 2021. Findings are now synthesised in meta‐analyses. We found 11 new trials to add to those identified in our previous search, bringing the total number of included studies to 38. We found, compared with a control, implementation strategies may result in large improvements in the implementation of interventions in schools, and slight improvements in student healthy eating, physical activity, obesity and tobacco use. Few trials assessed any economic benefits of the use of intervention implementation support strategies or any potential adverse effects for schools, staff or students. |
| 8 December 2017 | Amended | Republished after removal of parentheses in Plain Language Summary title. |
Acknowledgements
We acknowledge the contributions of Debbie Booth for running the search updates in this review. Cochrane Public Health supported the authors in the development of this review update.
The following people conducted the editorial process for this article:
Sign‐off Editor (final editorial decision): Lisa Bero, University of Colorado Anschutz Medical Campus, Aurora, USA;
Managing Editor (recruited peer reviewers, collated peer‐reviewer comments, provided editorial guidance to authors, edited the article, conducted policy checks): Jodie Doyle, University of Newcastle, NSW, Australia;
Copy Editor (copy editing and production): Anne Lawson, Central Production Service, Cochrane;
Peer‐reviewers (provided comments and recommended an editorial decision): Michele Hilton‐Boon, Glasgow Caledonian University, Glasgow, UK (conducted editorial methods checks); Anne Martin, University of Edinburgh, Edinburgh, UK (clinical/content review); Donau‐Universität Krems, Krems, Austria (review of updated search, conduct and reporting).
Appendices
Appendix 1. Search strategy
MEDLINE search strategy (Ovid)
| # | Searches |
| 1 | schools/ |
| 2 | ((primary or elementary or middle or junior or high or secondary) adj (school* or student*)).mp. |
| 3 | kinder*.mp. |
| 4 | 1 or 2 or 3 |
| 5 | implement*.tw. |
| 6 | Health Promotion/mt [Methods] |
| 7 | "Outcome and Process Assessment (Health Care)"/ |
| 8 | "Process Assessment (Health Care)"/ |
| 9 | "Outcome Assessment (Health Care)"/ |
| 10 | Program Evaluation/ |
| 11 | dissemin*.tw. |
| 12 | adopt*.tw. |
| 13 | practice.tw. |
| 14 | organi?ational change*.tw. |
| 15 | diffus*.tw. |
| 16 | (system* adj2 change*).tw. |
| 17 | quality improvement*.tw. |
| 18 | transform*.tw. |
| 19 | translat*.tw. |
| 20 | transfer*.tw. |
| 21 | uptake*.tw. |
| 22 | sustainab*.tw. |
| 23 | institutionali*.tw. |
| 24 | routin*.tw. |
| 25 | maintenance.tw. |
| 26 | capacity.tw. |
| 27 | incorporat*.tw. |
| 28 | adher*.tw. |
| 29 | ((polic* or practice* or program* or innovation*) adj5 (performance or feedback or prompt* or reminder* or incentive* or penalt* or communicat* or social market* or professional development or network* or leadership or opinion leader* or consensus process* or change manage* or train* or audit*)).tw. |
| 30 | integrat*.tw. |
| 31 | scal* up.tw. |
| 32 | 5 or 6 or 7 or 8 or 9 or 10 or 11 or 12 or 13 or 14 or 15 or 16 or 17 or 18 or 19 or 20 or 21 or 22 or 23 or 24 or 25 or 26 or 27 or 28 or 29 or 30 or 31 |
| 33 | exp Obesity/ |
| 34 | Weight Gain/ |
| 35 | exp Weight Loss/ |
| 36 | obes*.tw. |
| 37 | (weight gain or weight loss).tw. |
| 38 | (overweight or over weight or overeat* or over eat*).tw. |
| 39 | weight change*.tw. |
| 40 | ((bmi or body mass index) adj2 (gain or loss or change)).tw. |
| 41 | exp Primary Prevention/ |
| 42 | (primary prevention or secondary prevention).tw. |
| 43 | (preventive measure* or preventative measure*).tw. |
| 44 | (preventive care or preventative care).tw. |
| 45 | (obes* adj2 (prevent* or treat*)).tw. |
| 46 | 33 or 34 or 35 or 36 or 37 or 38 or 39 or 40 or 41 or 42 or 43 or 44 or 45 |
| 47 | exp Exercise/ |
| 48 | physical activity.tw. |
| 49 | physical inactivity.tw. |
| 50 | Motor Activity/ |
| 51 | (physical education or physical training or physical exercis*).tw. |
| 52 | "Physical Education and Training"/ |
| 53 | Physical Fitness/ |
| 54 | sedentary.tw. |
| 55 | exp Life Style/ |
| 56 | exp Leisure Activities/ |
| 57 | Dancing/ |
| 58 | dancing.tw. |
| 59 | aerobic*.tw. |
| 60 | sport*.tw. |
| 61 | ((lifestyle* or life style*) adj5 (program* or activ* or change*)).tw. |
| 62 | 47 or 48 or 49 or 50 or 51 or 52 or 53 or 54 or 55 or 56 or 57 or 58 or 59 or 60 or 61 |
| 63 | exp Diet/ |
| 64 | nutrition*.tw. |
| 65 | healthy eating.tw. |
| 66 | Child Nutrition Sciences/ |
| 67 | fruit*.tw. |
| 68 | vegetable*.tw. |
| 69 | "Fruit and Vegetable Juices"/ |
| 70 | canteen*.tw. |
| 71 | food service*.tw. |
| 72 | menu*.tw. |
| 73 | calorie*.tw. |
| 74 | Energy Intake/ |
| 75 | energy density.tw. |
| 76 | Eating/ |
| 77 | Feeding Behavior/ or ((feeding or eating) adj behavio?r*).tw. |
| 78 | dietary intake.tw. |
| 79 | Food Habits/ |
| 80 | Food/ |
| 81 | Carbonated Beverages/ or soft drink*.tw. |
| 82 | soda.tw. |
| 83 | sweetened drink*.tw. |
| 84 | Dietary Fats, Unsaturated/ or Dietary Fats/ |
| 85 | confectionar*.tw. |
| 86 | (school adj (lunch* or meal*)).tw. |
| 87 | ((feeding or food or nutrition*) adj program*).tw. |
| 88 | cafeteria*.tw. |
| 89 | Nutritional Status/ |
| 90 | 63 or 64 or 65 or 66 or 67 or 68 or 69 or 70 or 71 or 72 or 73 or 74 or 75 or 76 or 77 or 78 or 79 or 80 or 81 or 82 or 83 or 84 or 85 or 86 or 87 or 88 or 89 |
| 91 | exp Smoking/ |
| 92 | exp "Tobacco Use Cessation"/ |
| 93 | smok*.tw. |
| 94 | Nicotine/ |
| 95 | Tobacco/ or "Tobacco Use"/ |
| 96 | ((ceas* or cess* or prevent* or stop* or quit* or abstin* or abstain* or reduc*) adj5 (smok* or tobacco or nicotine)).tw. |
| 97 | "Tobacco Use Disorder"/ |
| 98 | ex‐smoker*.tw. |
| 99 | anti‐smok*.tw. |
| 100 | 91 or 92 or 93 or 94 or 95 or 96 or 97 or 98 or 99 |
| 101 | alcohol drinking/ or binge drinking/ |
| 102 | alcohol*.tw. |
| 103 | Alcoholic Intoxication/ or Alcoholism/ |
| 104 | drink*.tw. |
| 105 | liquor*.tw. |
| 106 | beer*.tw. |
| 107 | wine*.tw. |
| 108 | spirit*.tw. |
| 109 | drunk*.tw. |
| 110 | intoxicat*.tw. |
| 111 | binge.tw. |
| 112 | 101 or 102 or 103 or 104 or 105 or 106 or 107 or 108 or 109 or 110 or 111 |
| 113 | 46 or 62 or 90 or 100 or 112 |
| 114 | Randomized Controlled Trial/ |
| 115 | clinical trial/ or controlled clinical trial/ |
| 116 | random allocation/ |
| 117 | Double‐Blind Method/ |
| 118 | Single‐Blind Method/ |
| 119 | placebos/ |
| 120 | Research Design/ |
| 121 | Evaluation Studies/ |
| 122 | Comparative Study/ |
| 123 | exp Longitudinal Studies/ |
| 124 | Cross‐Over Studies/ |
| 125 | exp Cohort studies/ |
| 126 | Controlled Before‐After Studies/ |
| 127 | Interrupted Time Series Analysis/ |
| 128 | comparative study.pt. |
| 129 | clinical trial.tw. |
| 130 | latin square.tw. |
| 131 | (time adj series).tw. |
| 132 | (before adj2 after adj3 (stud* or trial* or design*)).tw. |
| 133 | ((singl* or doubl* or trebl* or tripl*) adj5 (blind* or mark)).tw. |
| 134 | placebo*.tw. |
| 135 | random*.tw. |
| 136 | (matched adj (communit* or school* or population*)).tw. |
| 137 | control*.tw. |
| 138 | (comparison group* or control group*).tw. |
| 139 | matched pairs.tw. |
| 140 | outcome stud*.tw. |
| 141 | (quasiexperimental or quasi experimental or pseudo experimental).tw. |
| 142 | (nonrandomi?ed or non randomi?ed or psuedo randomi?ed or quasi randomi?ed).tw. |
| 143 | prospectiv*.tw. |
| 144 | volunteer*.tw. |
| 145 | 114 or 115 or 116 or 117 or 118 or 119 or 120 or 121 or 122 or 123 or 124 or 125 or 126 or 127 or 128 or 129 or 130 or 131 or 132 or 133 or 134 or 135 or 136 or 137 or 138 or 139 or 140 or 141 or 142 or 143 or 144 |
| 146 | exp adolescent/ or child/ |
| 147 | (child or children or adolescen*).tw. |
| 148 | 146 or 147 |
| 149 | 4 and 32 and 113 and 145 and 148 |
| 150 | limit 149 to ed=20160901‐20190412 |
| 151 | limit 149 to ed=20190412‐20200113 |
| 152 | limit 149 to ed=20200113‐20201001 |
| 153 | limit 149 to ed=20201001‐20210214 |
| 154 | limit 149 to ed=20210214‐20210430 |
| 155 | limit 149 to ed=20210501‐20210731 |
Embase search strategy (Ovid)
| # | Searches |
| 1 | schools/ |
| 2 | ((primary or elementary or middle or junior or high or secondary) adj (school* or student*)).mp. |
| 3 | kinder*.mp. |
| 4 | 1 or 2 or 3 |
| 5 | implement*.tw. |
| 6 | dissemin*.tw. |
| 7 | adopt*.tw. |
| 8 | practice.tw. |
| 9 | organi?ational change*.tw. |
| 10 | diffus*.tw. |
| 11 | system* change*.tw. |
| 12 | quality improvement*.tw. |
| 13 | transform*.tw. |
| 14 | translat*.tw. |
| 15 | transfer*.tw. |
| 16 | uptake*.tw. |
| 17 | sustainab*.tw. |
| 18 | institutionali*.tw. |
| 19 | routin*.tw. |
| 20 | maintenance.tw. |
| 21 | capacity.tw. |
| 22 | incorporat*.tw. |
| 23 | adher*.tw. |
| 24 | ((polic* or practice* or program* or innovation*) adj5 (performance or feedback or prompt* or reminder* or incentive* or penalt* or communicat* or social market* or professional development or network* or leadership or opinion leader* or consensus process* or change manage* or train* or audit*)).tw. |
| 25 | integrat*.tw. |
| 26 | scal* up.tw. |
| 27 | health care quality/ |
| 28 | quality control/ |
| 29 | program evaluation/ |
| 30 | total quality management/ |
| 31 | 5 or 6 or 7 or 8 or 9 or 10 or 11 or 12 or 13 or 14 or 15 or 16 or 17 or 18 or 19 or 20 or 21 or 22 or 23 or 24 or 25 or 26 or 27 or 28 or 29 or 30 |
| 32 | exp Obesity/ |
| 33 | Weight Gain/ |
| 34 | Weight Loss.tw. or exp weight reduction/ |
| 35 | obes*.tw. |
| 36 | (weight gain or weight loss).tw. |
| 37 | (overweight or over weight or overeat* or over eat*).tw. |
| 38 | weight change*.tw. |
| 39 | ((bmi or body mass index) adj2 (gain or loss or change)).tw. |
| 40 | exp Primary Prevention/ |
| 41 | (primary prevention or secondary prevention).tw. |
| 42 | (preventive measure* or preventative measure*).tw. |
| 43 | (preventive care or preventative care).tw. |
| 44 | (obes* adj2 (prevent* or treat*)).tw. |
| 45 | 32 or 33 or 34 or 35 or 36 or 37 or 38 or 39 or 40 or 41 or 42 or 43 or 44 |
| 46 | exp Exercise/ |
| 47 | physical activity.tw. or exp physical activity/ |
| 48 | physical inactivity.tw. |
| 49 | exp Motor Activity/ |
| 50 | (physical education or physical training or physical exercis*).tw. |
| 51 | physical education/ |
| 52 | physical fitness.tw. or fitness/ |
| 53 | sedentary.tw. |
| 54 | lifestyle/ |
| 55 | Leisure Activit*.tw. or leisure/ |
| 56 | exp Sports/ |
| 57 | Dancing/ |
| 58 | (dance* or dancing).tw. |
| 59 | aerobic*.tw. |
| 60 | sport*.tw. |
| 61 | ((lifestyle* or life style*) adj5 (program* or activ* or change*)).tw. |
| 62 | 46 or 47 or 48 or 49 or 50 or 51 or 52 or 53 or 54 or 55 or 56 or 57 or 58 or 59 or 60 or 61 |
| 63 | exp Diet/ |
| 64 | nutrition*.tw. or nutrition/ |
| 65 | (health* adj2 eat*).tw. |
| 66 | nutritional science/ |
| 67 | fruit*.mp. or fruit/ or "fruit and vegetable juice"/ |
| 68 | vegetable*.tw. or vegetable/ |
| 69 | canteen*.tw. |
| 70 | Food Services.tw. or catering service/ |
| 71 | menu*.tw. |
| 72 | (calorie or calories or kilojoule*).tw. |
| 73 | Energy Intake.tw. or caloric intake/ |
| 74 | energy density.tw. |
| 75 | Eating/ |
| 76 | Feeding Behavior/ or ((feeding or eating) adj behavio?r*).tw. |
| 77 | dietary intake.tw. or dietary intake/ |
| 78 | Food Habits/ |
| 79 | Food/ |
| 80 | Carbonated Beverages/ or soft drink*.tw. |
| 81 | soda.tw. |
| 82 | sweetened drink*.tw. |
| 83 | Dietary Fats, Unsaturated/ or Dietary Fats/ |
| 84 | confectionar*.tw. |
| 85 | (school adj (lunch* or meal*)).tw. |
| 86 | ((feeding or food or nutrition*) adj program*).tw. |
| 87 | cafeteria*.tw. |
| 88 | Nutritional Status/ |
| 89 | 63 or 64 or 65 or 66 or 67 or 68 or 69 or 70 or 71 or 72 or 73 or 74 or 75 or 76 or 77 or 78 or 79 or 80 or 81 or 82 or 83 or 84 or 85 or 86 or 87 or 88 |
| 90 | exp Smoking/ |
| 91 | exp "Tobacco Use Cessation"/ |
| 92 | smok*.tw. |
| 93 | Nicotine/ |
| 94 | Tobacco/ or "Tobacco Use"/ |
| 95 | ((ceas* or cess* or prevent* or stop* or quit* or abstin* or abstain* or reduc*) adj5 (smok* or tobacco or nicotine)).tw. |
| 96 | "Tobacco Use Disorder"/ |
| 97 | ex‐smoker*.tw. |
| 98 | anti‐smok*.tw. |
| 99 | 90 or 91 or 92 or 93 or 94 or 95 or 96 or 97 or 98 |
| 100 | alcohol drinking/ or binge drinking/ |
| 101 | alcohol*.tw. |
| 102 | Alcoholic Intoxication/ or Alcoholism/ |
| 103 | drink*.tw. |
| 104 | liquor*.tw. |
| 105 | beer*.tw. |
| 106 | wine*.tw. |
| 107 | spirit*.tw. |
| 108 | drunk*.tw. |
| 109 | intoxicat*.tw. |
| 110 | binge.tw. |
| 111 | 100 or 101 or 102 or 103 or 104 or 105 or 106 or 107 or 108 or 109 or 110 |
| 112 | 45 or 62 or 89 or 99 or 111 |
| 113 | Randomized Controlled Trial/ |
| 114 | clinical trial/ or controlled clinical trial/ |
| 115 | random allocation/ |
| 116 | Double‐Blind Method/ |
| 117 | Single‐Blind Method/ |
| 118 | placebos/ |
| 119 | Research Design/ |
| 120 | Intervention Studies/ |
| 121 | Evaluation Studies/ |
| 122 | Comparative Study/ |
| 123 | exp Longitudinal Studies/ |
| 124 | Cross‐Over Studies/ |
| 125 | clinical trial.tw. |
| 126 | latin square.tw. |
| 127 | (time adj series).tw. |
| 128 | (before adj2 after adj3 (stud* or trial* or design*)).tw. |
| 129 | ((singl* or doubl* or trebl* or tripl*) adj5 (blind* or mark)).tw. |
| 130 | placebo*.tw. |
| 131 | random*.tw. |
| 132 | (matched adj (communit* or school* or population*)).tw. |
| 133 | control*.tw. |
| 134 | (qua?iexperimental or qua?i experimental or pseudo experimental).tw. |
| 135 | (nonrandomi?ed or non randomi?ed or psuedo randomi?ed or quasi randomi?ed).tw. |
| 136 | prospectiv*.tw. |
| 137 | volunteer*.tw. |
| 138 | cohort analysis/ or cohort studies/ |
| 139 | 113 or 114 or 115 or 116 or 117 or 118 or 119 or 120 or 121 or 122 or 123 or 124 or 125 or 126 or 127 or 128 or 129 or 130 or 131 or 132 or 133 or 134 or 135 or 136 or 137 or 138 |
| 140 | school child/ |
| 141 | adolescent/ |
| 142 | (child or children or adolescen* or teen*).tw. |
| 143 | 140 or 141 or 142 |
| 144 | 4 and 31 and 112 and 139 and 143 |
| 145 | limit 144 to dd=20160901‐20190412 |
| 146 | limit 144 to dd=20190412‐20200113 |
| 147 | limit 144 to dd=20200113‐20201001 |
| 148 | limit 144 to dd=20201001‐20210214 |
| 149 | limit 144 to dd=20210214‐20210430 |
| 150 | limit 144 to dd=20210430‐20210731 |
PsycINFO search strategy (Ovid)
| # | Searches |
| 1 | schools/ |
| 2 | ((primary or elementary or middle or junior or high or secondary) adj (school* or student*)).mp. |
| 3 | kinder*.mp. |
| 4 | 1 or 2 or 3 |
| 5 | implement*.tw. |
| 6 | dissemination.tw. |
| 7 | adopt*.tw. |
| 8 | practice.tw. |
| 9 | organi?ational change*.tw. |
| 10 | diffus*.tw. |
| 11 | system* change*.tw. |
| 12 | quality improvement*.tw. |
| 13 | transform*.tw. |
| 14 | translat*.tw. |
| 15 | transfer*.tw. |
| 16 | uptake*.tw. |
| 17 | sustainab*.tw. |
| 18 | institutionali*.tw. |
| 19 | routin*.tw. |
| 20 | maintenance.tw. |
| 21 | capacity.tw. |
| 22 | incorporat*.tw. |
| 23 | adher*.tw. |
| 24 | ((polic* or practice* or program* or innovation*) adj5 (performance or feedback or prompt* or reminder* or incentive* or penalt* or communicat* or social market* or professional development or network* or leadership or opinion leader* or consensus process* or change manage* or train* or audit*)).tw. |
| 25 | integrat*.tw. |
| 26 | scal* up.tw. |
| 27 | Quality Control/ |
| 28 | quality of services/ |
| 29 | program evaluation/ |
| 30 | 5 or 6 or 7 or 8 or 9 or 10 or 11 or 12 or 13 or 14 or 15 or 16 or 17 or 18 or 19 or 20 or 21 or 22 or 23 or 24 or 25 or 26 or 27 or 28 or 29 |
| 31 | exp Obesity/ |
| 32 | Weight Gain/ |
| 33 | exp Weight Loss/ |
| 34 | obes*.tw. |
| 35 | (weight gain or weight loss).tw. |
| 36 | (overweight or over weight or overeat* or over eat*).tw. |
| 37 | weight change*.tw. |
| 38 | ((bmi or body mass index) adj2 (gain or loss or change)).tw. |
| 39 | (primary prevention or secondary prevention).tw. |
| 40 | (preventive measure* or preventative measure*).tw. |
| 41 | (preventive care or preventative care).tw. |
| 42 | (obes* adj2 (prevent* or treat*)).tw. |
| 43 | 31 or 32 or 33 or 34 or 35 or 36 or 37 or 38 or 39 or 40 or 41 or 42 |
| 44 | exp Exercise/ |
| 45 | physical activity.tw. |
| 46 | physical inactivity.tw. |
| 47 | (physical education or physical training or physical exercis*).tw. |
| 48 | Physical Fitness/ |
| 49 | sedentary.tw. |
| 50 | exp Sports/ |
| 51 | Dance/ |
| 52 | (dance* or dancing).tw. |
| 53 | aerobic*.tw. |
| 54 | sport*.tw. |
| 55 | ((lifestyle* or life style*) adj5 (program* or activ* or change*)).tw. |
| 56 | 44 or 45 or 46 or 47 or 48 or 49 or 50 or 51 or 52 or 53 or 54 or 55 |
| 57 | nutrition*.tw. |
| 58 | (health* adj2 eat*).tw. |
| 59 | fruit*.tw. |
| 60 | vegetable*.tw. |
| 61 | canteen*.tw. |
| 62 | food service*.tw. |
| 63 | (diet* or food habits or fat or menu*).tw. |
| 64 | (calorie or calories or kilojoule*).tw. |
| 65 | Food Intake/ |
| 66 | energy density.tw. |
| 67 | Eating/ |
| 68 | Feeding Behavior/ or ((feeding or eating) adj behavio?r*).tw. |
| 69 | dietary intake.tw. |
| 70 | Food/ |
| 71 | Carbonated Beverages/ or soft drink*.tw. |
| 72 | soda.tw. |
| 73 | sweetened drink*.tw. |
| 74 | confectionar*.tw. |
| 75 | (school adj (lunch* or meal*)).tw. |
| 76 | ((feeding or food or nutrition*) adj program*).tw. |
| 77 | cafeteria*.tw. |
| 78 | 57 or 58 or 59 or 60 or 61 or 62 or 63 or 64 or 65 or 66 or 67 or 68 or 69 or 70 or 71 or 72 or 73 or 74 or 75 or 76 or 77 |
| 79 | smok*.tw. |
| 80 | Nicotine/ |
| 81 | Tobacco smoking/ |
| 82 | ((ceas* or cess* or prevent* or stop* or quit* or abstin* or abstain* or reduc*) adj5 (smok* or tobacco or nicotine)).tw. |
| 83 | "Tobacco Use Disorder"/ |
| 84 | ex‐smoker*.tw. |
| 85 | anti‐smok*.tw. |
| 86 | 79 or 80 or 81 or 82 or 83 or 84 or 85 |
| 87 | alcohol drinking/ or binge drinking/ |
| 88 | alcohol*.tw. |
| 89 | Alcoholic Intoxication/ or Alcoholism/ |
| 90 | drink*.tw. |
| 91 | liquor*.tw. |
| 92 | beer*.tw. |
| 93 | wine*.tw. |
| 94 | spirit*.tw. |
| 95 | drunk*.tw. |
| 96 | intoxicat*.tw. |
| 97 | binge.tw. |
| 98 | 87 or 88 or 89 or 90 or 91 or 92 or 93 or 94 or 95 or 96 or 97 |
| 99 | 43 or 56 or 78 or 86 or 98 |
| 100 | clinical trial/ or controlled clinical trial/ |
| 101 | placebo/ |
| 102 | Research Design/ |
| 103 | Intervention/ |
| 104 | exp Longitudinal Studies/ |
| 105 | ((Cross‐Over or evaluation or comparative) adj Stud*).tw. |
| 106 | clinical trial.tw. |
| 107 | latin square.tw. |
| 108 | (time adj series).tw. |
| 109 | (before adj2 after adj3 (stud* or trial* or design*)).tw. |
| 110 | ((singl* or doubl* or trebl* or tripl*) adj5 (blind* or mark)).tw. |
| 111 | placebo*.tw. |
| 112 | random*.tw. |
| 113 | (matched adj (communit* or school* or population*)).tw. |
| 114 | control*.tw. |
| 115 | comparison group*.tw. |
| 116 | matched pairs.tw. |
| 117 | outcome stud*.tw. |
| 118 | (qua?iexperimental or qua?i experimental or pseudo experimental).tw. |
| 119 | (nonrandomi?ed or non randomi?ed or psuedo randomi?ed or quasi randomi?ed).tw. |
| 120 | prospectiv*.tw. |
| 121 | volunteer*.tw. |
| 122 | 100 or 101 or 102 or 103 or 104 or 105 or 106 or 107 or 108 or 109 or 110 or 111 or 112 or 113 or 114 or 115 or 116 or 117 or 118 or 119 or 120 or 121 |
| 123 | (child or children or adolescen* or teen*).tw. |
| 124 | 4 and 30 and 99 and 122 and 123 |
| 125 | limit 124 to up=20160901‐20190412 |
| 126 | limit 124 to up=20190412‐20200113 |
| 127 | limit 124 to up=20200113‐20201001 |
| 128 | limit 124 to up=20201001‐20210214 |
| 129 | limit 124 to up=20210214‐20210430 |
| 130 | limit 124 to up=20210430‐20210731 |
CINAHL Search Strategy (EBSCO)
| # | Query |
| S1 | (MH "Schools") OR (MH "Schools, Elementary") OR (MH "Schools, Middle") OR (MH "Schools, Secondary") |
| S2 | ((primary or elementary or middle or junior or high or secondary) n1 (school* or student*)) |
| S3 | kinder* |
| S4 | S1 OR S2 OR S3 |
| S5 | implement* |
| S6 | dissemin* |
| S7 | adopt* |
| S8 | ((polic* or practice* or program* or innovation*) n5 (performance or feedback or prompt* or reminder* or incentive* or penalt* or communicat* or "social market*" or "professional development" or network* or leadership or "opinion leader*" or "consensus process*" or "change manage*" or train* or audit*)) |
| S9 | "organi?ational change*" |
| S10 | diffus* |
| S11 | "system* change*" |
| S12 | "quality improvement*" |
| S13 | transform* |
| S14 | translat* |
| S15 | transfer* |
| S16 | uptake* |
| S17 | sustainab* |
| S18 | institutionali* |
| S19 | routin* |
| S20 | maintenance |
| S21 | capacity |
| S22 | incorporat* |
| S23 | adher* |
| S24 | practice |
| S25 | integrat* |
| S26 | "scal* up" |
| S27 | S5 OR S6 OR S7 OR S8 OR S9 OR S10 OR S11 OR S12 OR S13 OR S14 OR S15 OR S16 OR S17 OR S18 OR S19 OR S20 OR S21 OR S22 OR S23 OR S24 OR S25 OR S26 |
| S28 | (MH "Obesity+") |
| S29 | (MH "Weight Gain") |
| S30 | (MH "Weight Loss") |
| S31 | obes* |
| S32 | ("weight gain" or "weight loss") |
| S33 | (overweight or "over weight" or overeat* or "over eat*") |
| S34 | "weight change*" |
| S35 | ((bmi or body mass index) n2 (gain or loss or change)) |
| S36 | "Primary Prevention" |
| S37 | "secondary prevention" |
| S38 | "preventive measure*" |
| S39 | "preventative measure*" |
| S40 | "preventive care" or "preventative care" |
| S41 | (obes* n2 (prevent* or treat*)) |
| S42 | S28 OR S29 OR S30 OR S31 OR S32 OR S33 OR S34 OR S35 OR S36 OR S37 OR S38 OR S39 OR S40 OR S41 |
| S43 | (MH "Exercise+") |
| S44 | (MH "Physical Activity") |
| S45 | "physical inactivity" |
| S46 | (MH "Motor Activity+") |
| S47 | (MH "Physical Education and Training") OR "physical education" or "physical training" or "physical exercis*" or "physical activity" |
| S48 | (MH "Physical Fitness") |
| S49 | "sedentary" |
| S50 | (MH "Life Style+") OR (MH "Life Style, Sedentary") |
| S51 | (MH "Leisure Activities+") |
| S52 | (MH "Sports+") |
| S53 | (MH "Dancing+") OR "Dance*" |
| S54 | aerobic* |
| S55 | sport* |
| S56 | ((lifestyle* or life style*) n5 (program* or activ* or change*)) |
| S57 | S43 OR S44 OR S45 OR S46 OR S47 OR S48 OR S49 OR S50 OR S51 OR S52 OR S53 OR S54 OR S55 OR S56 |
| S58 | (MH "Diet+") |
| S59 | nutrition* |
| S60 | health* n2 eat* |
| S61 | "Child Nutrition Sciences" OR (MH "Child Nutrition") |
| S62 | (MH "Fruit+") |
| S63 | (MH "Vegetables") OR "vegetable*" |
| S64 | fruit* |
| S65 | canteen* |
| S66 | (MH "Food Services") OR "food service*" |
| S67 | "menu*" |
| S68 | "calorie" or calories or kilojoule* |
| S69 | (MH "Energy Intake") |
| S70 | (MH "Energy Density") |
| S71 | (MH "Eating") |
| S72 | (MH "Eating Behavior") OR ((feeding or eating) n1 behavio#r*) |
| S73 | (MH "Food Intake") OR "dietary intake" |
| S74 | (MH "Food Habits") |
| S75 | (MH "Food") |
| S76 | (MH "Carbonated Beverages") OR "soft drink*" |
| S77 | "soda" |
| S78 | "sweetened drink*" |
| S79 | (MH "Dietary Fats") |
| S80 | "confectionar*" |
| S81 | (MH "Candy") |
| S82 | (school n1 (lunch* or meal*)) |
| S83 | ((feeding or food or nutrition*) n1 program*) |
| S84 | "cafeteria*" |
| S85 | (MH "Nutritional Status") |
| S86 | S58 OR S59 OR S60 OR S61 OR S62 OR S63 OR S64 OR S65 OR S66 OR S67 OR S68 OR S69 OR S70 OR S71 OR S72 OR S73 OR S74 OR S75 OR S76 OR S77 OR S78 OR S79 OR S80 OR S81 OR S82 OR S83 OR S84 OR S85 |
| S87 | (MH "Smoking+") |
| S88 | (MH "Smoking Cessation Programs") OR (MH "Tobacco Abuse Control (Saba CCC)") OR (MH "Tobacco Abuse (Saba CCC)") OR "Tobacco Use Cessation" |
| S89 | smok* |
| S90 | (MH "Nicotine") |
| S91 | (MH "Tobacco") |
| S92 | ((ceas* or cess* or prevent* or stop* or quit* or abstin* or abstain* or reduc*) n5 (smok* or tobacco or nicotine)) |
| S93 | (MH "Substance Use Disorders") |
| S94 | "ex‐smoker*" |
| S95 | "anti‐smok*" |
| S96 | S87 OR S88 OR S89 OR S90 OR S91 OR S92 OR S93 OR S94 OR S95 |
| S97 | (MH "Binge Drinking") OR (MH "Drinking Behavior") |
| S98 | alcohol* |
| S99 | (MH "Alcoholism") OR (MH "Alcoholic Intoxication") |
| S100 | drink* |
| S101 | liquor* |
| S102 | beer* |
| S103 | wine* |
| S104 | spirit* |
| S105 | drunk* |
| S106 | intoxicat* |
| S107 | binge |
| S108 | S97 OR S98 OR S99 OR S100 OR S101 OR S102 OR S103 OR S104 OR S105 OR S106 OR S107 |
| S109 | S42 OR S57 OR S86 OR S96 OR S108 |
| S110 | (MH "Randomized Controlled Trials") OR (MH "Clinical Trials+") |
| S111 | (MH "Random Assignment") |
| S112 | (MH "Double‐Blind Studies") |
| S113 | (MH "Single‐Blind Studies") |
| S114 | (MH "Placebos") |
| S115 | (MH "Study Design") |
| S116 | (MH "Experimental Studies") OR "Intervention Studies" |
| S117 | (MH "Evaluation Research") OR "Evaluation Studies" |
| S118 | (MH "Comparative Studies") |
| S119 | (MH "Prospective Studies") OR "Longitudinal Studies" |
| S120 | (MH "Crossover Design") OR "Cross‐Over Studies" |
| S121 | "clinical trial*" |
| S122 | "latin square" |
| S123 | (MH "Time Series") |
| S124 | (before n2 after n3 (stud* or trial* or design*)) |
| S125 | ((singl* or doubl* or trebl* or tripl*) n5 (blind* or mark)) |
| S126 | placebo* |
| S127 | random* |
| S128 | (matched n1 (communit* or school* or population*)) |
| S129 | control* |
| S130 | "comparison group*" |
| S131 | "matched pairs" |
| S132 | "outcome stud*" |
| S133 | qua?iexperimental or "qua?i experimental" or "pseudo experimental" |
| S134 | nonrandomi?ed or "non randomi?ed" or "psuedo randomi?ed" or "qua?i randomi?ed" |
| S135 | prospectiv* |
| S136 | volunteer* |
| S137 | S110 OR S111 OR S112 OR S113 OR S114 OR S115 OR S116 OR S117 OR S118 OR S119 OR S120 OR S121 OR S122 OR S123 OR S124 OR S125 OR S126 OR S127 OR S128 OR S129 OR S130 OR S131 OR S132 OR S133 OR S134 OR S135 OR S136 |
| S138 | (MH "Child") OR (MH "Adolescence") |
| S139 | (child or children or adolescen* or teen*) |
| S140 | S138 OR S139 |
| S141 | S4 AND S27 AND S109 AND S137 AND S140 |
| S142 | S4 AND S27 AND S109 AND S137 AND S140 |
| S143 | S4 AND S27 AND S109 AND S137 AND S140 |
| S144 | S4 AND S27 AND S109 AND S137 AND S140 |
| S145 | S4 AND S27 AND S109 AND S137 AND S140 (May – July 2021) |
COCHRANE search strategy (Wiley)
| ID | Search |
| #1 | MeSH descriptor: [Schools] this term only |
| #2 | ((primary or elementary or middle or junior or high or secondary) near/1 (school* or student*)) |
| #3 | kinder* |
| #4 | {OR #1‐#3} |
| #5 | implement* |
| #6 | MeSH descriptor: [Health Promotion] this term only and with qualifier(s): [methods ‐ MT] |
| #7 | MeSH descriptor: [Outcome and Process Assessment, Health Care] this term only |
| #8 | MeSH descriptor: [Process Assessment, Health Care] this term only |
| #9 | MeSH descriptor: [Outcome Assessment, Health Care] this term only |
| #10 | MeSH descriptor: [Program Evaluation] this term only |
| #11 | dissemin*:ti,ab |
| #12 | adopt*:ti,ab |
| #13 | practice:ti,ab |
| #14 | (organi?ational NEXT change*):ti,ab |
| #15 | diffus*:ti,ab |
| #16 | (system* near/2 change*):ti,ab |
| #17 | (quality NEXT improvement*):ti,ab |
| #18 | transform*:ti,ab |
| #19 | translat*:ti,ab |
| #20 | transfer*:ti,ab |
| #21 | uptake*:ti,ab |
| #22 | sustainab*:ti,ab |
| #23 | institutionali*:ti,ab |
| #24 | routin*:ti,ab |
| #25 | maintenance:ti,ab |
| #26 | capacity:ti,ab |
| #27 | incorporat*:ti,ab |
| #28 | adher*:ti,ab |
| #29 | ((polic* or practice* or program* or innovation*) near/5 (performance or feedback or prompt* or reminder* or incentive* or penalt* or communicat* or (social NEXT market*) or (professional NEXT development) or network* or leadership or (opinion NEXT leader*) or (consensus NEXT process*) or (change NEXT manage*) or train* or audit*)):ti,ab |
| #30 | integrat*:ti,ab |
| #31 | (scale‐up or scaled‐up):ti,ab |
| #32 | {OR #5‐#31} |
| #33 | MeSH descriptor: [Obesity] 4 tree(s) exploded |
| #34 | MeSH descriptor: [Weight Gain] this term only |
| #35 | MeSH descriptor: [Weight Loss] explode all trees |
| #36 | obes*:ti,ab |
| #37 | ("weight gain" or "weight loss"):ti,ab |
| #38 | (overweight or "over weight" or overeat* or (over NEXT eat*)):ti,ab |
| #39 | "weight‐change*":ti,ab |
| #40 | ((bmi or "body mass index") near/2 (gain or loss or change)):ti,ab |
| #41 | MeSH descriptor: [Primary Prevention] explode all trees |
| #42 | ("primary prevention" or "secondary prevention"):ti,ab |
| #43 | ((preventive NEXT measure*) or (preventative NEXT measure*)):ti,ab |
| #44 | ("preventive care" or "preventative care"):ti,ab |
| #45 | (obes* near/2 (prevent* or treat*)):ti,ab |
| #46 | {OR #33‐#45} |
| #47 | MeSH descriptor: [Exercise] explode all trees |
| #48 | physical‐activity:ti,ab |
| #49 | physical‐inactivity:ti,ab |
| #50 | MeSH descriptor: [Motor Activity] this term only |
| #51 | ("physical education" or "physical training" or ("physical NEXT exercis*")):ti,ab |
| #52 | MeSH descriptor: [Physical Education and Training] this term only |
| #53 | MeSH descriptor: [Physical Fitness] this term only |
| #54 | sedentary:ti,ab |
| #55 | MeSH descriptor: [Life Style] explode all trees |
| #56 | MeSH descriptor: [Leisure Activities] explode all trees |
| #57 | MeSH descriptor: [Dancing] this term only |
| #58 | dancing:ti,ab |
| #59 | aerobic*:ti,ab |
| #60 | sport*:ti,ab |
| #61 | ((lifestyle* or life‐style*) near/5 (program* or activ* or change*)) |
| #62 | {OR #47‐#61} |
| #63 | MeSH descriptor: [Diet] explode all trees |
| #64 | nutrition*:ti,ab |
| #65 | healthy‐eating:ti,ab |
| #66 | MeSH descriptor: [Child Nutrition Sciences] this term only |
| #67 | fruit*:ti,ab |
| #68 | vegetable*:ti,ab |
| #69 | MeSH descriptor: [Fruit and Vegetable Juices] this term only |
| #70 | canteen*:ti,ab |
| #71 | food‐service*:ti,ab |
| #72 | menu*:ti,ab |
| #73 | calorie*:ti,ab |
| #74 | MeSH descriptor: [Energy Intake] this term only |
| #75 | energy‐density:ti,ab |
| #76 | MeSH descriptor: [Eating] this term only |
| #77 | MeSH descriptor: [Feeding Behavior] this term only |
| #78 | ((feeding or eating) near/1 behavio?r*):ti,ab |
| #79 | "dietary intake":ti,ab |
| #80 | MeSH descriptor: [Feeding Behavior] this term only |
| #81 | MeSH descriptor: [Food] this term only |
| #82 | MeSH descriptor: [Carbonated Beverages] this term only |
| #83 | soft‐drink*:ti,ab |
| #84 | soda:ti,ab |
| #85 | sweetened‐drink*:ti,ab |
| #86 | MeSH descriptor: [Dietary Fats] this term only |
| #87 | MeSH descriptor: [Dietary Fats, Unsaturated] this term only |
| #88 | confectionar*:ti,ab |
| #89 | (school near/1 (lunch* or meal*)):ti,ab |
| #90 | ((feeding or food or nutrition*) near/1 program*):ti,ab |
| #91 | cafeteria*:ti,ab |
| #92 | MeSH descriptor: [Nutritional Status] this term only |
| #93 | {OR #63‐#92} |
| #94 | MeSH descriptor: [Smoking] explode all trees |
| #95 | MeSH descriptor: [Tobacco Use Cessation] explode all trees |
| #96 | smok*:ti,ab |
| #97 | MeSH descriptor: [Nicotine] this term only |
| #98 | MeSH descriptor: [Tobacco] this term only |
| #99 | MeSH descriptor: [Tobacco Use] this term only |
| #100 | ((ceas* or cess* or prevent* or stop* or quit* or abstin* or abstain* or reduc*) near/5 (smok* or tobacco or nicotine)):ti,ab |
| #101 | MeSH descriptor: [Tobacco Use Disorder] this term only |
| #102 | ex‐smoker*:ti,ab |
| #103 | anti‐smok*:ti,ab |
| #104 | {OR #94‐#103} |
| #105 | MeSH descriptor: [Alcohol Drinking] this term only |
| #106 | MeSH descriptor: [Binge Drinking] this term only |
| #107 | alcohol*:ti,ab |
| #108 | MeSH descriptor: [Alcoholic Intoxication] this term only |
| #109 | MeSH descriptor: [Alcoholism] this term only |
| #110 | drink*:ti,ab |
| #111 | liquor*:ti,ab |
| #112 | beer*:ti,ab |
| #113 | wine*:ti,ab |
| #114 | spirit*:ti,ab |
| #115 | drunk*:ti,ab |
| #116 | intoxicat*:ti,ab |
| #117 | binge:ti,ab |
| #118 | {OR #105‐#117} |
| #119 | {OR #46, #62, #93, #104, #118} |
| #120 | MeSH descriptor: [Adolescent] explode all trees |
| #121 | MeSH descriptor: [Child] this term only |
| #122 | (child or children or adolescen*):ti,ab |
| #123 | {OR #120‐#122} |
| #124 | {AND #4, #32, #119, #123} |
ERIC (Proquest)
3 separate searches conducted using the subject, title and abstract fields – duplicates then deleted
AB((School* OR ((primary OR elementary OR middle OR junior OR high OR secondary) AND student*) OR kinder*) ) AND AB((Implement* OR dissemin* OR adopt* OR practice* OR "organisational change*" OR "organizational change*" OR diffuse* OR "system* change*" OR "quality improvement*" OR transform* OR translat* OR transfer* OR uptake* OR sustainab* OR institutionali* OR routin* OR maintenance OR capacity OR incorporate* OR adher* OR program* OR integrat* OR "scal* up") ) AND AB((Obes* OR "Weight Gain" OR "Weight Loss" OR overweight OR "over weight" OR overeat* OR "over eat*" OR "weight change*" OR ((bmi OR body mass index) AND (gain OR loss OR change)) OR "Primary Prevention" OR "secondary prevention" OR "preventive measure*" OR "preventative measure" OR "preventive care" OR "preventative care" OR Exercise OR "physical activity" OR "physical inactivity" OR "Motor Activity" OR "physical education” or “physical training" OR "Physical Fitness" OR sedentary OR "Life Style" OR lifestyle OR "Leisure Activit*" OR sport* OR Dancing OR dance* OR aerobic* OR diet OR nutrition* OR "Child Nutrition Sciences" OR fruit* OR vegetable* OR canteen* OR "food service*" OR menu* OR calorie* OR kilojoule* OR "Energy Intake" OR "energy density" OR eating OR "Feeding Behavio*" OR "dietary intake" OR food OR "Carbonated Beverage*" OR "soft drink*" OR soda OR "sweetened drink*" OR "Dietary Fats" OR confectionar* OR "school lunch*" OR "school meal*" OR ((feeding OR food OR nutrition*) AND program*) OR cafeteria* OR smok* OR Tobacco OR Nicotine OR alcohol* OR drink* OR liquor* OR beer* OR wine* OR spirit* OR drunk* OR intoxicat* OR binge) ) AND AB(("clinical trial*" OR random* OR placebo* OR "Research Design" OR "Intervention Stud*" OR "Evaluation Stud*" OR "Comparative Stud*" OR "Longitudinal Stud*" OR "Cross‐Over Stud*" OR "latin square" OR “time series” OR ((before AND after) AND (stud* OR trial* OR design*)) OR ((singl* OR doubl* OR trebl* OR tripl*) AND (blind* OR mark)) OR (matched AND (communit* OR school* OR population*)) OR control* OR "comparison group*" OR "control group*" OR "matched pairs" OR "outcome stud*" OR qu?siexperimental OR "qua?i experimental" OR "pseudo experimental" OR nonrandomized OR nonrandomised OR prospective* OR volunteer*)) AND AB(Child or children or teen* or adolescen*)
SU((School* OR ((primary OR elementary OR middle OR junior OR high OR secondary) AND student*) OR kinder*) ) AND SU((Implement* OR dissemin* OR adopt* OR practice* OR "organisational change*" OR "organizational change*" OR diffuse* OR "system* change*" OR "quality improvement*" OR transform* OR translat* OR transfer* OR uptake* OR sustainab* OR institutionali* OR routin* OR maintenance OR capacity OR incorporate* OR adher* OR program* OR integrat* OR "scal* up") ) AND SU((Obes* OR "Weight Gain" OR "Weight Loss" OR overweight OR "over weight" OR overeat* OR "over eat*" OR "weight change*" OR ((bmi OR body mass index) AND (gain OR loss OR change)) OR "Primary Prevention" OR "secondary prevention" OR "preventive measure*" OR "preventative measure" OR "preventive care" OR "preventative care" OR Exercise OR "physical activity" OR "physical inactivity" OR "Motor Activity" OR "physical education” or “physical training" OR "Physical Fitness" OR sedentary OR "Life Style" OR lifestyle OR "Leisure Activit*" OR sport* OR Dancing OR dance* OR aerobic* OR diet OR nutrition* OR "Child Nutrition Sciences" OR fruit* OR vegetable* OR canteen* OR "food service*" OR menu* OR calorie* OR kilojoule* OR "Energy Intake" OR "energy density" OR eating OR "Feeding Behavio*" OR "dietary intake" OR food OR "Carbonated Beverage*" OR "soft drink*" OR soda OR "sweetened drink*" OR "Dietary Fats" OR confectionar* OR "school lunch*" OR "school meal*" OR ((feeding OR food OR nutrition*) AND program*) OR cafeteria* OR smok* OR Tobacco OR Nicotine OR alcohol* OR drink* OR liquor* OR beer* OR wine* OR spirit* OR drunk* OR intoxicat* OR binge) ) AND SU(("clinical trial*" OR random* OR placebo* OR "Research Design" OR "Intervention Stud*" OR "Evaluation Stud*" OR "Comparative Stud*" OR "Longitudinal Stud*" OR "Cross‐Over Stud*" OR "latin square" OR “time series” OR ((before AND after) AND (stud* OR trial* OR design*)) OR ((singl* OR doubl* OR trebl* OR tripl*) AND (blind* OR mark)) OR (matched AND (communit* OR school* OR population*)) OR control* OR "comparison group*" OR "control group*" OR "matched pairs" OR "outcome stud*" OR qu?siexperimental OR "qua?i experimental" OR "pseudo experimental" OR nonrandomized OR nonrandomised OR prospective* OR volunteer*)) AND SU(Child or children or teen* or adolescen*)
TI((School* OR ((primary OR elementary OR middle OR junior OR high OR secondary) AND student*) OR kinder*) ) AND TI((Implement* OR dissemin* OR adopt* OR practice* OR "organisational change*" OR "organizational change*" OR diffuse* OR "system* change*" OR "quality improvement*" OR transform* OR translat* OR transfer* OR uptake* OR sustainab* OR institutionali* OR routin* OR maintenance OR capacity OR incorporate* OR adher* OR program* OR integrat* OR "scal* up") ) AND TI((Obes* OR "Weight Gain" OR "Weight Loss" OR overweight OR "over weight" OR overeat* OR "over eat*" OR "weight change*" OR ((bmi OR body mass index) AND (gain OR loss OR change)) OR "Primary Prevention" OR "secondary prevention" OR "preventive measure*" OR "preventative measure" OR "preventive care" OR "preventative care" OR Exercise OR "physical activity" OR "physical inactivity" OR "Motor Activity" OR "physical education” or “physical training" OR "Physical Fitness" OR sedentary OR "Life Style" OR lifestyle OR "Leisure Activit*" OR sport* OR Dancing OR dance* OR aerobic* OR diet OR nutrition* OR "Child Nutrition Sciences" OR fruit* OR vegetable* OR canteen* OR "food service*" OR menu* OR calorie* OR kilojoule* OR "Energy Intake" OR "energy density" OR eating OR "Feeding Behavio*" OR "dietary intake" OR food OR "Carbonated Beverage*" OR "soft drink*" OR soda OR "sweetened drink*" OR "Dietary Fats" OR confectionar* OR "school lunch*" OR "school meal*" OR ((feeding OR food OR nutrition*) AND program*) OR cafeteria* OR smok* OR Tobacco OR Nicotine OR alcohol* OR drink* OR liquor* OR beer* OR wine* OR spirit* OR drunk* OR intoxicat* OR binge) ) AND TI(("clinical trial*" OR random* OR placebo* OR "Research Design" OR "Intervention Stud*" OR "Evaluation Stud*" OR "Comparative Stud*" OR "Longitudinal Stud*" OR "Cross‐Over Stud*" OR "latin square" OR “time series” OR ((before AND after) AND (stud* OR trial* OR design*)) OR ((singl* OR doubl* OR trebl* OR tripl*) AND (blind* OR mark)) OR (matched AND (communit* OR school* OR population*)) OR control* OR "comparison group*" OR "control group*" OR "matched pairs" OR "outcome stud*" OR qu?siexperimental OR "qua?i experimental" OR "pseudo experimental" OR nonrandomized OR nonrandomised OR prospective* OR volunteer*)) AND TI(Child or children or teen* or adolescen*)
Dissertations & Theses (Proquest)
3 separate searches conducted using the subject, title and abstract fields – duplicates then deleted
Ab((School* OR ((primary OR elementary OR middle OR junior OR high OR secondary) AND student*) OR kinder*)) AND Ab ((Implement* OR dissemin* OR adopt* OR practice* OR "organisational change*" OR "organizational change*" OR diffuse* OR "system* change*" OR "quality improvement*" OR transform* OR translat* OR transfer* OR uptake* OR sustainab* OR institutionali* OR routin* OR maintenance OR capacity OR incorporate* OR adher* OR program* OR integrat* OR "scal* up")) AND Ab ((Obes* OR "Weight Gain" OR "Weight Loss" OR overweight OR "over weight" OR overeat* OR "over eat*" OR "weight change*" OR ((bmi OR body mass index) AND (gain OR loss OR change)) OR "Primary Prevention" OR "secondary prevention" OR "preventive measure*" OR "preventative measure" OR "preventive care" OR "preventative care" OR Exercise OR "physical activity" OR "physical inactivity" OR "Motor Activity" OR "physical education" OR "physical training" OR "Physical Fitness" OR sedentary OR "Life Style" OR lifestyle OR "Leisure Activit*" OR sport* OR Dancing OR dance* OR aerobic* OR diet OR nutrition* OR "Child Nutrition Sciences" OR fruit* OR vegetable* OR canteen* OR "food service*" OR menu* OR calorie* OR kilojoule* OR "Energy Intake" OR "energy density" OR eating OR "Feeding Behavio*" OR "dietary intake" OR food OR "Carbonated Beverage*" OR "soft drink*" OR soda OR "sweetened drink*" OR "Dietary Fats" OR confectionar* OR "school lunch*" OR "school meal*" OR ((feeding OR food OR nutrition*) AND program*) OR cafeteria* OR smok* OR Tobacco OR Nicotine OR alcohol* OR drink* OR liquor* OR beer* OR wine* OR spirit* OR drunk* OR intoxicat* OR binge)) AND Ab (("clinical trial*" OR random* OR placebo* OR "Research Design" OR "Intervention Stud*" OR "Evaluation Stud*" OR "Comparative Stud*" OR "Longitudinal Stud*" OR "Cross‐Over Stud*" OR "latin square" OR "time series" OR ((before AND after) AND (stud* OR trial* OR design*)) OR ((singl* OR doubl* OR trebl* OR tripl*) AND (blind* OR mark)) OR (matched AND (communit* OR school* OR population*)) OR control* OR "comparison group*" OR "control group*" OR "matched pairs" OR "outcome stud*" OR qu?siexperimental OR "qua?i experimental" OR "pseudo experimental" OR nonrandomized OR nonrandomised OR prospective* OR volunteer*)) AND Ab ((Child OR children OR teen* OR adolescen*))
ti((School* OR ((primary OR elementary OR middle OR junior OR high OR secondary) AND student*) OR kinder*)) AND ti ((Implement* OR dissemin* OR adopt* OR practice* OR "organisational change*" OR "organizational change*" OR diffuse* OR "system* change*" OR "quality improvement*" OR transform* OR translat* OR transfer* OR uptake* OR sustainab* OR institutionali* OR routin* OR maintenance OR capacity OR incorporate* OR adher* OR program* OR integrat* OR "scal* up")) AND ti ((Obes* OR "Weight Gain" OR "Weight Loss" OR overweight OR "over weight" OR overeat* OR "over eat*" OR "weight change*" OR ((bmi OR body mass index) AND (gain OR loss OR change)) OR "Primary Prevention" OR "secondary prevention" OR "preventive measure*" OR "preventative measure" OR "preventive care" OR "preventative care" OR Exercise OR "physical activity" OR "physical inactivity" OR "Motor Activity" OR "physical education" OR "physical training" OR "Physical Fitness" OR sedentary OR "Life Style" OR lifestyle OR "Leisure Activit*" OR sport* OR Dancing OR dance* OR aerobic* OR diet OR nutrition* OR "Child Nutrition Sciences" OR fruit* OR vegetable* OR canteen* OR "food service*" OR menu* OR calorie* OR kilojoule* OR "Energy Intake" OR "energy density" OR eating OR "Feeding Behavio*" OR "dietary intake" OR food OR "Carbonated Beverage*" OR "soft drink*" OR soda OR "sweetened drink*" OR "Dietary Fats" OR confectionar* OR "school lunch*" OR "school meal*" OR ((feeding OR food OR nutrition*) AND program*) OR cafeteria* OR smok* OR Tobacco OR Nicotine OR alcohol* OR drink* OR liquor* OR beer* OR wine* OR spirit* OR drunk* OR intoxicat* OR binge)) AND ti (("clinical trial*" OR random* OR placebo* OR "Research Design" OR "Intervention Stud*" OR "Evaluation Stud*" OR "Comparative Stud*" OR "Longitudinal Stud*" OR "Cross‐Over Stud*" OR "latin square" OR "time series" OR ((before AND after) AND (stud* OR trial* OR design*)) OR ((singl* OR doubl* OR trebl* OR tripl*) AND (blind* OR mark)) OR (matched AND (communit* OR school* OR population*)) OR control* OR "comparison group*" OR "control group*" OR "matched pairs" OR "outcome stud*" OR qu?siexperimental OR "qua?i experimental" OR "pseudo experimental" OR nonrandomized OR nonrandomised OR prospective* OR volunteer*)) AND ti ((Child OR children OR teen* OR adolescen*))
su((School* OR ((primary OR elementary OR middle OR junior OR high OR secondary) AND student*) OR kinder*)) AND su ((Implement* OR dissemin* OR adopt* OR practice* OR "organisational change*" OR "organizational change*" OR diffuse* OR "system* change*" OR "quality improvement*" OR transform* OR translat* OR transfer* OR uptake* OR sustainab* OR institutionali* OR routin* OR maintenance OR capacity OR incorporate* OR adher* OR program* OR integrat* OR "scal* up")) AND su ((Obes* OR "Weight Gain" OR "Weight Loss" OR overweight OR "over weight" OR overeat* OR "over eat*" OR "weight change*" OR ((bmi OR body mass index) AND (gain OR loss OR change)) OR "Primary Prevention" OR "secondary prevention" OR "preventive measure*" OR "preventative measure" OR "preventive care" OR "preventative care" OR Exercise OR "physical activity" OR "physical inactivity" OR "Motor Activity" OR "physical education" OR "physical training" OR "Physical Fitness" OR sedentary OR "Life Style" OR lifestyle OR "Leisure Activit*" OR sport* OR Dancing OR dance* OR aerobic* OR diet OR nutrition* OR "Child Nutrition Sciences" OR fruit* OR vegetable* OR canteen* OR "food service*" OR menu* OR calorie* OR kilojoule* OR "Energy Intake" OR "energy density" OR eating OR "Feeding Behavio*" OR "dietary intake" OR food OR "Carbonated Beverage*" OR "soft drink*" OR soda OR "sweetened drink*" OR "Dietary Fats" OR confectionar* OR "school lunch*" OR "school meal*" OR ((feeding OR food OR nutrition*) AND program*) OR cafeteria* OR smok* OR Tobacco OR Nicotine OR alcohol* OR drink* OR liquor* OR beer* OR wine* OR spirit* OR drunk* OR intoxicat* OR binge)) AND su (("clinical trial*" OR random* OR placebo* OR "Research Design" OR "Intervention Stud*" OR "Evaluation Stud*" OR "Comparative Stud*" OR "Longitudinal Stud*" OR "Cross‐Over Stud*" OR "latin square" OR "time series" OR ((before AND after) AND (stud* OR trial* OR design*)) OR ((singl* OR doubl* OR trebl* OR tripl*) AND (blind* OR mark)) OR (matched AND (communit* OR school* OR population*)) OR control* OR "comparison group*" OR "control group*" OR "matched pairs" OR "outcome stud*" OR qu?siexperimental OR "qua?i experimental" OR "pseudo experimental" OR nonrandomized OR nonrandomised OR prospective* OR volunteer*)) AND su ((Child OR children OR teen* OR adolescen*))
Scopus (Scopus)
TITLE‐ABS ( school* OR ( ( primary OR elementary OR middle OR junior OR high OR secondary ) AND student* ) OR kinder* ) AND TITLE‐ABS ( implement* OR dissemin* OR adopt* OR practice* OR "organisational change*" OR "organizational change*" OR diffuse* OR "system* change*" OR "quality improvement*" OR transform* OR translat* OR transfer* OR uptake* OR sustainab* OR institutionali* OR routin* OR maintenance OR capacity OR incorporate* OR adher* OR program* OR integrat* OR "scal* up" ) AND TITLE‐ABS ( obes* OR "Weight Gain" OR "Weight Loss" OR overweight OR "over weight" OR overeat* OR "over eat*" OR "weight change*" OR ( ( bmi OR body AND mass AND index ) AND ( gain OR loss OR change ) ) OR "Primary Prevention" OR "secondary prevention" OR "preventive measure*" OR "preventative measure" OR "preventive care" OR "preventative care" OR exercise OR "physical activity" OR "physical inactivity" OR "Motor Activity" OR "physical education" OR "physical training" OR "Physical Fitness" OR sedentary OR "Life Style" OR lifestyle OR "Leisure Activit*" OR sport* OR dancing OR dance* OR aerobic* OR diet OR nutrition* OR "Child Nutrition Sciences" OR fruit* OR vegetable* OR canteen* OR "food service*" OR menu* OR calorie* OR kilojoule* OR "Energy Intake" OR "energy density" OR eating OR "Feeding Behavio*" OR "dietary intake" OR food OR "Carbonated Beverage*" OR "soft drink*" OR soda OR "sweetened drink*" OR "Dietary Fats" OR confectionar* OR "school lunch*" OR "school meal*" OR ( ( feeding OR food OR nutrition* ) AND program* ) OR cafeteria* OR smok* OR tobacco OR nicotine OR alcohol* OR drink* OR liquor* OR beer* OR wine* OR spirit* OR drunk* OR intoxicat* OR binge ) AND TITLE‐ABS ( ( "clinical trial*" OR random* OR placebo* OR "Research Design" OR "Intervention Stud*" OR "Evaluation Stud*" OR "Comparative Stud*" OR "Longitudinal Stud*" OR "Cross‐Over Stud*" OR "latin square" OR "time series" OR ( ( before AND after ) AND ( stud* OR trial* OR design* ) ) OR ( ( singl* OR doubl* OR trebl* OR tripl* ) AND ( blind* OR mark ) ) OR ( matched AND ( communit* OR school* OR population* ) ) OR control* OR "comparison group*" OR "control group*" OR "matched pairs" OR "outcome stud*" OR qu?siexperimental OR "qua?i experimental" OR "pseudo experimental" OR nonrandomized OR nonrandomised OR prospective* OR volunteer* ) ) AND TITLE‐ABS ( child OR children OR teen* OR adolescen* ) AND AND ( LOAD‐DATE > 20210430 AND LOAD‐DATE < 20210801 ) AND ( LIMIT‐TO ( EXACTKEYWORD , "Human" ) ) AND ( LIMIT‐TO ( PUBYEAR, 2021 ) )
Appendix 2. Risk of bias assessment tool
|
RANDOM SEQUENCE GENERATION Selection bias (biased allocation to interventions) due to inadequate generation of a randomised sequence | |
| Criteria for a judgement of 'Low risk' of bias. | The investigators described a random component in the sequence generation process such as:
aMinimisation may be implemented without a random element, and this is considered to be equivalent to being random. |
| Criteria for the judgement of 'High risk' of bias. | The investigators described a non‐random component in the sequence generation process. Usually, the description would involve some systematic, non‐random approach, for example:
Other non‐random approaches happen much less frequently than the systematic approaches mentioned above and tend to be obvious. They usually involve judgement or some method of non‐random categorisation of participants, for example:
|
| Criteria for the judgement of 'Unclear risk' of bias. | Insufficient information about the sequence generation process to permit judgement of 'Low risk' or 'High risk'. |
|
ALLOCATION CONCEALMENT Selection bias (biased allocation to interventions) due to inadequate concealment of allocations prior to assignment | |
| Criteria for a judgement of 'Low risk' of bias. | Participants and investigators enrolling participants could not foresee assignment because 1 of the following, or an equivalent method, was used to conceal allocation:
|
| Criteria for the judgement of 'High risk' of bias. | Participants or investigators enrolling participants could possibly foresee assignments and thus introduce selection bias, such as allocation based on:
|
| Criteria for the judgement of 'Unclear risk' of bias. | Insufficient information to permit judgement of 'Low risk' or 'High risk'. This is usually the case if the method of concealment was not described or not described in sufficient detail to allow a definite judgement, e.g. if the use of assignment envelopes was described, but it remained unclear whether envelopes were sequentially numbered, opaque and sealed. |
|
BLINDING OF PARTICIPANTS AND PERSONNEL Performance bias due to knowledge of the allocated interventions by participants and personnel during the study | |
| Criteria for a judgement of 'Low risk' of bias. | Any 1 of the following:
|
| Criteria for the judgement of 'High risk' of bias. | Any 1 of the following:
|
| Criteria for the judgement of 'Unclear risk' of bias. | Any 1 of the following:
|
|
BLINDING OF OUTCOME ASSESSMENT Detection bias due to knowledge of the allocated interventions by outcome assessors | |
| Criteria for a judgement of 'Low risk' of bias. | Any 1 of the following:
|
| Criteria for the judgement of 'High risk' of bias. | Any 1 of the following:
|
| Criteria for the judgement of 'Unclear risk' of bias. | Any 1 of the following:
|
|
INCOMPLETE OUTCOME DATA Attrition bias due to amount, nature or handling of incomplete outcome data | |
| Criteria for a judgement of 'Low risk' of bias. | Any 1 of the following:
|
| Criteria for the judgement of 'High risk' of bias. | Any 1 of the following:
|
| Criteria for the judgement of 'Unclear risk' of bias. | Any 1 of the following:
|
|
SELECTIVE REPORTING Reporting bias due to selective outcome reporting | |
| Criteria for a judgement of 'Low risk' of bias. | Any of the following:
|
| Criteria for the judgement of 'High risk' of bias. | Any 1 of the following:
|
| Criteria for the judgement of 'Unclear risk' of bias. | Insufficient information to permit judgement of 'Low risk' or 'High risk'. It is likely that most studies will fall into this category. |
|
OTHER BIAS Bias due to problems not covered elsewhere in the table | |
| Criteria for a judgement of 'Low risk' of bias. | The study appeared free of other sources of bias. |
| Criteria for the judgement of 'High risk' of bias. | There is ≥ 1 important risk of bias. For example, the study:
|
| Criteria for the judgement of 'Unclear risk' of bias. | There may be a risk of bias, but there was either:
|
Data and analyses
Comparison 1. Primary outcome.
| Outcome or subgroup title | No. of studies | No. of participants | Statistical method | Effect size |
|---|---|---|---|---|
| 1.1 Implementation | 21 | Std. Mean Difference (IV, Random, 95% CI) | 1.04 [0.74, 1.34] |
1.1. Analysis.

Comparison 1: Primary outcome, Outcome 1: Implementation
Comparison 2. Secondary outcomes.
| Outcome or subgroup title | No. of studies | No. of participants | Statistical method | Effect size |
|---|---|---|---|---|
| 2.1 Nutrition | 11 | 16649 | Std. Mean Difference (IV, Random, 95% CI) | 0.08 [0.02, 0.15] |
| 2.2 Physical activity | 9 | 16389 | Std. Mean Difference (IV, Random, 95% CI) | 0.09 [‐0.02, 0.19] |
| 2.3 Obesity | 8 | 18618 | Std. Mean Difference (IV, Random, 95% CI) | ‐0.02 [‐0.05, 0.02] |
| 2.4 Tobacco | 3 | 3635 | Std. Mean Difference (IV, Fixed, 95% CI) | ‐0.03 [‐0.23, 0.18] |
Characteristics of studies
Characteristics of included studies [ordered by study ID]
Alaimo 2015.
| Study characteristics | ||
| Methods |
Trial name: School Nutrition Advances Kids (SNAK) Study design: non‐randomised Intervention duration: 2 overlapping cohorts: 1 year 9 month per cohort, 2 years 9 months both cohorts Cohort 1: 2007–2009 Cohort 2: 2008–2010 Length of follow‐up from baseline: follow‐up occurred in the next school year. Students in cohort 1 completed the baseline survey between November 2007 and March 2008 and the follow‐up survey between October and December 2008. Cohort 2 students completed baseline surveys between November 2008 and February 2009 and the follow‐up survey between October 2009 and January 2010. Differences in baseline characteristics: no differences among intervention groups with regard to school characteristics at baseline. There were some differences at baseline with regard to student dietary intake (all subsequent analyses adjusted for baseline dietary values). Table 2 reported difference at baseline in school characteristics. Some differences were apparent in school location and kitchen type but no P values were reported. Unit of allocation: school Unit of analysis: school |
|
| Participants |
School type: middle schools (seventh and eighth grades) Region: Michigan, USA Demographic/socioeconomic characteristics: low‐income middle schools (mean percentage of students eligible for free/reduced‐price meals for schools in the SNAK project was 68% (range 50–98%), which was similar to all Michigan low‐income middle schools in 2007 (72%; 514 schools). Inclusion/exclusion criteria Inclusion ‐ Having ≥ 50% of students eligible for free or reduced‐price meals and having seventh and eighth grades within the same building (for follow‐up purposes) ‐ Having ≥ 50% of students eligible for free or reduced‐price meals ‐ Having seventh and eighth grades within the same building Number of schools allocated Schools:75 (54 intervention, 21 control) Students:1777 seventh graders (completed baseline) 65 (3 intervention groups, 1 control group stated, but result reported according to 2 groups: intervention and control). Numbers by trial group: study contained 1 control and 3 intervention groups. Intervention groups consisted of 3 different programmes (or programme combinations) 1. the HSAT, 2. the HSAT plus the SNAK Team and 3. the HSAT plus the Michigan State Board of Education (MSBE) nutrition policy. The sample sizes by trial group follow: n (controls baseline) = 21 n (controls follow‐up) = 20 completed some aspect of the project. 17 completed FFQ n (interventions baseline) = 54 n (HSAT baseline) = 24 n (HSAT + SNAK baseline) = 5 n (HSAT + MSBE POLICY baseline) = 25 n (interventions follow‐up) = 45 completed some aspect of the project. 38 completed the FFQ n (HSAT follow‐up) = 18 completing some aspect and 16 with FFQ n (HSAT + SNAK follow‐up) = 5 completing some aspect and 4 with FFQ n (HSAT + MSBE POLICY follow‐up) = 22 completing some aspect and 18 with FFQ Recruitment Schools:recruited through an application for small grant funding with award values ranging from USD2000–4600 with recruitment methods included direct mailings, e‐mails and telephone calls to eligible schools, as well as a posting on the Michigan Team Nutrition website. Students:written parental consent and student assent Recruitment rate Schools: denominator unknown Students: 20.6% |
|
| Interventions |
Number of experimental conditions: 4 (3 intervention, 1 control, but reported according to 2 groups: intervention and control) Policies, practices or programmes targeted by the intervention The 3 policies, practices or programmes implemented in this study were the HSAT programme, the SNAK programme and the MSBE nutrition policy. ‐ Schools completed the HSAT concerning healthy eating and nutrition, and developed an action plan to improve school‐nutrition practices. ‐ Seventh‐grade student teams were formed in SNAK wherein the students implemented nutrition education and marketing. ‐ The MSBE is a nutrition policy recommending that schools offer and promote healthy foods and beverages in all competitive venues. Implementation strategies EPOC: tailored interventions ‐ The HSAT consisted of a tailored intervention (online assessment and action planning process). EPOC: educational outreach visits ‐ Provision of a facilitator (1 time to complete HSAT action plan). ‐ SNAK intervention group also received: facilitator/student meetings to assess student nutrition environment and policies. EPOC: external funding ‐ Incentives (USD1000 to implement nutrition education or implement aspects of their action plan). ‐ SNAK intervention group also received: incentives: USD1000 for students to implement student nutrition action plan. ‐ Curriculum developed for facilitator/student meetings. ‐ MSBE nutrition policy intervention schools were also received: USD1500 to compensate for any loss to food service revenue. EPOC: local consensus processes ‐ Co‐ordinated School Health Team EPOC: clinical practice guidelines ‐ Implementation of policy (2003 MSBE Healthy Food and Beverage Policy) in cafeteria à la carte lines (during second year) EPOC: educational materials ‐ Guidance documents and assistance were provided to schools, food service staff (MSBE group). Theoretical underpinning: not reported. Description of control: control group schools participated only in data collection during the study period and were offered the HSAT intervention after the last data collection point. |
|
| Outcomes |
Outcome relating to the implementation of school policies, practices or programmes ‐ Mean Nutrition Policy Change Score (range 0–6) ‐ Mean Nutrition Education or Practice Change Score (or both) (range 0–14) Data collection method: survey: the Middle‐School SEPS was completed either online or by paper (took approximately 30 minutes to complete). There were 2 versions of the survey: 1 for administrators/principals and 1 for food service directors/kitchen managers. Validity of measures used: not reported/self‐report methods. The authors commented that the tool was trialled to establish face and content validity; however, the tool was not subjected to rigorous validity testing. Outcome relating to cost: not reported Outcome relating to adverse consequences: not reported Outcome relating to child diet, PA or weight status: student‐level dietary intake Data collection method: the Block Kids Food Frequency Questionnaire 2004 (ages 8–17 years) at baseline and follow‐up Validity of measures used: not reported |
|
| Notes |
Research funding: Robert Wood Johnson Foundation's Healthy Eating Research Program, the Michigan Department of Community Health, and the USDA Supplemental Nutrition Assistance Program–Nutrition Education, supported by the Michigan Department of Human Services under contract numbers ADMIN‐07‐99010, ADMIN‐08‐99010, and ADMIN 09‐99010. Conflicts of interest: authors reported no competing financial interests. |
|
| Risk of bias | ||
| Bias | Authors' judgement | Support for judgement |
| Random sequence generation (selection bias) | High risk | Non‐randomised. Schools were allocated based on preference and were not randomly assigned to group resulting in high risk of selection bias. |
| Allocation concealment (selection bias) | High risk | Non‐randomised trial and no indication that allocation was concealed resulting in high risk of selection bias. |
| Blinding of participants and personnel (performance bias) Implementation outcome | High risk | Outcome group: all No blinding or incomplete blinding, and the outcome was likely to be influenced by lack of blinding. |
| Blinding of outcome assessment (detection bias) Implementation outcome | Unclear risk | Outcome group: number of school‐initiated nutrition policy and practice changes. No blinding of outcome assessment, and the outcome measurement is likely to be influenced by lack of blinding; self‐report considered high risk. Outcome group: mean nutrition policy change/nutrition education or practice change (SEPS). No blinding of outcome assessment, and the outcome measurement is likely to be influenced by lack of blinding; self‐report considered high risk. Outcome group: cafeteria à la carte and vending offerings. Self‐reported data from food service directors/other food service personnel and school administrators/principals. No blinding of outcome assessment, and the outcome measurement was likely to be influenced by lack of blinding; self‐report considered high risk. Outcome group: process data. Unclear if personnel conducting analysis of various process data sources blinded. |
| Incomplete outcome data (attrition bias) Implementation outcome | Low risk | Outcome group: practice and policy. Missing outcome data balanced in numbers across intervention groups, with similar reasons for missing data across groups. Outcome group: changes in à la carte/vending during lunch. 18% missing/unreliable data overall; however, relatively balanced across groups. Outcome group: number of school‐initiated nutrition practice changes; and number of school‐initiated nutrition policy changes. 5% missing data overall (3 schools), relatively balanced across groups but 2 schools missing from HSAT‐only group. |
| Selective reporting (reporting bias) | Unclear risk | No study protocol, therefore, it was unclear if there was selective outcome reporting. |
| Other bias | Low risk | Appeared free from other bias. |
| Potential confounding | Unclear risk | Insufficient information to determine the risk of potential confounders. |
| Overall risk of bias assessment | High risk | Most domains were at unclear or high risk of bias. |
Bremer 2018.
| Study characteristics | ||
| Methods |
Trial name: daily physical activity (DPA) programme Study design: non‐RCT Intervention duration: 20 consecutive weeks Length of follow‐up from baseline: baseline, mid‐intervention (10 weeks) and postintervention (within 2 weeks postintervention) Differences in baseline characteristics: significant difference in number of white people between experimental and control group (Chi2 (1) = 3.31, P = 0.07) Unit of allocation: class Unit of analysis: ‐ Implementation outcomes: class ‐ Behavioural/health outcomes: child |
|
| Participants |
School type: Catholic schools, grades 4–8 (ages 9–14 years) Region: Ontario, Canada Demographics/socioeconomic characteristics: not reported Inclusion/exclusion criteria: not reported Number of schools allocated Schools:7 Classes: 30 Students:362 Numbers by trial group n (controls baseline) = 11 control classes n (controls follow‐up) = 11 control classes n (interventions baseline) = 19 experimental classes n (interventions follow‐up) = 19 experimental classes Recruitment Schools: 7 schools from a local Catholic school board were chosen by the school board to participate. Teachers were asked to participate by their school administrators. 1–7 classes participated in each school, total of 30 participating classes. Students:all 783 students in the participating classes were approached to participate in the study. Recruitment rate Schools:not reported Students:46.2% |
|
| Interventions |
Number of experimental conditions: 2 (1 intervention and 1 control) Policies, practices or programmes targeted by the intervention: DPA policy implementation Implementation strategies EPOC: educational meetings ‐ School teachers and student leaders attended a 1‐day workshop on how to deliver the programme as part of regular school activities and were provided with instructional materials to take back to their school for programme delivery. EPOC: educational materials ‐ Provided with instructional materials EPOC: other ‐ Participation in a community 5 km at end of intervention Theoretical underpinning ‐ Of the evidence‐based intervention/policy/practice or programme: not reported ‐ Of the implementation strategy: not reported Description of control: the remaining teachers who chose not to participate in the programme were expected to provide DPA to their students, as per the Ontario education curriculum (i.e. usual practice). |
|
| Outcomes |
Outcome relating to the implementation of school policies, practices or programmes Outcomes included adherence to the programme, student behaviour, PA opportunities and student engagement in school‐based PA (i.e. number and length of PE classes and recesses per week). Data collection method: 21‐item questionnaire was developed for this study, and completed by the homeroom teacher at the last measurement point. Validity of measures used: not reported Outcome relating to cost: not reported Outcome relating to adverse consequences: not reported Outcome relating to child diet, PA or weight status: PA was assessed using the PAQ‐C Data collection method: PA was assessed with the PAQ‐C. The PAQ‐C was designed for children in grades 4–8 who had recess as a regular part of their school week. Validity of measures used: the PAQ‐C is a 9‐item 7‐day recall instrument that has good psychometric properties. |
|
| Notes |
Research funding: not reported Conflicts of interest: authors declared that they had no competing interests. |
|
| Risk of bias | ||
| Bias | Authors' judgement | Support for judgement |
| Random sequence generation (selection bias) | High risk | Not a randomised trial, as teachers selected whether or not their class would participate in the programme or to act as a control class. |
| Allocation concealment (selection bias) | High risk | No allocation concealment, participants (teachers) chose intervention or control. |
| Blinding of participants and personnel (performance bias) Implementation outcome | High risk | Outcome group: all The nature of the trial precluded blinding, participants (teachers) were not blind to allocation, and students would have acknowledged a change from usual practice. |
| Blinding of outcome assessment (detection bias) Implementation outcome | High risk | Outcome group: participants (teachers) High: participants were not blind to allocation. Also, self‐report would have contributed to further risk. Outcome group: students Unclear: students would have been able to tell group allocation though no details around this. |
| Incomplete outcome data (attrition bias) Implementation outcome | Unclear risk | Outcome group: teachers Unclear: unclear if there was any loss to follow‐up with the teachers. Outcome group: students Low: attrition by the study end was 16% in the intervention group and 20% among the controls (Chi2 = 0.57, df = 1, P = 0.45) |
| Selective reporting (reporting bias) | Low risk | Protocol available on US National Library of Medicine (ClinicalTrials.gov). All outcomes appeared to be accounted for. |
| Other bias | Unclear risk | Unclear if at risk of contamination. |
| Recruitment to cluster | Unclear risk | Unclear at what time recruitment to cluster occurred. |
| Baseline imbalance | High risk | Fewer control than intervention participants. Table 3 indicated significant differences between groups. Unclear if these are taken into account in analyses. |
| Loss of cluster | Unclear risk | Unclear if losses to follow‐up resulted in loss of cluster (especially in the control where there were limited numbers). |
| Incorrect analysis | Unclear risk | Unsure if clustering was taken into account in analyses. |
| Compatibility with individually randomised RCTs | Unclear risk | Unsure, no statement on this. Unable to determine if herd effect existed. |
| Potential confounding | Unclear risk | Unclear if baseline differences in intervention and control schools adjusted for in analysis. |
| Overall risk of bias assessment | Unclear risk | Most domains were at unclear risk of bias. |
Cheung 2018.
| Study characteristics | ||
| Methods |
Trial name: Power Up for 30 (PU30). Study design: non‐RCT Intervention duration: approximately 1 year (not explicitly stated) Length of follow‐up from baseline: baseline (2013–2014) and follow‐up (2015) Differences in baseline characteristics: PU30‐trained schools were more likely than untrained schools to be of high (> 75%) FRL but less likely to be of mid‐high FRL (50% < FRL ≤ 75%). Trained schools had a lower proportion of white students, had a higher proportion of Hispanic students, and were, on average, larger. A greater proportion of trained schools were in suburbs while more untrained schools were in rural areas. At baseline, PU30‐trained schools had 11 fewer minutes of recess, but 10 more minutes of in‐class PA breaks each week compared to untrained schools. Unit of allocation: school Unit of analysis Implementation outcomes: school Behavioural / health outcomes: PA frequency |
|
| Participants |
School type: Georgia public elementary schools Region: Georgia USA Demographics/socioeconomic characteristics: PU30‐trained schools were more likely than untrained schools to be of high (> 75%) FRL but less likely to be of mid‐high FRL (50% < FRL ≤ 75%). Trained schools had a lower proportion of white students, had a higher proportion of Hispanic students, and were, on average, larger. A greater proportion of trained schools were in suburbs while more untrained schools were in rural areas. Inclusion/exclusion criteria Inclusion:must have a completed survey from ≥ 1 administrator, 1 PE teacher, and 3 grade level chairs by September 2014 Exclusion:not reported Number of schools allocated Schools:159 schools Students:not reported Numbers by trial group n (controls baseline) = 80 schools n (controls follow‐up) = 62 schools n (interventions baseline) = 79 schools n (interventions follow‐up) = 71 schools Recruitment Schools:159 schools Students:not reported Recruitment rate Schools:not reported Students:not reported |
|
| Interventions |
Number of experimental conditions: 2 (1 intervention, 1 control) Policies, practices or programmes targeted by the intervention Training to increase adherence to policy, and PA opportunities offered (including frequency and duration). Implementation strategies EPOC: tailored interventions ‐ Telephone‐based technical support assisting with the engagement of school administrators and staff as well as selection of appropriate resources. EPOC: educational meetings ‐ Training workshop EPOC: educational materials ‐ Shared and modelled the use of low‐ and no‐cost resources including exercise DVDs, PowerPoint files, and an online resource guide containing links to web‐based PA videos, PA curricula, and integrated PA‐academic lessons; and monthly emailed newsletters. Theoretical underpinning ‐ Of the evidence‐based intervention/policy/practice or programme: not reported ‐ Of the implementation strategy: not reported Description of control 80 schools randomly selected to form the untrained comparison arm. |
|
| Outcomes |
Outcome relating to the implementation of school policies, practices or programmes Mean (standard deviation) minutes of PA offered per week during PE, during recess, during lunch, after school and before school. Data collection method: adapted school PA survey. PE teachers provided data regarding PE, before‐school and after‐school PA opportunities, while grade‐level chairs provided data on recess and in‐class PA breaks. PE teacher and grade‐level chair surveys, which took 10–15 minutes to complete, included subsets of questions from the larger administrator survey which provided data not used in the current study. Validity of measures used: not reported Outcome relating to cost: not reported Outcome relating to adverse consequences: not reported Outcome relating to child diet, PA or weight status: not reported Data collection method: not reported Validity of measures used: not reported |
|
| Notes |
Research funding: supported, in part, by Robert Wood Johnson Foundation (award number 71061), and support was given also from the Eunice Kennedy Shriver National Institute of Child Health and Human Development of the National Institutes of Health T32 Predoctoral Training Program in Reproductive, Perinatal, and Pediatric Epidemiology (award number T32HD052460). Conflicts of interest: not reported |
|
| Risk of bias | ||
| Bias | Authors' judgement | Support for judgement |
| Random sequence generation (selection bias) | High risk | Non‐randomised study. Randomly selected a pool of trained and untrained schools for study. |
| Allocation concealment (selection bias) | High risk | Non‐randomised intervention. |
| Blinding of participants and personnel (performance bias) Implementation outcome | High risk | Outcome group: nature of the trial precluded blinding. |
| Blinding of outcome assessment (detection bias) Implementation outcome | Unclear risk | Outcome group: all. Unclear/not stated whether data collectors/researchers were blinded. |
| Incomplete outcome data (attrition bias) Implementation outcome | Low risk | Outcome group: all. Reasonable level of follow‐up data. |
| Selective reporting (reporting bias) | Unclear risk | Unclear whether all planned outcomes were reported. |
| Other bias | Low risk | Did not appear to be at risk of contamination or other biases. |
| Recruitment to cluster | Unclear risk | Schools were included that provided baseline survey responses. Not enough information to make an assessment. |
| Baseline imbalance | Low risk | Baseline imbalances accounted for in analysis. |
| Loss of cluster | High risk | Loss of teachers to follow‐up indicated loss of clusters. 71/79 (90%) PU30 and 62/80 (78%) untrained schools provided follow‐up data between March 2015 and May 2015 from ≥ 1 PE teacher and ≥ 1 grade‐level chair. |
| Incorrect analysis | Low risk | Various methodology seems to account for baseline imbalances. Covariates included school baseline PA time, school‐level demographics and other school‐level characteristics. The unadjusted model assessed the impact of PU30 on PA opportunities alone using linear regression and generalised estimating equations, which accounted for clustering of multiple respondents per school and of schools within districts. |
| Compatibility with individually randomised RCTs | Unclear risk | Unclear, no statement regarding this. |
| Potential confounding | Low risk | Baseline differences accounted for in analysis. |
| Overall risk of bias assessment | Unclear risk | Most domains were at low or unclear risk of bias. |
Cunningham‐Sabo 2003.
| Study characteristics | ||
| Methods |
Trial name: Pathways Study design: cluster‐RCT (implementation outcome at group level – based of study design paper) Intervention duration: 3 years Length of follow‐up from baseline Food service component: 22 months Health behaviour and anthropometric outcomes:3 years (spring 1997 to spring 2000). Differences in baseline characteristics: not reported Unit of allocation: school Unit of analysis: school |
|
| Participants |
School type: primary schools Region: Arizona, New Mexico and South Dakota, USA Demographic/socioeconomic characteristics: not reported Inclusion/exclusion criteria Inclusion: ‐ A projected third grader enrolment of > 15 children ‐ > 90% of third‐grade children of American Indian ethnicity ‐ Retention from third to fifth grade over the past 3 years of > 70% ‐ School meals prepared and administered on‐site ‐ Availability of minimum facilities to deliver a PA programme at the school ‐ Approval of the study by school, community and tribal authorities Exclusion criteria ‐ Schools that were considering closing or merging in the next 3 years Number of schools allocated 39 schools (with a breakfast and lunch programme); 19 intervention, 20 control Numbers by trial group n (controls baseline) = 20 n (controls follow‐up) = 20 n (interventions baseline) = 19 n (interventions follow‐up) = 19 Recruitment Schools:cohort of > 1700 students in 41 schools (39 of which also had a breakfast programme) were followed from the third through the fifth grade. Students: not reported Recruitment rate: not reported |
|
| Interventions |
Number of experimental conditions: 2 (1 intervention, 1 control) Policies, practices or programmes targeted by the intervention The practices targeted by the implementation intervention strategies were: ‐ to lower the fat in school breakfast and lunch ‐ to reduce the fat contribution in meals to ≥ 30% of calories over 5 consecutive days Implementation strategies EPOC: clinical practice guidelines ‐ The food service intervention included the development of nutrient guidelines operationalised as behavioural guidelines. These behavioural guidelines included specific steps and skill‐building techniques for lowering the fat content of menu items. EPOC: educational outreach visits ‐ To support the behavioural guidelines, training sessions were conducted twice each school year with all food service staff. These training sessions were reinforced by ≥ 5 kitchen visits in the first year and ≥ 8 visits to each school in the second and third years. EPOC: educational materials ‐ Materials and activities for the training sessions and kitchen visits were developed to reinforce the behavioural guidelines, and included posters, a videotape, food demonstrations, taste‐testing lower‐fat food items and food quantity estimation activities. EPOC: educational meetings ‐ The food service working group, made up of nutrition research staff, some of whom were from the tribal communities involved in the study, met annually and held monthly conference calls to establish and carry out the intervention. Theoretical underpinning: Social Learning Theory and Principles of American Indian culture and practices. Description of control: not reported, but assume usual practice. |
|
| Outcomes |
Outcome relating to the implementation of school policies, practices or programmes ‐ % calories total fat breakfast (%) ‐ % energy from total fat Lunch (%) Data collection method: data collection included information on all school breakfast and lunch meal items. Data on all foods offered were recorded on data forms completed by the school food service manager. Data included menus; recipes; vendor products with labels and nutrient information on all prepared, processed and packaged foods. All schools had a Pathways notebook with forms to be completed for each meal per day. On the form, each food item was listed with a complete description of the food (e.g. raw carrots, canned whole kernel corn, etc.), the serving size, and the number of students served the food. Separate forms were completed for breakfast and lunch. The lead Pathways nutritionist at each of the four sites had overall responsibility for the data collection at their site. School breakfast menus and recipes were entered into the NUTRITION DATA SYSTEM. The nutrient composition was computed by taking the weighted nutrient mean of all food items offered and served within each meal component category (milk, breads, fruits, vegetables, entrées, desserts (if served) and condiments) and summing the nutrient means for all meal components to generate a nutrient total for a single school breakfast and for a single school lunch. 5‐day school breakfast means were then calculated as well as 5‐day school lunch means. Validity of measures used: not reported/self‐report methods. While the authors reported that the data collector and cook/manager reviewed all data forms together for accuracy and completeness and that an individual with an advanced degree in nutrition or related area or a registered dietitian (or both) cross‐checked all forms for completeness and clarity, it is not explicitly reported that the tool/measurement methods were validated or that a validated nutrition collection tool was used. Outcome relating to cost: not reported Outcome relating to adverse consequences: adverse effects of the intervention on growth Data collection method: weight and height were measured annually Validity of measures used: not reported Outcome relating to child diet, PA or weight status: anthropometric data and dietary intake of total energy intake, percentage energy from fat Data collection method Anthropometric data: height, weight, BMI and percentage body fat: ‐ Weight was measured with the use of self‐calibrating precision digital scales (Seca 770; Vogel and Halke GmbH, Hamburg, Germany) ‐ Height was measured with a fixed Shorr measuring board (Shorr Productions, Olney, Maryland, USA). ‐ 2 measurements were obtained and the mean was recorded. ‐ % body fat: estimated from bioelectrical impedance and anthropometry with the use of an equation developed and validated specifically for this study. Bioelectrical impedance was measured in duplicate with a single‐frequency tetrapolar plethysmograph (Valhalla Scientific, Valhalla, New York, USA). Dietary intake:24 dietary recall and direct observation Validity of measures used Anthropometric data: % body fat equation was validated specifically for this study. Dietary intake:not reported |
|
| Notes |
Other intervention components included the following.
Research funding: supported by funding grants HL‐50867, HL‐50869, HL50905, HL50885, and HL‐50907 from the National Heart, Lung, and Blood Institute. Conflicts of interest: authors reported no competing financial interests. |
|
| Risk of bias | ||
| Bias | Authors' judgement | Support for judgement |
| Random sequence generation (selection bias) | Unclear risk | Random sequence generation procedure not described. |
| Allocation concealment (selection bias) | Unclear risk | No information provided about allocation concealment and, therefore, it was unclear if allocation was concealed. |
| Blinding of participants and personnel (performance bias) Implementation outcome | High risk | Outcome group: all/menu and recipes (nutrient and food groups) and school menu data collection. Given the nature of the intervention, participants and study personnel are likely to have been aware of study allocation and, therefore, high risk of performance bias. Outcome: child BMI and adverse effects, Low: objectively measured. |
| Blinding of outcome assessment (detection bias) Implementation outcome | High risk | Outcome group: all/menu and recipe (nutrient and food groups) and school menu data collection. No blinding of outcome assessment, and the outcome measurement is likely to be influenced by lack of blinding; self‐report considered high risk. Outcome group: objective measures (BMI and adverse effects). Low: blinding would not impact objective measure. |
| Incomplete outcome data (attrition bias) Implementation outcome | Low risk | Outcome group: all outcomes. Low risk of attrition bias given that 39/41 schools that included breakfast were included in analysis. Loss to follow‐up among students similar (about 17%) for intervention and control groups. ITT analysis only conducted on body fat % outcome. |
| Selective reporting (reporting bias) | Low risk | Design paper available and outcomes reported are consistent. ajcn.nutrition.org/content/69/4/760S.full.pdf+html |
| Other bias | Unclear risk | Unclear if at risk of contamination due to unclear randomisation procedures. |
| Overall risk of bias assessment | Unclear risk | Most domains were at low or unclear risk of bias. |
Delk 2014.
| Study characteristics | ||
| Methods |
Trial name: brief intervention conducted as part of the Central Texas CATCH. The larger scope of the Central Texas CATCH programme (reported by Hoelscher and colleagues 2001 and Springer and colleagues 2012) was excluded as the programme did not report implementation outcomes appropriate for this review. Study design: cluster‐RCT Intervention duration: 2009–2012 Length of follow‐up from baseline: assessment occurred at 2 measurement periods, once in March and April 2011, and again in March and April 2012, during the second and third years of CATCH implementation, respectively. Differences in baseline characteristics: schools were matched in size and composition of student ethnicity and economic disadvantage. Baseline demographic characteristics were reported to be similar between groups. Unit of allocation: schools Unit of analysis: school teachers |
|
| Participants |
School type: middle school (grades 6–8) Region: Central Texas, USA Demographic/socioeconomic characteristics: multi‐ethnic sample Inclusion criteria ‐ Grades (6–8) Number of services allocated: 30 Numbers by trial group: 30 central‐Texas middle schools were assigned to 1 of 3 conditions: training‐only (Basic), training plus facilitator support (Basic Plus), and training/facilitator support and a social marketing campaign (Basic Plus SM). There were 10 schools in each condition. Recruitment Schools: middle schools were selected to participate in the evaluation of the CATCH Middle School programme Recruitment rate Schools:30/32 = 94% |
|
| Interventions |
Number of experimental conditions: 3 (3 intervention groups) Policies, practices or programmes targeted by the intervention To promote the adoption of ABs by classroom teachers Implementation strategies Training‐only (Basic) received EPOC: local consensus process and clinical practice guidelines ‐ A CATCH Middle School Abs guide was developed wherein PE and classroom teachers assisted in developing the guide by reviewing ABs from a variety of sources for ease of use and potential to generate PA and reinforce academic content. The guide included 55 ABs. Each school received 10 hard copies of the ABs and an electronic version to upload on the school's shared drive so that all teachers could access them. EPOC: local consensus process and educational meetings ‐ A CATCH Team was developed at each school. The CATCH Team comprised faculty and staff members, parents and community members, with 1 member designated the CATCH Champion. The team was charged with overseeing the implementation of the CATCH programme at their school, which included encouraging teachers to conduct ABs. CATCH programme training's took place to promote the adoption of ABs by classroom teachers. Schools were required to send representatives from their CATCH Team to 8 CATCH training's conducted at regular intervals from September 2009 to January 2012. At these training sessions, CATCH Team members were introduced to the concept of ABs and were provided with research that supports the use of ABs to enhance academic performance. In addition to the aforementioned EPOC strategies the Basic Plus groups also received: EPOC: educational outreach visits and tailored interventions ‐ A CATCH facilitator was assigned and conducted monthly visits at these schools. During these visits they helped CATCH Teams devise strategies to promote ABs on their campus. These strategies included faculty meeting presentations explaining the benefits of ABs and regular teacher‐led demonstrations of ABs to faculty; placement of ABs on the school’s shared drive so teachers could access them easily; periodic e‐mail reminders to teachers; and scheduling of a school‐wide time to conduct ABs. In addition to all the aforementioned implementation strategies, the Basic Plus SM group also received: EPOC: other ‐ Social marketing campaigns to promote PA. Theoretical underpinning: not reported Description of control: there was no control group. All groups received varying amounts of implementation support (strategies). |
|
| Outcomes |
Outcome relating to the implementation of school policies, practices or programmes Teacher reported frequency of AB implementation including: ‐ Have you conducted ≥ 1 AB this year? ‐ % of teachers that conducted ABs weekly (%, n) ‐ Last week, did you conduct an AB on ≥ 1 day? (%, n) Data collection method: survey. Survey was a 15‐item, self‐administered questionnaire that included items on teacher implementation of ABs, encouragement of specific health behaviours, and other process evaluation measures for the CATCH programme. Validity of measures used: not reported/self‐report methods. Outcome relating to cost: not reported Outcome relating to adverse consequences: not reported Outcome relating to child diet, PA or weight status: not reported |
|
| Notes |
Research funding: Michael & Susan Dell Foundation. Conflicts of interest: not reported |
|
| Risk of bias | ||
| Bias | Authors' judgement | Support for judgement |
| Random sequence generation (selection bias) | Unclear risk | Schools were matched on size and composition of student ethnicity and economic disadvantage and then randomly assigned to 1 of the 3 study conditions – no other information. |
| Allocation concealment (selection bias) | Unclear risk | No information provided. |
| Blinding of participants and personnel (performance bias) Implementation outcome | High risk | Little information. Unclear if blinding of key study participants and personnel attempted, but likely that the blinding could have been broken, and the outcome was likely to be influenced by lack of blinding. |
| Blinding of outcome assessment (detection bias) Implementation outcome | High risk | Blinding of outcome assessment unclear, but likely that the blinding could have been broken, or the outcome measurement was likely to be influenced by lack of blinding. The CATCH Teacher Survey was created to assess the implementation of the CATCH programme, including ABs, by classroom teachers. The survey is a 15‐item, self‐administered questionnaire that included items on teacher implementation of ABs, encouragement of specific health behaviours and other process evaluation measures for the CATCH programme. |
| Incomplete outcome data (attrition bias) Implementation outcome | High risk | Response rates varied among the conditions (Basic = 56.2%, Basic Plus = 69.7% and Basic Plus SM = 83.2%, in measurement period 1 and Basic = 59.1%, Basic Plus = 48.9% and Basic Plus SM = 75.4% in measurement period 2). All surveys from 1 Basic condition school, 15 surveys in total, were excluded from analysis at both measurement periods due to a low response rate (9%, n = 6) at measurement period 1. Additionally, 54 surveys from measurement period 1 and 58 surveys from measurement period 2 were excluded from analysis because the teacher only taught PE or athletics (or both). |
| Selective reporting (reporting bias) | Unclear risk | No study protocol, therefore, it was unclear if there was selective outcome reporting. |
| Other bias | Unclear risk | Unclear if contamination occurred at training session between groups. |
| Recruitment to cluster | Unclear risk | Insufficient information provided. |
| Baseline imbalance | Low risk | The demographic characteristics of students and schools across the 3 conditions were similar at baseline. |
| Loss of cluster | High risk | All surveys from 1 Basic condition school, 15 surveys in total, were excluded from analysis at both measurement periods due to a low response rate (9%, n = 6) at measurement period 1. |
| Incorrect analysis | High risk | No account of clustering. Significant differences across conditions within each measurement period, and by conditions across measurement periods, were assessed by Chi2 for categorical outcomes and by analysis of variance (ANOVA) with a Scheffe post hoc test for continuous outcomes. |
| Compatibility with individually randomised RCTs | Unclear risk | Unable to determine if a herd effect existed. |
| Overall risk of bias assessment | Unclear risk | Most domains were at unclear risk of bias. |
de Villiers 2015.
| Study characteristics | ||
| Methods |
Trial name: HealthKick Study design: cluster‐RCT for implementation outcome Intervention duration: 3 years Length of follow‐up from baseline: 3 years Differences in baseline characteristics: not reported Unit of allocation: schools Unit of analysis: schools |
|
| Participants |
School type: elementary schools Region: Cape Town, South Africa Demographic/socioeconomic characteristics: historically disadvantaged, low‐income communities from an urban area close to the city of Cape Town and from 2 rural areas outside of Cape Town, South Africa Inclusion/exclusion criteria Inclusion ‐ Whether the principal expressed the need for a health promotion programme to be implemented in the school. ‐ The presence of a shop or vendor selling food items at the school. ‐ Unhealthy diet and lack of PA among learners and teachers selected as a top health priority by the school principal. ‐ The view of the education district level managers of the potential of schools to effect changes, subjectively taking into account functionality (i.e. functional school‐based support team; school management team), ethos (co‐operation, will, inclination) and viability of school (e.g. results/performance of schools). ‐ Distance from the research office (< 105 minutes' drive). Exclusion ‐ School size (schools with < 50 grade 4 learners were excluded). Number of schools allocated: 16 Numbers by trial group n (controls baseline) = 8 n (controls follow‐up) = 8 n (interventions baseline) = 8 n (interventions follow‐up) = 8 Recruitment Schools:the HealthKick study comprised 16 eligible schools selected from the representative sample of 100 primary schools surveyed in 2 conveniently selected educations districts (1 urban and 1 rural) in the Western Cape Province of South Africa during the formative phase of the study. Students: not reported Recruitment rate: not clear |
|
| Interventions |
Number of experimental conditions: 2 (1 intervention, 1 control) Policies, practices or programmes targeted by the intervention The HealthKick programme which was an adaptation of the National School Health Policy and Implementation Guidelines (since replaced by the Integrated School Health Policy (ISHP)). The specific objectives were to: ‐ Promote healthy eating habits. ‐ To develop an environment within the school and community that promotes and facilitates these objectives through an action planning process (APP). Implementation strategies EPOC:local opinion leaders ‐ To facilitate and drive the formal implementation of the APP, a champion (teacher) was identified at each school and they were encouraged to liaise with the project team whenever they required assistance. EPOC:educational materials ‐ An "educator’s manual" which contained an APP guide, a booklet for each action area containing guidelines for prioritising action as well as strategies to address identified priorities; the South African food‐based dietary guidelines; a poster listing the behaviour outcomes desired for the children; a poster for listing planned actions; and in 2011 a healthy lifestyle guide for teachers was included. ‐ A resource box with printed materials relating to a healthy lifestyle and its role in the school curriculum. ‐ A curriculum support manual integrating the HK goals with the existing Life Orientation curriculum, developed by an expert in a format familiar to educators. EPOC:educational outreach visits ‐ Optional intervention support was offered to the intervention schools in all 4 action areas during the 3 years of the intervention. The support took the form of structured activities by the research team to broaden the staff's knowledge and skills around actions to support a healthy lifestyle. Furthermore, the research team kept in regular contact with the schools who were encouraged to call for assistance/support from the research team at any time. EPOC:education meetings ‐ Implementation and nutrition training workshop. Theoretical underpinning: Social Ecological model Description of control: principals at schools in the control arm received a booklet with "tips" for healthy schools and a guide to resources that could be accessed to assist in creating a healthier school environment. No further engagement took place between the research team and these schools except for the annual learner and environmental survey (EPOC: educational material). |
|
| Outcomes |
Outcome relating to the implementation of school policies, practices or programmes ‐ School with shops selling fruit salad ‐ Vegetable gardens at schools ‐ Schools having nutrition‐related policies Data collection method ‐ Data from the situational analysis were used as baseline information and an adapted version of the principal questionnaire and observational schedule used during the formative assessment which was completed annually at all 16 schools. ‐ Principals and school staff involved with the school nutrition programme, tuck shops and vegetable gardens were interviewed using semi‐structured questionnaires. The interviews were conducted by members of the research team. As above and project officers acted as both implementers and outcome assessors. Interviews were recorded and transcribed, and the data managed with ATLAS.ti Qualitative Data Analysis. Initial data analysis involved coding the focus group data as group interviews (i.e. similar responses coded only once per group). Validity of measures used: not reported/self‐report methods Outcome relating to cost: not reported Outcome relating to adverse consequences: not reported Outcome relating to child diet, PA or weight status: student level dietary intake Data collection method: 24‐hour recall Validity of measures used: not reported |
|
| Notes |
Notes: PA was also a goal of the HealthKick Program; however, an implementation outcome was unavailable. Consequently, this trial is reported as a nutrition trial, with corresponding implementation strategies, and behavioural outcomes extracted. Research funding: World Diabetes Foundation. Conflicts of interest: authors reported no conflicts of interest. |
|
| Risk of bias | ||
| Bias | Authors' judgement | Support for judgement |
| Random sequence generation (selection bias) | Low risk | Random sequence generated by drawing the names of schools typed on folded white paper of exactly the same shape and size from a container. |
| Allocation concealment (selection bias) | Unclear risk | Although the authors' state that the allocation sequence was decided on by the project co‐ordinator before the selection took place, there is no description of whether this was concealed. |
| Blinding of participants and personnel (performance bias) Implementation outcome | High risk | Outcome group: there was no mention that participants and personnel were blinded. Team members served as both implementers and researchers due to limited resources and, therefore, a high risk of performance bias. |
| Blinding of outcome assessment (detection bias) Implementation outcome | High risk | Outcome group: self‐reported records were kept of all activities/events planned by the schools and the numbers that were carried out. Observation was not undertaken by an independent observer blind to group allocation. |
| Incomplete outcome data (attrition bias) Implementation outcome | Low risk | Outcome group: no schools dropped out over the 3 years. |
| Selective reporting (reporting bias) | Low risk | There were no unreported process evaluation outcomes according to those planned in the published protocol. |
| Other bias | Low risk | Appeared free from other bias. |
| Overall risk of bias assessment | Low risk | Most domains were at low risk of bias. |
Egan 2018.
| Study characteristics | ||
| Methods |
Trial name: PACES Study design: non‐RCT with pre–post control group Intervention duration: 3 consecutive academic semesters (about 12 months) Length of follow‐up from baseline: ‐ Baseline: data collected in autumn 2014 ‐ First intervention semester: spring 2015. 1‐on‐1, semi‐structured interview with each teacher participating in the intervention (9 teachers) end of spring 2015 Differences in baseline characteristics: not reported for baseline information Unit of allocation: schools Unit of analysis ‐ Implementation outcomes: school ‐ Behavioural/health outcomes: none |
|
| Participants |
School type: elementary schools Region: 4 local elementary schools in 2 school districts from a greater metropolitan area in 1 south‐eastern state. Demographics/socioeconomic characteristics ‐ Schools A and B were magnet schools (companion campuses, i.e. 2 separate school campuses that share administrators and curricula focus) from 1 school district and schools C and D were public schools from a different school district. ‐ Participating teachers (10 female, 2 male) aged 23–54 (mean 33.2, SD 10.3 years) and self‐identified as 11 non‐Hispanic white teachers and 1 African American teacher. The teachers' years of teaching experience ranged from 1 to 33 years (mean 10.2, SD 11.0 years). Inclusion/exclusion criteria Inclusion Participants were selected from 4 local elementary schools in 2 school districts from a greater metropolitan area in 1 southeastern state. School selection was based upon location (close proximity to the researchers' university), access (receptive to participating in research) and stated priorities (3 of the schools identified school health as a priority in their strategic plan). Exclusion For consistency teachers that taught outside grades 1–3 were excluded, as grade 3 was the highest grade in school B. Number of schools allocated Schools:4 (1 control, 3 intervention) Students:161 (within 4 schools) Teachers: 12 Numbers by trial group n (controls baseline): 1 school n (controls follow‐up): 1 school n (interventions baseline): 3 schools n (interventions follow‐up): 3 schools, 9 teachers Recruitment Schools:school selection was based upon location (close proximity to the researchers' university), access (receptive to participating in research) and stated priorities (3 schools identified school health as a priority in their strategic plan). The first 3 schools that accepted the invitation were assigned to participate (referred to from this point onward as schools A, B and C) to receive the PACES intervention. The fourth school (school D) agreed to participate as a waitlist control. Students:all 181 students in the participating teachers’ classrooms were eligible to participate, and 161 participated (48.45% female). Recruitment rate Schools:not reported Students:89% |
|
| Interventions |
Number of experimental conditions: 3 experimental conditions: 1. 3 experimental conditions + 1 waitlist control; 2. school A (treatment level 1): low implementer; and 3. school B and C (treatment levels 2/3): high implementer. Policies, practices or programmes targeted by the intervention: PA MI Implementation strategies EPOC: tailored interventions ‐ A member of the research team meeting with each teacher individually to share baseline PA and MI results, identify current MI strengths and areas for improvement, collaboratively set personalised MI goals, and consider suitable resources, including those posted on the community of practice (schools B and C). EPOC: educational outreach visits ‐ A member of the research team meeting with each teacher individually to share baseline PA and MI results, identify current MI strengths and areas for improvement, collaboratively set personalised MI goals, and consider suitable resources, including those posted on the community of practice (schools B and C). ‐ Additionally, preservice classroom teachers delivering physically active lessons and movement breaks in intervention classrooms (with the teacher present) ≥ 3 times (on data collection days) during PACES programme implementation (schools C). EPOC: educational meetings ‐ A member of the research team orienting each teacher to a virtual professional learning community, Move for Thought (moveforthought.ning.com). Also, the website included MI materials, videos, links and a blog for members to ask questions, share ideas and connect with fellow members (Schools A, B and C). EPOC: audit and feedback ‐ Strengths and areas for improvement, collaboratively set personalised MI goals (school B and C only). Theoretical underpinning ‐ Of the evidence‐based intervention/policy/practice or programme: not reported ‐ Of the implementation strategy: 3 partnership approaches (communities of practice, community‐based participatory research and service learning) were employed based on the partnership model of Webster and colleagues (Webster 2015). Description of control: waitlist control |
|
| Outcomes |
Outcome relating to the implementation of school policies, practices or programmes SOSMART video recordings, and implementation score based off recordings. Data collection method: coding of video recordings by research assistants using System for Observing Student Movement in Academic Routines and Transitions (SOSMART). The implementation score was calculated for each classroom at baseline and outcome to examine the effect of PACES on the extent of MI during the first year of the 2‐year intervention. The implementation score was calculated using a 2‐step process. First, the percentage of scans for 7 of the SOSMART variables was calculated at both baseline and outcome separately to determine the percent of time each variable was observed. Second, the percentage of time each variable was observed for baseline and for outcome for each teacher to create a baseline and outcome implementation score was totalled. After creating the implementation score at baseline and outcome for each teacher, the mean implementation score (baseline and outcome) for each group (treatment level 1, treatment level 2, treatment level 3, and control) was calculated. Validity of measures used ‐ The authors provided the reference of Russ and colleagues for validity and reliability (Russ 2016). Intraobserver reliability resulted in 97.5% agreement and exceeded 80% on all variables. Additionally, construct validity was supported for 8/11 MI variables. Outcome relating to cost: not reported Outcome relating to adverse consequences: not reported Outcome relating to child diet, PA or weight status: not reported Data collection method: not reported. Validity of measures used: not reported |
|
| Notes |
Research funding: this research did not receive any specific grant from funding agencies in the public, commercial or not‐for‐profit sectors. Conflicts of interest: authors declared there was no conflict of interest. |
|
| Risk of bias | ||
| Bias | Authors' judgement | Support for judgement |
| Random sequence generation (selection bias) | High risk | Non‐randomised study. |
| Allocation concealment (selection bias) | High risk | No blinding of allocation. |
| Blinding of participants and personnel (performance bias) Implementation outcome | High risk | Outcome group: all. The nature of the intervention precluded blinding. Community‐based participatory research involved a member of the research team meeting with each teacher individually to share baseline PA and MI results, identify current MI strengths and areas for improvement, collaboratively set personalised MI goals, and consider suitable resources, including those posted on the community of practice. |
| Blinding of outcome assessment (detection bias) Implementation outcome | High risk | Outcome group: objective data captured by trained data collectors. Teachers would have been aware of the outcome of interest. |
| Incomplete outcome data (attrition bias) Implementation outcome | Low risk | Outcome group: SOSMART implementation outcomes appear to be reported for all included schools. |
| Selective reporting (reporting bias) | Unclear risk | No protocol available for this study. |
| Other bias | Low risk | Did not appear to be at risk of contamination or other biases. |
| Potential confounding | Unclear risk | Unclear if confounding had occurred. Schools A and B were magnet schools (companion campuses, i.e. 2 separate school campuses that share administrators and curricula focus) from 1 school district. |
| Overall risk of bias assessment | Unclear risk | Most domains were at high and low risk of bias. |
Evenhuis 2020.
| Study characteristics | ||
| Methods |
Trial name: Guidelines for Healthier Canteens Study design: non‐RCT Intervention duration: 6‐month intervention, October 2015 to June 2016 Length of follow‐up from baseline: 6‐month follow‐up. Also, the protocol indicated the canteen scan was also taken at 3 months during the intervention. Differences in baseline characteristics: in intervention schools, slightly more girls followed the vocational education level (46.6%) compared to boys (41.4%), while the opposite occurred in control schools (girls 39.5%; boys 46.2%) Unit of allocation: school Unit of analysis Implementation outcomes: canteen scan by school (i.e. cluster). Behavioural/health outcomes: student questionnaire purchasing data (i.e. individual). |
|
| Participants |
School type: Dutch secondary schools Region: the Netherlands Demographics/socioeconomic characteristics: – Inclusion/exclusion criteria Inclusion ‐ Presence of a canteen ‐ Willingness to make their school canteen healthier ‐ Willingness to provide time and space for the investigators to measure outcomes in students, employees, and canteen workers Exclusion ‐ the school had already started to implement the recent developed Guidelines for Healthier Canteens ‐ in 2015, the school canteen had already been advised about how to reach a healthier canteen, by school canteen advisors. Number of schools allocated Schools:10 intervention, 10 control Students:1891 (at allocation) Numbers by trial group n (controls baseline) = schools 10, students 943 n (controls follow‐up) = schools 10, students 868 n (controls analysed) = schools 10, students 731 n (interventions baseline) = schools 10, students 948 n (interventions follow‐up) = schools 10, students 864 n (interventions analysed) = schools 10, students 645 Recruitment Schools:the schools, in western and central Netherlands, were recruited via the Netherlands Nutrition. Protocol stated this was done by email and telephone. Students:in all participating schools, students were recruited per class. In each school, 100 second or third‐year Dutch‐speaking students (aged 13–15 years) were recruited, equally distributed over the school's offered education levels. Parents and students received information about the study and the option to decline participation. Recruitment rate Schools:100% Students:– |
|
| Interventions |
Number of experimental conditions: 2 (intervention, control) Policies, practices or programmes targeted by the intervention Guidelines for Healthier Canteens (no other info reported) Implementation strategies EPOC: audit and feedback ‐ Canteen advisors measured the extent to which canteens met the Guidelines for Healthier Canteens, using the online tool "the Canteen Scan." EPOC: educational materials ‐ Stakeholders also received communication material; newsletter with information; closed Facebook community. EPOC: educational outreach visits or academic detailing ‐ School canteen advisors provided tailored advice in an advisory meeting. EPOC: tailored interventions ‐ School canteen advisors provided tailored advice in an advisory meeting. Theoretical underpinning ‐ Of the evidence‐based intervention/policy/practice or programme: not reported ‐ Of the implementation strategy: this plan was developed in a 3‐step approach based on the "Grol and Wensing Implementation of Change model" in collaboration with stakeholders. Description of control: waitlist – while control schools received only general information about the guidelines, although they also received the support after the intervention period. |
|
| Outcomes |
Outcome relating to the implementation of school policies, practices or programmes ‐ The Canteen Scan assessed the extent to which a canteen complies with the 4 subtopics of the Guidelines for Healthier Canteens: 1. a set of 4 basic conditions for all canteens, 2. the percentage of healthier foods and drinks available in the cafeteria (at the counter, display, racks) and 3. in vending machines and 4. the percentage of accessibility for healthier food and drink products. ‐ The "health level" of the school canteen was measured in all participating schools using the online Canteen Scan, filled out by a school canteen advisor. Data collection method: canteen advisor filled out online tool. Validity of measures used: satisfactorily on inter‐rater reliability and criterium validity if measured by a school canteen advisor, scoring > 0.60 on Weighted Cohen's Kappa. Outcome relating to cost: not reported Outcome relating to adverse consequences: not reported Outcome relating to child diet, PA or weight status: students reported their purchases via an online questionnaire filled out in a classroom under supervision of a teacher or researcher (or both). Data collection method: self‐report (i.e. questionnaire) Validity of measures used: the questions were derived from validated Dutch questionnaires, and the questionnaire was pretested for comprehensibility and length in a comparable population using the cognitive interview method think‐aloud. |
|
| Notes |
Research funding: Netherlands Organisation for Health Research and Development (ZonMw, Grant Number 50‐53100‐98‐043). Conflicts of interest: the authors declared no conflict of interest. The funders had no role in the design of the study; in the collection, analyses, or interpretation of data; in the writing of the manuscript, or in the decision to publish the results. |
|
| Risk of bias | ||
| Bias | Authors' judgement | Support for judgement |
| Random sequence generation (selection bias) | High risk | Non‐randomised trial. |
| Allocation concealment (selection bias) | High risk | Non‐randomised intervention. |
| Blinding of participants and personnel (performance bias) Implementation outcome | High risk | Outcome group: the nature of the study precluded blinding. |
| Blinding of outcome assessment (detection bias) Implementation outcome | High risk | Outcome group: canteen scan. High: self‐report considered high risk. Outcome group: student self‐report High: self‐report considered high risk. |
| Incomplete outcome data (attrition bias) Implementation outcome | Low risk | Outcome group: ?All. Low: there appeared to be data for all 20 schools who received an allocation. Outcome group: student self‐report Low: loss to follow‐up < 20%. They report excluding in analysis due to 0 purchases registered before and after the intervention as reason for not including in analysis. |
| Selective reporting (reporting bias) | Low risk | Protocol available, appeared to include all outcomes. |
| Other bias | Low risk | Did not appear to be at risk of contamination or other biases. |
| Recruitment to cluster | Unclear risk | Unclear at what point the students were recruited, whether it was before or after schools were assigned (assigning of school also unclear). |
| Baseline imbalance | Low risk | Low risk of baseline imbalance. The only minimal variation was that in intervention schools, slightly more girls followed the vocational education level (46.6%) compared to boys (41.4%), while the opposite was the case in control schools (girls, 39.5%; boys 46.2%). |
| Loss of cluster | Low risk | No loss of clusters. |
| Incorrect analysis | Low risk | Schools were accounted for in the models. |
| Compatibility with individually randomised RCTs | Unclear risk | No statement regarding this. |
| Potential confounding | Unclear risk | No statement regarding this. |
| Overall risk of bias assessment | Low risk | Most domains were at low risk of bias. |
Farmer 2017.
| Study characteristics | ||
| Methods |
Trial name: PLAY Study design: cluster‐RCT Intervention duration: 2 years Length of follow‐up from baseline: measurements were obtained at baseline, 1 year (2–3 months after changes to the intervention school play environments) and 2 years (follow‐up) Differences in baseline characteristics: none Unit of allocation: pairs of schools were created by matching for region, school roll and decile ranking, and were randomly assigned to intervention or control by tossing a coin. Unit of analysis Implementation outcomes: schools Behavioural/health outcomes: children |
|
| Participants |
School type: state primary schools Region: Auckland and Otago, New Zealand Demographics/socioeconomic characteristics: eligibility criteria required a school decile ranking 1–6. Also stated they recruited less‐advantaged schools; however, no further details were provided Inclusion/exclusion criteria Inclusion ‐ State primary schools (years 1–8 that were fully funded by the state and coeducational) with ≥ 150 pupils, and a school decile ranking of 1–6. New Zealand schools are ranked into deciles from 1 to 10, where 1 indicates the 10% of schools with the highest proportion of pupils from low socioeconomic areas and decile 10 indicates the 10% of schools with the lowest proportion. 11 schools met these criteria within the Otago region and 31 in Waitakere City (within the Auckland region). Exclusion ‐ Although all children in intervention schools were exposed to the intervention, only children in school years 2 and 4 were invited to participate in outcome assessments. Number of schools allocated Schools:8 intervention, 8 control Students:902 (444 control, 458 intervention) Numbers by trial group n (controls baseline) = 8 schools, 422 students n (controls follow‐up) = 8 schools, 369 children at 1 year, 325 children at 2 years n (interventions baseline) = 8 schools, 418 students n (interventions follow‐up) = 8 schools, 391 students at 1 year, 344 at 2 years Recruitment Schools:16 primary schools in the Otago (8 schools) and Auckland (8 schools) regions of New Zealand. 11 schools were approached in Otago and 10 in Auckland and recruitment stopped once 16 schools (8 in each region) provided informed consent to participate (November 2010 to March 2011). Students:children in school years 2 and 4 were invited to participate in outcome assessments. These years were chosen pragmatically to cover a wide age range (typically ages 6–9 years) and enable 2‐year outcomes to be collected. Information sheets and consent forms were sent home with all children in these year groups from each school, and signed consent was obtained from parents. Recruitment rate Schools:76% Students:50.5% |
|
| Interventions |
Number of experimental conditions: 2 (1 intervention and 1 control) Policies, practices or programmes targeted by the intervention PA policies within their school included; break time; using PA as a punishment; promotion of community activities; adequacy and availability of facilities during school/after hours; enjoyment and promotion of PA regardless of skill level; and amount and quality of PE safety issues. Implementation strategies EPOC: tailored interventions ‐ Each intervention school was provided with a list of tailored suggestions for improvements. EPOC: external funding ‐ Provision of funding to change environment… intervention schools were provided with initial start‐up funds of NZD15,000. EPOC: local consensus processes ‐ Researchers, play workers and school community worked together to develop a playground action plan that met the needs of each school community. EPOC: audit and feedback ‐ Baseline evaluations of their play space, each intervention school was provided with a list of tailored suggestions for improvements. Theoretical underpinning ‐ Of the evidence‐based intervention/policy/practice or programme: not reported ‐ Of the implementation strategy: not reported Description of control: usual care |
|
| Outcomes |
Outcome relating to the implementation of school policies, practices or programmes: evaluation of play environment (objective) Data collection method: qualified play workers conducted an evaluation of schedule of 7 items rating opportunities for 1. risk and challenge, 2. engagement with natural elements, 3. ability to actively manipulate and change the play environment (e.g. loose parts), 4. wheeled play (e.g. bicycles and skateboards), 5. ball games, 6. children to socialise and 7. quality of independent access (no restrictions on the ability to access all parts of the school). Each item was scored from 1 (very poor) to 5 (excellent) and an overall score was determined for the whole school play environment (maximum score of 35). Validity of measures used: not reported Outcome relating to cost: not reported Outcome relating to adverse consequences: not reported Outcome relating to child diet, PA or weight status: height, weight, BMI and accelerometer data Data collection method ‐ Children's height, weight and waist circumference were measured in light clothing without shoes using standard techniques during school time. Height was measured using a portable stadiometer (seca 213, Hamburg, Germany) and weight using electronic scales (seca 813, Seca, Seca 213, Hamburg, Germany). Waist circumference was measured at the umbilicus using a non‐elastic tape (Lufkin 2 m Executive Thinline w606PM, Apex Tool Group, Sparks, MD, USA). All measures were obtained in duplicate with a third undertaken if the first and second measures did not fall within the maximum allowable difference (0.5 cm for height, 0.5 kg for weight and 1.0 cm for waist), and the mean taken from the 2 closest measurements. BMI z‐scores were calculated using World Health Organization reference data. ‐ All children wore an accelerometer (ActiGraph GT3X, Actigraph Corp, Pensacola, Florida, USA) 24 hours per day for 7 days, positioned over the right hip (accelerometers were removed for bathing, showering and water‐based activities). Accelerometers were initialised using ActiLife (version 6, Actigraph Corp) in uniaxial mode using 15‐second epochs. Data were cleaned and scored using an automated script developed in MATLAB (MathWorks, Natick, Massachusetts, USA) that removes the appropriate sleep period for each day for each child individually, to avoid sleep being misclassified as sedentary time. A day was considered valid if there were ≥ 8 valid awake hours. Non‐wear time (awake hours only) was defined as ≥ 20 minutes of consecutive 0s. Validity of measures used: validated BMI z‐scores were calculated using World Health Organization reference data. Validated activity intensities were calculated using the Evenson cut‐points developed for children aged 5–8 years. |
|
| Notes |
Research funding: the PLAY study was funded by the Health Research Council of New Zealand and the Otago Diabetes Research Trust. Conflicts of interest: the authors declared no conflicts of interest. |
|
| Risk of bias | ||
| Bias | Authors' judgement | Support for judgement |
| Random sequence generation (selection bias) | Low risk | Cluster‐RCT. Schools were randomised to intervention or control conditions. Pairs of schools were created by matching for region, school roll and decile ranking, and were randomly assigned to intervention or control by tossing a coin. |
| Allocation concealment (selection bias) | High risk | No blinding or concealment. |
| Blinding of participants and personnel (performance bias) Implementation outcome | High risk | The nature of the trial precluded blinding, as intervention schools and students would know they were receiving an intervention and changing from usual practices. Outcome: objective measure (BMI) Low: blinding would not impact objective measure. |
| Blinding of outcome assessment (detection bias) Implementation outcome | High risk | Outcome group: principal (implementation outcome). High: self‐report was considered high risk. Outcome group: child PA and BMI. Low: researchers blinded to group allocation. |
| Incomplete outcome data (attrition bias) Implementation outcome | Unclear risk | Outcome group: policy outcome data. Unclear: unclear where they reported this, only the aspect of the play space. Did not provide information on loss to follow‐up for principals. Outcome group: child PA and BMI. Unclear: unclear how many participants had the accelerometer data removed from analysis. ITT analysis used. |
| Selective reporting (reporting bias) | High risk | Protocol did not include implementation data as an outcome even though this was a primary outcome. |
| Other bias | Low risk | Did not appear to be at risk of contamination or other biases. |
| Recruitment to cluster | Unclear risk | Unclear when recruitment of students took place. |
| Baseline imbalance | Low risk | Pairs matched to minimise baseline imbalance. Similar characteristics between groups at baseline though nothing reported for baseline characteristics of principals (implementation outcome). |
| Loss of cluster | Unclear risk | Outcome group: principal (implementation outcome), Unclear: did not report loss of principal. Outcome group: student outcome. Unclear: unclear where the number of participants were lost from, did not report a loss of cluster but did not report the number range in each cluster. |
| Incorrect analysis | Low risk | Adjusted for clustering. |
| Compatibility with individually randomised RCTs | Unclear risk | Unclear, no statement on this. |
| Overall risk of bias assessment | Unclear risk | Most domains were at unclear risk of bias. |
French 2004.
| Study characteristics | ||
| Methods |
Trial name: Trying Alternative Cafeteria Options in Schools (TACOS) Study design: cluster‐RCT Intervention duration: 2 years Length of follow‐up from baseline: 2 years Differences in baseline characteristics: similar Unit of allocation: schools Unit of analysis: schools and students |
|
| Participants |
School type: secondary schools Region: St Paul Metropolitan, Minneapolis, USA Demographic/socioeconomic characteristics: schools were predominantly urban. On average, 14% of students were non‐white (range 3–77%), and 9% were eligible for free lunch (range 1–57%). Food services for 2 schools were run by food service management companies, 18 schools by the school district food services, 19 schools prepared meals on‐site and 20 schools participated in the NSLP. Inclusion criteria ‐ Presence of an à la carte area in the school cafeteria operated by the school food service. ‐ A food service director and principal willing to take part in the study for 2 school years. ‐ A willingness to be randomly assigned to intervention or control group. ‐ Computerised à la carte sales data. ‐ A willingness to share these data with researchers, allow a mail‐based administration of student evaluation surveys, and allow student groups to collaborate with research staff on the development and implementation of school‐wide promotional activities involving foods offered in the à la carte area. Number of schools allocated: 20 Numbers by trial group n (controls baseline) = 10 n (controls follow‐up) = 10 n (interventions baseline) = 10 n (interventions follow‐up) = 10 Recruitment: not reported Recruitment rate: 80% Of the 25 eligible secondary schools invited to participate, 5 declined, primarily because of the respective food service directors' concern about the additional food service staff burden related to compliance with research protocols. To avoid contamination caused by schools sharing the same food service director, only 1 school per district was included in the study. For student survey mean response rates for the 3 surveys were 75%, 75%, and 77%, and did not differ significantly between intervention and control schools. |
|
| Interventions |
Number of experimental conditions: 2 (1 intervention, 1 control) Policies, practices or programmes targeted by the intervention Intervention consisted of increasing the availability of lower‐fat foods in cafeteria à la carte areas and implementing school‐wide, student‐based promotions of these lower‐fat foods. The goal was to increase lower‐fat à la carte food availability by 30% relative to baseline. The ultimate goal was to have 50% of products be lower fat. Implementation strategies EPOC: local consensus processes ‐ Quarterly meetings between research and food service staff were held to review progress towards goals. EPOC: tailored intervention ‐ Development of tailored lists of higher‐ and lower‐fat foods for schools. EPOC: education meetings ‐ TACOS staff worked with the student groups and their faculty advisors to train the students for specific promotional activities and to act as liaisons between students and the food service staff. EPOC: pay for performance ‐ Student groups were offered financial incentives for completing each promotion (from USD100 to USD300, depending on the complexity of the promotion). Theoretical underpinning: not reported Description of control: no intervention control |
|
| Outcomes |
Outcome relating to the implementation of school service policies, practices or programmes ‐ Students had seen posters in school about cafeteria food choices ‐ Students had heard any messages over public address system, in school ‐ Students had heard about any contests or events at school about cafeteria food choices ‐ Students had taken part in any taste tests, food samplings, or contests in the school cafeteria ‐ Percentage low‐fat à la carte foods Data collection method: to monitor the extent to which intervention schools implemented their lower‐fat à la carte food availability goals, trained research staff visited each intervention school every 3 weeks to record all foods offered at lunchtime in the à la carte areas. In addition, complete à la carte inventories in intervention and control schools were conducted by trained research staff at baseline and after the second intervention year. Student exposure to the TACOS intervention activities was assessed with a series of 4 questions on a mailed student survey. Validity of measures used: not reported. Both self‐reports and objective measures were used. Outcome relating to cost: not reported Outcome relating to adverse consequences: school food service revenue was reported. Data collection method: data on school food service revenues were collected at the end of each school semester from a same point‐of‐sales software program including revenues from student reimbursable lunches, student à la carte foods, total à la carte foods and total school food service revenues. Validity of measures used: not reported Outcome relating to child diet, PA or weight status: nutritional food choices 2 outcome measures assessing nutrition intake: 1. percentage of lower‐fat à la carte foods sold and 2. students' self‐reported food choices. Data collection method: 1. students' self‐reported food choices: student food choices were measured via a mailed survey to a random sample of 75 students per school, according to the Dillman method (Dillman 1978), during the autumn of 2000, the spring of 2001, and the spring of 2002. Surveys comprised 48 questions related to students’ food choices. 2. sales data were collected on a weekly basis in electronic format from school food service staff in each of the 20 schools. Validity of measures used: sales data: objective |
|
| Notes |
Research funding: supported by the National Institutes of Health (grant R18 HL61305). Conflicts of interest: not reported |
|
| Risk of bias | ||
| Bias | Authors' judgement | Support for judgement |
| Random sequence generation (selection bias) | Unclear risk | Schools were randomly allocated to experimental group. Random sequence generation procedure was not described. |
| Allocation concealment (selection bias) | Unclear risk | There was no information provided about allocation concealment and, therefore, it was unclear if allocation was concealed. |
| Blinding of participants and personnel (performance bias) Implementation outcome | High risk | Outcome group: student data and observations: no mention that students or TACOS staff were blinded. Outcome: adverse impact. Low: school revenue objective data. |
| Blinding of outcome assessment (detection bias) Implementation outcome | High risk | Outcome group: student data and observations: no mention that students or TACOS staff were blinded. Outcome: adverse impact. Low: school revenue objective data. |
| Incomplete outcome data (attrition bias) Implementation outcome | Low risk | Outcome group: all 20 secondary schools participated. |
| Selective reporting (reporting bias) | Unclear risk | There was no study protocol, therefore, it was unclear if there was selective outcome reporting. |
| Other bias | Low risk | Did not appear to be at risk of contamination. |
| Recruitment to cluster | Low risk | Schools were randomised to condition and those within each school participated. |
| Baseline imbalance | Low risk | Schools were randomised to condition. |
| Loss of cluster | Low risk | There were no losses of clusters. |
| Incorrect analysis | Unclear risk | Graphs of data by school showed that the first 3 weeks and last 3 weeks of each 40‐week academic year demonstrated excessive variation attributable to start‐up and termination process. Therefore, data from these weeks were excluded from the analysis. Unclear how the full analysis was performed. |
| Compatibility with individually randomised RCTs | Unclear risk | Unable to determine if a herd effect existed. |
| Overall risk of bias assessment | Unclear risk | Most domains were at unclear risk of bias. |
Gingiss 2006.
| Study characteristics | ||
| Methods |
Trial name: Texas Tobacco Prevention Initiative Study design: non‐randomised control (comparison group) Intervention duration: 2 years Length of follow‐up from baseline: 2 years (baseline in 2000 and 2 years later) Differences in baseline characteristics: no significant differences between schools Unit of allocation: schools Unit of analysis: schools |
|
| Participants |
School type: middle and high schools Region: East Texas, USA Demographic/socioeconomic characteristics: not reported Inclusion/exclusion criteria: not reported Number of schools allocated: 134 Numbers by trial group n (controls baseline) = not reported n (controls follow‐up) = not reported n (interventions baseline) = not reported n (interventions follow‐up) = not reported Recruitment School:the baseline sample of schools was randomly selected by Texas Department of State Health Services (TDSHS) in school year (SY) SY2000 from schools serving students in grades 6–12 in the East Texas study area. A representative sample of schools was selected. Participating schools were located in 69 districts in a 7‐county study area. The original SY2000 sample of 171 schools was drawn with probability proportional to study‐area size and school condition (intervention or comparison). Among these schools, 134 participated in the baseline study. This sample was retained and used in this SY2002 follow‐up. Student:not reported Recruitment rate: 134/171 (78.4%) |
|
| Interventions |
Number of experimental conditions: 2 (1 intervention, 1 control) Policies, practices or programmes targeted by the intervention ‐ Conduct tobacco‐use prevention education with the designated curriculums of Project Towards No Tobacco (TNT) at the middle school level and Not On Tobacco (NOT) at the high school level. ‐ Conduct ≥ 1 tobacco prevention event. ‐ Provide education and training for parents and staff regarding local policies and ordinances as well as state tobacco laws. ‐ Establish STARS, PALS, or Teens Against Tobacco Use (TATU) groups or other peer mentor programmes at the high school level. Implementation strategies EPOC: local consensus processes Contractual agreements were issued to intervention schools to: ‐ Participate in training organised by their Education Service Centres (ESC) on tobacco issues and curricula. ‐ Conduct tobacco‐use prevention education with the designated curriculums of Project TNT at the middle school level and NOT at the high school level. EPOC: educational outreach visits ‐ The Texas Tobacco Prevention Initiative placed a Tobacco Specialist at each of 4 regional ESC serving the East Texas study area. Their responsibilities included co‐ordination, distribution and management of funding, training and TA for intervention schools in respective service areas. EPOC: educational meetings ‐ Training to encourage planning and implementing the above activities based on the guidelines for school health programmes to prevent tobacco use and addiction. EPOC: external funding ‐ Each school received an allocation of approximately USD2000 per year to be used for materials, supplies and small equipment, in‐service release time, training and travel to tobacco‐related meetings. Theoretical underpinning: not reported Description of control: not reported, but assume usual practice |
|
| Outcomes |
Outcome relating to the implementation of school policies, practices or programmes ‐ Enforcement of school policy on tobacco use ‐ Instruction on tobacco prevention education ‐ Assessment of prevention programmes ‐ Student cessation support ‐ Teacher training for tobacco prevention education ‐ Establish or change school policy on tobacco use ‐ Faculty and staff cessation support ‐ Family involvement in student tobacco programmes ‐ Parental involvement in policy ‐ > 10 lessons Data collection method: self‐report surveys were mailed to the schools for both principals and health co‐ordinators. Validity of measures used: not reported/self‐report methods Data collection method: self‐report surveys were mailed to the schools for both principals and health co‐ordinators. Validity of measures used: not reported Outcome relating to cost: not reported Outcome relating to adverse consequences: not reported Outcome relating to child diet, PA or weight status: not reported |
|
| Notes |
Note: the Texas Tobacco Initiative was also a non‐randomised trial that did not report baseline data for the implementation outcomes, however, was included as the authors state that there were no differences between groups at baseline on these measures. Research funding: supported by funding from Texas Department of State Health Services. Conflicts of interest: not reported |
|
| Risk of bias | ||
| Bias | Authors' judgement | Support for judgement |
| Random sequence generation (selection bias) | High risk | Non‐randomised control (comparison group). It appeared that schools were not randomly assigned to the intervention or the comparison group and, therefore, high risk of selection bias. |
| Allocation concealment (selection bias) | High risk | Non‐randomised trial and there is no indication that allocation was concealed and, therefore, were at high risk of selection bias. |
| Blinding of participants and personnel (performance bias) Implementation outcome | High risk | Outcome group: there was no mention that participants or personnel were blinded to experimental group and, therefore, were at high risk of performance bias. |
| Blinding of outcome assessment (detection bias) Implementation outcome | High risk | Outcome group: there was no blinding of principals or health co‐ordinators described and the outcomes were likely to be influenced by the use of self‐reported questionnaires. |
| Incomplete outcome data (attrition bias) Implementation outcome | High risk | Outcome group: high attrition as 25 (19%) schools were lost for the principal survey and 50 (37%) schools for the health co‐ordinator survey. |
| Selective reporting (reporting bias) | Unclear risk | There was no study protocol, therefore, it was unclear if there was selective outcome reporting. |
| Other bias | Unclear risk | Study description unclear. The initiation of mandate to implement and evaluate tobacco prevention in East Texas may have contaminated comparison schools. |
| Potential confounding | High risk | There was no mention of measurement of potential confounders, or any attempt to adjust for confounders. |
| Overall risk of bias assessment | High risk | Most domains were at high risk of bias. |
Hager 2018.
| Study characteristics | ||
| Methods |
Trial name: Wellness Champions for Change (WCC) Study design: randomised, controlled school‐level pilot study, i.e. cluster‐RCT Intervention duration: 1 year Length of follow‐up from baseline: 1 year Differences in baseline characteristics: no significant differences in school demographics by intervention group. The schools reported having wellness teams was not different between groups. Unit of allocation: clusters – schools Unit of analysis ‐ Implementation outcomes: schools ‐ Behavioural/health outcomes: – |
|
| Participants |
School type: elementary, middle or high schools Region: Maryland school districts (mid‐Atlantic state), USA Demographics/socioeconomic characteristics ‐ Most schools (79.4%) had a FARMS rate > 40% ‐ Schools were located in a range of geographic locations, with nearly a third each in rural/town, suburban and urban areas. Inclusion/exclusion criteria Inclusion:schools were nominated based on 3 guidelines: ‐ A specified number of schools (range 6–15 schools/district, depending on the district size (the number of schools per district ranged from > 100 schools to < 10 schools)) ‐ Preference was given to schools with higher FARMS eligibility rates (> 40%) (per funder request, not a mandatory inclusion criterion) ‐ Only standard schools (e.g. no part‐day high schools or alternative schools) Exclusion:none. Number of schools allocated: Schools:63 schools (20 – WCC training + TA; 23 – WCC training; 20 – wait control) Students:– Numbers by trial group n (controls baseline) = 20 schools n (controls follow‐up) = 17 schools n (interventions WWC training plus TA baseline) = 20 schools n (interventions follow‐up WWC + TA) = 19 schools n (interventions WWC training baseline) = 23 schools n (interventions follow‐up WWC) = 19 schools Recruitment Districts:6 districts approached based on results from 2012–2013 state‐wide survey, indicating that the districts had a low proportion of schools (< 40%) with wellness teams. After a meeting with district leaders to explain the study, the leaders nominated schools within their district to participate. Schools:principals of nominated schools were emailed by the study team and asked to participate. Students:– Recruitment rate Districts: 83.3% Schools:100% Students:– |
|
| Interventions |
Number of experimental conditions: 3 randomised within district to: ‐ WCC training (6‐hour, single‐day teacher training) ‐ WCC training plus TA ‐ delayed training (control) Policies, practices or programmes targeted by the intervention The formation of a wellness team, whether wellness teams were active, and whether implementation of local wellness policy components occurred. Implementation strategies EPOC: tailored interventions ‐ Wellness teams tailored for individual school needs. EPOC: educational meetings ‐ The WCC training took place in August–September, before or at the beginning of the school year. In addition to providing TA, the wellness specialists led the WCC trainings. Wellness specialists attended a full‐day training on how to lead the WCC training session how to complete the School Health Index via the Alliance for a Healthier Generation website and TA provision. EPOC: external funding ‐ All participating districts were offered financial resources (about USD1000/school), with guidance that the funds could be used to purchase items to support Smarter Lunchroom initiatives, purchase supplies that supported wellness activities, pay for substitute time for trainings, pay a wellness champion stipend, or a combination of these. EPOC: educational materials ‐ Including a tool kit with detailed training notes and background readings. EPOC: local opinion leaders ‐ Schools nominated an individual to be the school wellness champion Theoretical underpinning ‐ Of the evidence‐based intervention/policy/practice or programme: the WCC training was to be developed based on Social Cognitive Theory. A single‐day training was developed for wellness team leaders based in both Social Cognitive Theory and Social Ecological Theory. Specifically, for Social Cognitive Theory, reciprocal determinism was a major thread throughout the training. ‐ Of the implementation strategy: formative research findings indicated the importance of 1. forming a wellness team; 2. having buy‐in and support from key stakeholders including teachers, principals, parents and district administrators; 3. offering resources (e.g. a list of healthy snacks or sample letters sent to parents); 4. building partnerships (e.g. partnering with parent, teacher and community groups to provide additional resources, creating school‐level clubs. Description of control: delayed control group that received training the following summer. |
|
| Outcomes |
Outcome relating to the implementation of school policies, practices or programmes Primary outcome variables: the formation of a wellness team, whether wellness teams were active, and whether implementation of local wellness policy components occurred. Data collection method: surveys were sent via e‐mail to a school administrator or the head of an ongoing wellness team, relying on a single respondent per school. Formation of wellness team: single survey item. The presence of a wellness team was determined by a single item, "My school had a school‐level wellness team responsible for implementing local wellness policies in place during the [2014‐2015 (baseline) or 2015‐2016 (follow‐up)] school year." Also, to determine whether wellness teams were active: an 8‐item active wellness team sum score was generated. Additionally, the occurrence of implementation of local wellness policy components was assessed by the Maryland Wellness Policies and Practices Project School Survey II. Validity of measures used ‐ The researchers measured local wellness policy implementation using a scale was adapted from the original Maryland Wellness Policies and Practices Project School Survey. The original scale (17 items) demonstrated test–retest reliability (Spearman correlation = 0.70; P < 0.001; item‐by‐item percent agreement = 75.6%) and high internal consistency (a = 0.923). Items in version II (29 items) were added based on the updated School Health Index and language in the local wellness policy proposed rule stemming from the HHFKA. The version II local wellness policy implementation scale also demonstrated high internal consistency (a = 0.933). Outcome relating to cost: not reported Outcome relating to adverse consequences: not reported Outcome relating to child diet, PA or weight status: not reported Data collection method: not reported Validity of measures used: not reported |
|
| Notes |
Research funding: USDA Team Nutrition Training Grant, Centers for Disease Control and Prevention Cooperative Agreement No.2B01OT009025 through the Maryland Department of Health, and the Summer Program in Obesity, Diabetes, and Nutrition Research Training Grant under National Institutes of Health Award No.T35DK095737. Conflicts of interest: not reported |
|
| Risk of bias | ||
| Bias | Authors' judgement | Support for judgement |
| Random sequence generation (selection bias) | Unclear risk | The schools themselves were randomised; however, the school district leaders nominated the schools initially. Additionally, during the intervention 2 schools randomised to the intervention arm were switched to the control and 3 schools randomised to the control were moved to the intervention group. |
| Allocation concealment (selection bias) | Unclear risk | Unclear, no statement regarding this. |
| Blinding of participants and personnel (performance bias) Implementation outcome | High risk | Outcome group: all outcomes. The nature of the study precluded blinding. |
| Blinding of outcome assessment (detection bias) Implementation outcome | High risk | Outcome group: all outcomes were assessed by self‐report. Self‐report is considered high risk as the participant is able to determine intervention outcomes. |
| Incomplete outcome data (attrition bias) Implementation outcome | Unclear risk | It was unclear from the information provided if attrition occurred (or to what extent) and if it was adjusted for during analysis. |
| Selective reporting (reporting bias) | Unclear risk | Unclear as no trial registration or protocol available to assess reporting bias. |
| Other bias | Unclear risk | Unclear if at risk of contamination. Did not appear at risk of other biases. |
| Recruitment to cluster | Low risk | Recruitment and baseline information collected prior to randomisation. |
| Baseline imbalance | Low risk | No major baseline imbalances. |
| Loss of cluster | Low risk | No loss of cluster. |
| Incorrect analysis | High risk | Clustering of schools within school district was not accounted for in the models because randomisation occurred within districts. |
| Compatibility with individually randomised RCTs | Unclear risk | No statement regarding this. |
| Overall risk of bias assessment | Unclear risk | Most domains were at unclear risk of bias. |
Heath 2002.
| Study characteristics | ||
| Methods |
Trial name: El Paso Coordinated Approach to Child Health (El Paso CATCH) Study design: non‐randomised Intervention duration: 1997–2000 Length of follow‐up from baseline: 3 years Differences in baseline characteristics: not reported Unit of allocation: schools Unit of analysis: schools |
|
| Participants |
School type: elementary schools Region: participants were 24 elementary schools from 5 school districts in West Texas and Eastern New Mexico. Demographic/socioeconomic characteristics: El Paso, Texas, a region dominated by the Mexican culture and low‐income families. Inclusion/exclusion criteria: not reported Number of schools allocated: 24 (20 intervention, 4 control) 4 schools served as controls, with the remaining 20 schools enrolled in the El Paso CATCH programme. 16 schools had baseline PA measures and 12 had baseline school meal assessments. PA behaviour during PE classes was assessed in third, fourth and fifth grades for 16 intervention schools and in third grade only for 4 intervention and the 4 control schools. Grades 3, 4 and 5 were reflected in school meal assessments for all schools. All but 2 schools (1 control and 1 intervention school) had PE with certified PE instructors. In these 2 schools, classroom teachers conducted PE for third grade only. Numbers by trial group n (controls baseline) = 4 n (controls follow‐up) = 4 n (interventions baseline) = 20 n (interventions follow‐up) = 20 Recruitment: not reported Recruitment rate: not reported |
|
| Interventions |
Number of experimental conditions: 2 (1 intervention, 1 control) Policies, practices or programmes targeted by the intervention CATCH intervention was delivered at school level to: Food service: ‐ To reduce the total fat content of food served to 30% ‐ To reduce the total sodium content to 600–1000 mg per serving Implementation strategies EPOC: educational meetings ‐ Staff received training sessions to deliver CATCH EPOC: educational outreach visits ‐ Staff received ongoing support visits to implement EATSMART/CATCH PE EPOC: educational materials ‐ Educational materials were provided to staff/schools. Smart choices manual was provided to all schools. Theoretical underpinning: Social Learning Theory and Organisational Change Description of control: not reported but assume usual practice |
|
| Outcomes |
Outcome relating to the implementation of school service policies, practices or programmes ‐ % fat in breakfast ‐ Sodium (mg) in breakfast ‐ % fat in lunch ‐ Sodium (mg) in lunch Data collection method: for both control and CATCH schools, school breakfast and lunch menus and their recipes were collected for 5 consecutive days during each semester in every year of the study. Recipes for these menus were obtained by interviewing cooks and kitchen managers in school cafeterias and by reviewing the cafeteria production sheets for each meal. Foods from the menus, production sheets and recipes were entered into a nutritional database that is especially useful for ethnic foods (ESHA Research Inc, Salem, Ore). Once the nutrient content of the meals was analysed, means of breakfast and lunch values across the 5 days of data collection were obtained. Validity of measures used: not reported/self‐report methods Outcome relating to cost: cost‐effectiveness analysis reported Outcome relating to adverse consequences: not reported Outcome relating to child diet, PA or weight status: BMI, waist‐to‐hip ratio and weight Data collection method: anthropometry was conducted in the late autumn or early spring semester (November, December, January or February) of each year of the project. ≥ 3 people were trained to collect these measurements. Validity of measures used: anthropometry was valid. Each person's measurements were compared with an experienced technician's values (the trainer), and reliability was established at a minimum of r = 0.90 for all measures before data collection. |
|
| Notes |
Note: this trial also contained a PA component as part of their policy, practice or programmes implemented; however, the trial was downgraded to a nutrition trial only as it did not report implementation outcomes for PA or in some instances, the direction and magnitude of effect was not known. Research funding: Patient Care and Outcomes Research Award programme from the American Heart Association (9970182N) and the Paso del Norte Health Foundation, El Paso, Texas. Conflicts of interest: not reported |
|
| Risk of bias | ||
| Bias | Authors' judgement | Support for judgement |
| Random sequence generation (selection bias) | High risk | Non‐randomised. 4 schools that were beginning the CATCH programme in 1999 were randomly selected and then 4 control schools that were not in the CATCH programme were selected by matching them to the intervention schools for district, relative location, number of PE teachers, number of cafeteria staff, size of third‐grade classes and size of school overall. |
| Allocation concealment (selection bias) | High risk | Non‐randomised. Intervention schools were in the CATCH programme while control schools were not in the CATCH programme. High risk of bias as no concealment of allocation. |
| Blinding of participants and personnel (performance bias) Implementation outcome | High risk | Outcome group: there was no blinding of participants or personnel described and performance is likely to be influenced by knowledge of group allocation. |
| Blinding of outcome assessment (detection bias) Implementation outcome | High risk | Outcome group: questionnaires were used to survey PE teachers, cafeteria staff and classroom teachers about the implementation of CATCH. There was no blinding of participants described and the outcome was likely to be influenced by the use of self‐reported questionnaires. |
| Incomplete outcome data (attrition bias) Implementation outcome | Low risk | Outcome group: no schools appeared to dropout. |
| Selective reporting (reporting bias) | Unclear risk | No study protocol, therefore, it was unclear if there was selective outcome reporting. |
| Other bias | Low risk | Appeared free from other bias. |
| Potential confounding | Unclear risk | Matched intervention and control schools for district, relative location, number of PE teachers, number of cafeteria staff, size of third‐grade classes and size of school overall. However, it is unknown whether all potential confounders were measured. |
| Overall risk of bias assessment | High risk | Most domains were at high risk of bias. |
Hodder 2017.
| Study characteristics | ||
| Methods |
Trial name: effectiveness of a pragmatic school based universal resilience intervention in reducing tobacco, alcohol and illicit substance use in a population of adolescents Study design: cluster‐RCT Intervention duration: 3 years Length of follow‐up from baseline Baseline: August–November 2011 Follow‐up: July–November 2014 Differences in baseline characteristics: there was no difference for any of the demographic characteristics Unit of allocation Schools Unit of analysis Implementation outcomes: schools (clusters) Behavioural/health outcomes: student (individual) |
|
| Participants |
School type: government or Catholic secondary school located in socioeconomically disadvantaged local government areas: year 7 at baseline, year 10 at follow‐up Region: 1 health district of NSW, Australia. Approximately 114,000 people aged 10–19 years resided in metropolitan, regional, rural and remote areas within the district. Demographics/socioeconomic characteristics Low SES status (< 990): intervention 55.6% students, control 59.5% students High SES status (> 990): intervention 44.4% students, control 40.5% students Remoteness (c) major city: intervention 39.1% students; control 47.1% students Remoteness (ARIA) Inner regional: intervention 29.7% students; control 32.1% students Remoteness (ARIA) Outer regional/remote: intervention 31.2% students; control 20.8% students Aboriginal/Torres Strait Islander: intervention 12.8% students, control 12.6% students Other ethnicity: intervention 12.3% students, control 7.9% students Inclusion/exclusion criteria Inclusion ‐ Government or Catholic secondary school located within a socioeconomically disadvantaged local government area ‐ Had enrolments in grades 7–10 (aged 12–16 years) ‐ Had > 400 total student enrolments Exclusion: ‐ Single gender schools ‐ Independent (private) ‐ Special educational needs ‐ Selective, central (for students aged 5–18 years) or boarding schools Number of schools allocated Schools:32 schools (20 intervention, 12 control) Students:4589 students (2823 intervention, 1766 control) (note, actually consenting students = 1909 intervention, 1206 control = 3115 total) Numbers by trial group n (controls baseline) = 12 schools, 1206 students n (controls follow‐up) = 12 schools, 844 students n (interventions baseline) = 20 schools, 1909 students n (interventions follow‐up) = 20 schools, 1261 students Recruitment Schools:eligible schools were approached in random order until a quota of 32 schools consented. Consenting schools were stratified according to participation in a government disadvantaged schools initiative (yes/no) and school size (medium 400–800/large > 800). Students:all students enrolled in grade 7 (first year at secondary school) and were eligible to participate in data collection. Active parental consent for student participation was sought via a mailed study information pack. A free call number was provided for parents who wished to decline. After 2 weeks, non‐responding parents were prompted via telephone by school‐affiliated staff who were blind to group allocation. Recruitment rate Schools:73% Students:67.9% of enrolled students, and 88.2% of students with parental consent |
|
| Interventions |
Number of experimental conditions: 2 (1 intervention group; 1 usual care group) Policies, practices or programmes targeted by the intervention Increase protective factors for alcohol consumption, which included: ‐ Age‐appropriate lessons (9 hours) on individual protective factors across school subjects ‐ Non‐curriculum programmes (9 hours) targeting protective factors ‐ Additional programme targeting protective factors for Aboriginal students ‐ Rewards and recognition programme ‐ Peer support/peer mentoring programmes ‐ Antibullying programmes ‐ Empowerment/leadership programmes ‐ Additional empowerment/leadership/mentoring programmes for Aboriginal students ‐ Aboriginal cultural awareness strategies ‐ Promotion/engagement of local community organisations/groups/clubs in school (e.g. charity organisations) ‐ Additional/enhanced consultation activities with Aboriginal community groups ‐ Promotion/engagement of health, community and youth services in the school ‐ Additional/enhanced Aboriginal community organisations promoted or engaged ‐ Referral pathways to health, community and youth services developed and promoted ‐ Strategies to increase parental involvement in school (e.g. school events) Implementation strategies EPOC: educational outreach visits ‐ Strategy review workshops. EPOC: educational meetings ‐ Engagement with school community including presentations at school staff meetings regarding planned intervention; and staff mental health training. EPOC: local consensus processes ‐ School intervention team formed EPOC: educational materials ‐ Implementation guide, resources and programmes, and tool and templates. EPOC: external funding ‐ AUD2000 per year EPOC: audit and feedback ‐ Feedback reports termly Theoretical underpinning ‐ Of the evidence‐based intervention/policy/practice or programme: not reported ‐ Of the implementation strategy: not reported Description of control: control schools implemented usual school curricula and policies which may have included protective factor strategies and resources similar to, or the same as, those systematically provided to the intervention schools, but were not provided with programme resources or support. A report describing baseline school‐level student substance use and protective factor characteristics was provided to control schools. |
|
| Outcomes |
Outcome relating to the implementation of school policies, practices or programmes: implementation of strategies targeting protective factors Data collection method: to assess intervention implementation by intervention schools, research staff reviewed school documents and recorded the delivery of intervention strategies monthly. In addition, at follow‐up, telephone‐based structured interviews were conducted with staff from both groups by interviewers regarding school implementation of intervention strategies and engagement with the intervention during the final year of intervention, school staff from intervention schools were asked their level of engagement with the intervention in the final year. Validity of measures used: not reported Outcome relating to cost: not reported Outcome relating to adverse consequences: not reported Outcome relating to child diet, PA or weight status: tobacco, alcohol, marijuana or other drug use, student and environment protective factors score Data collection method: substance‐use outcome data were collected using items from an ongoing Australian triennial survey of school students' health behaviours. Primary outcomes included tobacco use (ever and recent) alcohol (ever, recent and 'risky') use. Secondary outcomes included marijuana and other illicit substance use. The Resilience and Youth Development module of the California Healthy Kids Survey was used to measure individual and environmental protective factors. Validity of measures used: not reported |
|
| Notes |
Research funding: National Health and Medical Research Council, nib Foundation and Hunter New England Population Health and infrastructure support from the Hunter Medical Research Institute. Conflicts of interest: no competing interests declared. |
|
| Risk of bias | ||
| Bias | Authors' judgement | Support for judgement |
| Random sequence generation (selection bias) | Low risk | Primary outcome: then randomly allocated to intervention or control in a 20:12 block design ratio by an independent statistician using a random number function in Microsoft Excel prior to baseline data collection. |
| Allocation concealment (selection bias) | Unclear risk | Primary outcome: low risk, due to completion by trained statistician. However, the trial registration stated it was open with no blinding and, therefore, this was rated unclear. |
| Blinding of participants and personnel (performance bias) Implementation outcome | High risk | Primary outcome: high as schools/teachers were aware of group allocation. |
| Blinding of outcome assessment (detection bias) Implementation outcome | High risk | Outcome group: self‐report considered high risk. Outcome group: objective measures. Unclear: unclear if project staff who conducted secondary outcome analysis were blind to assessment (unlikely given the nature of the study). |
| Incomplete outcome data (attrition bias) Implementation outcome | Low risk | Primary outcome: all schools participated in follow‐up data collection, therefore, low risk. Outcome group: student behavioural outcome Low: loss to follow‐up > 20%; however, loss to follow‐up are explained and reasonable. Outcome group: staff interview. Low: loss < 20%. |
| Selective reporting (reporting bias) | High risk | Protocol manuscript available. Implementation costs not reported. PA, fruit and vegetable consumption, sexual activity student outcomes not reported (from trial registry). |
| Other bias | Unclear risk | Unclear if at risk of contamination. Appeared free of other biases. |
| Recruitment to cluster | Unclear risk | Unclear if students recruited prior or after cluster randomisation occurred. |
| Baseline imbalance | Unclear risk | Primary outcome: consenting schools were stratified according to participation in a government disadvantaged schools initiative (yes/no) 71 and school size (medium 400–800/large > 800). However, table 1 showed differences between school characteristics, and it was unclear in the analysis if these were adjusted for. |
| Loss of cluster | Low risk | Primary outcome: no loss of clusters, all schools completed baseline and follow‐up data collection. |
| Incorrect analysis | Unclear risk | No statement regarding clustering for implementation outcome. Reports Chi2 and t‐test analyses used to determine differences between schools. |
| Compatibility with individually randomised RCTs | Unclear risk | No statement regarding this. |
| Overall risk of bias assessment | Unclear risk | Most domains were at unclear risk of bias. |
Hoelscher 2010.
| Study characteristics | ||
| Methods |
Trial name: Travis County Coordinated Approach To Child Health (CATCH) trial Study design: non‐randomised Intervention duration: 4 years Length of follow‐up from baseline: 1 year Differences in baseline characteristics: not reported Unit of allocation: schools (elementary) Unit of analysis: classroom and students (elementary) |
|
| Participants |
School type: elementary schools Region: 4 school districts in Travis County, Texas, USA Demographic/socioeconomic characteristics: 53% female; 61% Hispanic, and 14% African American; and mean age of 9.9 years Inclusion/exclusion criteria ‐ Schools that included fourth grade classes ‐ ≥ 60% of school composition of economically disadvantaged students Number of schools allocated: 30 Numbers by trial group n (controls baseline) = 15 (CATCH BasicPlus (BP) Group) n (controls follow‐up) = 15 (CATCH BP group) n (interventions baseline) = 15 (CATCH BasicPlus and Community (BPC) group) n (interventions follow‐up) = 15 (CATCH BPC group) Recruitment: not reported Recruitment rate: not reported |
|
| Interventions |
Number of experimental conditions: 2 (1 intervention, 1 control) Policies, practices or programmes targeted by the intervention The objective of this CATCH programme was to target multiple aspects of the school environment, including the classroom, nutrition services and the cafeteria environment, PE activities, family and home environment, and, via school health promotion messages and events, the broader school community. This trial compared 2 versions of the CATCH programme, the CATCH BP and the CATCH BPC. The CATCH BPC included all components of the BP programme; however, schools were provided with additional support for building school and community partnerships and local decision‐making and capacity building related to PA and healthy eating promotion. Implementation strategies CATCH BP: EPOC: educational meetings ‐ Co‐ordinated school health CATCH training and booster training sessions. EPOC: educational materials ‐ CATCH programme materials, CATCH component co‐ordination kit and supplemental health promotion resources. EPOC: local consensus process ‐ CATCH Committee meetings EPOC: pay for performance ‐ CATCH Awards Program (recognition and funds for CATCH) EPOC: the use of information and communication technology ‐ School social marketing efforts EPOC: educational outreach visits ‐ CATCH facilitator support visits (1 visit/4–6 weeks). EPOC: other ‐ Family Fun night activities/events CATCH BPC included all of the above strategies plus: EPOC: educational outreach visits ‐ Additional CATCH facilitator visits (2–3 visits/4–6 weeks) EPOC: educational meetings ‐ CATCH Community “Best Practices” workshops (3/year) EPOC: local consensus process ‐ Community member required on CATCH Committee and CATCH Community "Best Practices" workshops (3/year) EPOC: other ‐ CDC School Health Index used as planning tool. EPOC: educational materials ‐ School programme and community health promotion activity guide Theoretical underpinning: elements of Social Ecological Theory and Social Cognitive Theory Description of control: low‐income schools. They received the CATCH BP intervention. Alternate active implementation strategy. |
|
| Outcomes |
Outcome relating to the implementation of school service policies, practices or programmes Continuous ‐ CATCH parent and extracurricular activities ‐ CATCH co‐ordinated healthy eating‐related activities ‐ CATCH co‐ordinated PA‐related activities ‐ Number of CATCH lessons taught ‐ Number of health lessons taught Dichotomous ‐ % Reporting CATCH lessons in schoolroom ‐ % Reporting that fruit usually served at lunch Data collection method: structured interview with CATCH Champion, self‐administered questionnaire for fourth grade classroom teachers and CATCH SPAN student questionnaire. Validity of measures used: not reported/self‐report methods. However, the authors commented that the teacher and Champion measurement tools were based on previous instruments used to measure the dissemination of the CATCH programme. The student survey used was modified from the SPAN study. The dietary intake, activity and process measures were self‐reported, all the measures were adopted from previous work by the study investigators and had demonstrated face validity, and had been evaluated for reproducibility. Outcome relating to cost: not reported Outcome relating to adverse consequences: not reported Outcome relating to child diet, PA or weight status: height, weight and BMI measurements along with student‐level dietary intake concerning their unhealthy food intake, food index score, fruit and vegetable intake and sweetened beverage consumption, sedentary behaviour and PA. Data collection method Weight status: weight measurements were collected using a Tanita BWB‐800S scale; a Perspectives Enterprise stadiometer was used to measure height. BMI was calculated using the standard formula, and BMI percentiles were calculated using the CDC 2000 growth charts. Dietary intake: student questionnaire Activity behaviours: student questionnaire PA:SOFIT Validity of measures used Weight status: validated: standard protocols were followed by trained and certified research staff. Dietary intake: student survey used was modified from the SPAN study. Activity behaviours: student survey used was modified from the SPAN study. PA:valid |
|
| Notes |
Research funding: Michael & Susan Dell Foundation. Conflicts of interest: some authors received funding from Flaghouse, Inc. and the Michael & Susan Dell Foundation for development, dissemination and evaluation of the CATCH programme. The University of Texas School of Public Health receives royalties based on sale of CATCH curriculum, of which 100% goes back into further research and development. The University of Minnesota receives royalties from Flaghouse, Inc. based on sale of CATCH curriculum materials, of which a portion is paid as royalties to the investigators. The remaining authors declared no conflict of interest. |
|
| Risk of bias | ||
| Bias | Authors' judgement | Support for judgement |
| Random sequence generation (selection bias) | High risk | Non‐randomised trial as it did not appear that the schools were randomised to experimental group. 15 CATCH BPC schools were matched to 15 similar low‐income CATCH BP schools by ethnicity and percentage economic disadvantaged. |
| Allocation concealment (selection bias) | High risk | Non‐randomised trial and there was no mention that allocation was concealed and, therefore, were at high risk of selection bias. |
| Blinding of participants and personnel (performance bias) Implementation outcome | High risk | Outcome group: there was no mention that participants or personnel were blinded to experimental group allocation and, therefore, risk of performance bias is high. |
| Blinding of outcome assessment (detection bias) Implementation outcome | High risk | Outcome group: school‐level observations and teacher and student surveys provided process measures. It was not reported that observers or participants were blinded to group allocation and, therefore, the risk of detection bias is high. |
| Incomplete outcome data (attrition bias) Implementation outcome | Low risk | Outcome group: there were no school dropouts reported. |
| Selective reporting (reporting bias) | Unclear risk | No study protocol, therefore, it was unclear if there was selective outcome reporting. |
| Other bias | Low risk | Appeared free from other bias. |
| Potential confounding | Unclear risk | CATCH BP and CATCH BPC schools were matched by ethnicity and percentage economic disadvantaged but it is unknown if there were other potential confounders that were not measured. |
| Overall risk of bias assessment | High risk | Most domains were at low or unclear risk of bias. |
Lytle 2006.
| Study characteristics | ||
| Methods |
Trial name: Teens Eating for Energy and Nutrition at School (TEENS) Study design: cluster‐RCT for implementation outcome Intervention duration: 2 years Length of follow‐up from baseline: 2.5 years (autumn 1998 to spring 2000) Differences in baseline characteristics: reported as none: quote: "Participation did not differ significantly by treatment condition or by student‐level dietary variables". Lytle 2004 (see under Lytle 2006) reports significant differences between intervention and control students completing diet recall (race/ethnicity and parents' highest education) and completing the student survey (race/ethnicity, parents' full‐time employment, parents' highest education). Unit of allocation: schools Unit of analysis: schools |
|
| Participants |
School type: middle schools Region: Minneapolis/St Paul Minnesota USA (lower‐income population) Demographic/socioeconomic characteristics: white (72.9%); and 19.8% were categorised as lower SES Inclusion/exclusion criteria Inclusion ‐ Schools required to have ≥ 20% of students in their district qualify for free or reduced‐price school lunch. ‐ Schools required to have both seventh and eighth graders attend their school and have ≥ 30 students in each of those grades. Number of schools allocated: 16 (8 intervention, 8 control) Numbers by trial group n (controls baseline) = 8 n (controls follow‐up) = 5 n (interventions baseline) = 8 n (interventions follow‐up) = 8 Recruitment Schools: schools agreeing to be in the study committed to the measurement protocol, randomisation to condition, and if randomised to the intervention condition, to the following intervention protocol: 1. offer all 10 sessions of the TEENS curriculum in each of the seventh and eighth grades, 2. allow the designated teacher to attend a full day of training each year, 3. allow for provision of a family education component and 4. allow school food service staff to be trained on modifying the school food environment. Parents:a subsample of parents was randomly selected to complete parent survey. Students:all students who were in seventh grade during the baseline data collection period were considered eligible to participate in TEENS. Recruitment rate Schools:20 of 33 = 61% Parents:67% of families completed the parents survey (343 families; 526 families sent the survey) Students: 3878 (95.8%) students completed the baseline survey, 3503 (90.3%) completed the interim survey, 3010 (77.6%) completed the follow‐up survey, sample for analysis of survey data was 2833 students who had survey data at baseline and follow‐up. |
|
| Interventions |
Number of experimental conditions: 2 (1 TEENS intervention, 2 control) Policies, practices or programmes targeted by the intervention ‐ TEENS was a school‐based intervention trial conducted in middle schools with a goal of developing and evaluating school and family‐linked intervention strategies to promote students' consumption of fruit, vegetables and lower fat snacks (FVLFS) ‐ The TEENS intervention included classroom, family, school policy and food service components. Implementation strategies EPOC: local opinion leaders and local consensus processes ‐ SNACs was established to convene school and parental stakeholders to discuss and propose school‐level policy to improve the school food environment. The composition of SNACs differed on a school‐to‐school basis but included as a minimum, a school administrator, food service staff, teacher, student and university staff member. EPOC: educational meetings and educational materials ‐ School food service intervention: the emphasis of the school food service intervention was on increasing the offerings and sales of FVLFS in the canteen and on the à la carte lines. District food service directors and workers from intervention schools attended training that emphasised the importance of offering more FVLFS, gave them new tools for promoting FVLFS, exposed food service workers to snacks and beverages that could be offered on the à la carte line that met the TEENS fat criteria of < 5 g of fat per serving, including taste testing of lower fat products, and offered a forum for sharing ideas between schools. TEENS interventionists also conducted on‐site training to help workers problem‐solve. Theoretical underpinning: used Social Cognitive Theory to inform the intervention plans Description of control: delayed intervention |
|
| Outcomes |
Outcome relating to the implementation of service policies, practices or programmes ‐ Food offered: foods to limit ‐ Foods offered: foods to promote ‐ Foods sold: foods to limit ‐ Food sold: foods to promote Data collection method School food environment/fruits, vegetables and salads:data on the fruits, vegetables and salads available on school cafeteria lunch lines were collected at 8 time points: baseline (autumn 1998), 6 interim time points and at follow‐up (spring 2000). Each data point included 5 consecutive days of meal information. Data collected included the total number of students served the meal pattern lunch, the types and amounts of fruit and vegetable choices offered and sold, and the number of vegetable salads sold. With a few exceptions, these data were extracted from schools' food production records. Periodic observations of school meals were conducted to confirm production records. School food environment/à la carte:a daily data collection form for à la carte items that categorised à la carte items and documented the number of items offered and sold in each category was developed based on their earlier work conducted on à la carte in schools and intervention goals. At baseline and follow‐up, TEENS evaluation staff observed and recorded all the foods and beverages that were offered and sold on à la carte lines for 5 days. 2 evaluation staff conducted independent reviews of the data categorisation and abstraction for data quality assurance. Data were summarised into categories of "Foods to Promote" and "Foods to Limit". "Foods to Promote" included snacks that were ≤ 5 g of fat, 100% fruit juice, water and low‐fat milk, fruits or vegetables offered, and other lower‐fat versions of popular entrées such as pizza or pretzels and cheese. "Foods to Limit" included all snacks that were > 5 g of fat, fruit drinks, and higher fat popular entrées such as regular pizza or nachos. Validity of measures used School food environment/fruits, vegetables and salads: not reported; however, objective measures for implementation outcome assessment were used. School food environment/à la carte: not reported; however, objective measures for implementation outcome assessment were used. Outcome relating to cost: not reported Outcome relating to adverse consequences: not reported Outcome relating to child diet, PA or weight status: student‐level fruit and vegetable intake and food choices Data collection method: student self‐report survey and 24‐hour recalls Validity of measures: 24‐hour recalls – not reported Student survey: fruit and vegetable component of survey had been validated. Provided a reference to where the psychometric properties of the measure had been described: survey development for assessing correlates of young adolescents' eating. |
|
| Notes |
Research funding: National Cancer Institute (5R01 CA71943‐03) and from the Minnesota Obesity Center. Conflicts of interest: not reported |
|
| Risk of bias | ||
| Bias | Authors' judgement | Support for judgement |
| Random sequence generation (selection bias) | Unclear risk | Schools were randomly allocated to experimental group. Random sequence generation procedure not described. |
| Allocation concealment (selection bias) | Unclear risk | No information provided about allocation concealment and, therefore, it was unclear if allocation was concealed. |
| Blinding of participants and personnel (performance bias) Implementation outcome | High risk | Outcome group: all Given the nature of the intervention, participants and study personnel were likely to have been aware of study allocation and, therefore, high risk of performance bias. |
| Blinding of outcome assessment (detection bias) Implementation outcome | Unclear risk | Outcome group: school food environment/fruits, vegetables and salads. Unclear if evaluation staff conducting data abstractions, observations and recording were blind to group allocation. Outcome group: school food environment/à la carte. Unclear if evaluation staff conducting data abstractions, observations and recording were blind to group allocation. |
| Incomplete outcome data (attrition bias) Implementation outcome | Low risk | Outcome group: school food environment/fruits, vegetables and salads There was no attrition (16/16) and, therefore, risk of attrition bias was low. |
| Selective reporting (reporting bias) | Unclear risk | No study protocol, therefore, it was unclear if there was selective outcome reporting. |
| Other bias | Low risk | Appeared free from other bias. |
| Overall risk of bias assessment | Unclear risk | Most domains were at low or unclear risk of bias. |
Mathur 2016.
| Study characteristics | ||
| Methods |
Trial name: Bihar School Teachers Study (BSTS) Study design: cluster‐RCT Intervention duration: 7 months Length of follow‐up from baseline: study was conducted in 2 waves over 2 consecutive academic years (2009–2010 and 2010–2011), each with 36 schools, 18 intervention and 18 control. Data were collected at 2 time points: 1. at baseline (at beginning of school year, i.e. Wave 1: June–July 2009; Wave 2: June–July 2010); and 2. immediately after intervention (at end of school year, i.e. Wave 1: March–April 2010; Wave 2: March–April 2011). Differences in baseline characteristics: sociodemographic characteristics and tobacco use patterns were comparable among participants in the intervention and control groups. Unit of allocation: school Unit of analysis: school personnel (with unit of analysis error) |
|
| Participants |
School type: government rural and urban schools representing grade levels 8–10 were selected. The assumption was made that this reflected high schools. Region: 10 districts of Bihar in India, which is situated in northeast India on the border with Nepal. Demographic/socioeconomic characteristics: authors reported the study was conducted in an area with fewer social and financial resources than much of India at the time of the study. In 2001, only 4% of Bihar households had tap drinking water (national average = 37%), and 10% had electricity had a source of lighting (56% nationwide). Inclusion/exclusion criteria Inclusion ‐ ≥ 8 teachers Exclusion ‐ School districts located in flood zones (because school closures would make intervention delivery unfeasible) Number of services allocated: 72 Numbers by trial group n (controls baseline) = 36 n (controls follow‐up) = 36 n (interventions baseline) = 36 n (interventions follow‐up) = 36 Recruitment: 72/86 schools Recruitment rate: 84% schools Note that no sample sizes for children in enrolled schools given. |
|
| Interventions |
Number of experimental conditions: 2 (1 intervention, 1 control) Policies, practices or programmes targeted by the intervention The BSTS was initiated to test the efficacy of a comprehensive tobacco control programme (known as the 'Tobacco‐Free Teachers/Tobacco‐Free Society' programme (TFT/TFS)) in increasing tobacco use cessation among teachers and promoting the adoption and implementation of school tobacco policies. The TFT/TFS targeted teachers as they have been identified as a high‐priority audience for tobacco control efforts in India, because they serve as role models for students. Implementation strategies EPOC: local opinion leader ‐ Each health educator was assigned a set of 5 or 6 schools in which to deliver the intervention, with assistance from a designated teacher at each school, termed as lead teacher. The lead teacher played the role of a liaison between the health educator and other school personnel at his/her school and was nominated by their school principal according to guidelines provided (being a non‐user/quitter of tobacco, being respected among teachers, possessing good leadership qualities and having willingness to give personal time for the programme). EPOC: continuous quality improvement ‐ Health educators offered ongoing technical support for the lead teachers through monthly school visits, telephone support and a mid‐year meeting with lead teachers from other intervention schools. The intervention protocol specified that health educators would conduct 1 visit per month to each school, for 6 visits over the 7 months of intervention delivery. During each visit, health educators met with the principal and lead teacher and conducted a group discussion with the teachers and other school personnel. The lead teacher also conducted 6–8 group discussions with the other teachers in the school, addressing the topic defined for that month. EPOC: education materials ‐ Programme materials. Schools were provided with supporting educational and programmatic materials including: posters (1 per theme); a calendar (displaying the monthly theme); a notice board to display materials; a suggestion box for the health educator/lead teacher to receive feedback/questions and self‐help quit booklets (a step‐by‐step guide to quitting, available for each teacher). EPOC: education meeting ‐ Each school appointed a lead teacher, who was trained to facilitate the programme on‐site during a 2‐day training provided by wave in a centralised location. Mid‐year refresher training was also provided health education sessions. Health education sessions were conducted twice per month at each school in the format of group discussions and were centred on 6 topics (themes): teachers as role models for tobacco control; health effects of tobacco; motivations to quit tobacco; skills to quit tobacco; dealing with withdrawal symptoms and maintaining abstinence from tobacco. The first session of each month was facilitated by the health educator and the second session was facilitated by the lead teacher 2 weeks later, with the health educator present as an observer. These sessions were usually conducted during lunch‐breaks (to avoid interference with teaching schedules) and engaged both tobacco users and non‐users. In‐depth protocols were created to ensure standardisation of intervention delivery of both health educator and lead teacher sessions. 12 sessions total were offered to each school. EPOC: local consensus process ‐ A tobacco policy workgroup was also formed in every school, with the responsibility of regularly announcing the policy and monitoring its implementation in each school as a way to build organisational support for quitters by creating a tobacco‐free school campus. Theoretical underpinning: Social Contextual Model of Health Behavior Change Description of control: delayed intervention |
|
| Outcomes |
Outcome relating to the implementation of school policies, practices or programmes ‐ Are any signs posted in your school warning that tobacco use is not allowed? ‐ The policy or rule is completely enforced Data collection method: school personnel survey Validity of measures used: not reported/self‐report methods Outcome relating to cost: not reported Outcome relating to adverse consequences: not reported Outcome relating to child diet, PA or weight status: tobacco use Data collection method: policy observation checklist Validity of measures used: objective |
|
| Notes |
Research funding: National Cancer Institute at the National Institutes of Health (5R01CA120958, 5K05 A108663). Conflicts of interest: none declared |
|
| Risk of bias | ||
| Bias | Authors' judgement | Support for judgement |
| Random sequence generation (selection bias) | Unclear risk | Cluster‐RCT. Random sequence generation not described. |
| Allocation concealment (selection bias) | Unclear risk | No information provided about allocation concealment and, therefore, it was unclear if allocation was concealed. |
| Blinding of participants and personnel (performance bias) Implementation outcome | High risk | Outcome group: policy observation checklist. Due to the nature of the intervention, unlikely that schools would have been blinded and, therefore, were at high risk of performance bias. Outcome group: school personnel survey. Unlikely that school personnel would have been blinded and, therefore, were at high risk of performance bias. |
| Blinding of outcome assessment (detection bias) Implementation outcome | High risk | Outcome group: policy observation checklist No mention that project staff who made the observations were blinded to group allocation. Outcome group: school personnel survey. School personnel reported data and, therefore, were at high risk of detection bias. |
| Incomplete outcome data (attrition bias) Implementation outcome | Low risk | Quote: "756 of 947 eligible participants completed the baseline survey (80% response rate) and 684 completed the post intervention survey (72% response rate)". Attrition was relatively equal across experimental arms for the survey. |
| Selective reporting (reporting bias) | Low risk | There were no unreported implementation outcomes according to those planned in the published protocol. |
| Other bias | Low risk | Did not appear to be at risk of contamination or other biases. |
| Recruitment to cluster | Low risk | Recruitment bias: individuals within each randomised cluster participated. |
| Baseline imbalance | Unclear risk | Baseline imbalance: not reported |
| Loss of cluster | Low risk | Loss of clusters: there was no loss of clusters. |
| Incorrect analysis | High risk | Incorrect analysis: no adjustment for clustering within schools appeared to have occurred. |
| Compatibility with individually randomised RCTs | Unclear risk | Compatibility with individually randomised RCTs (cluster‐RCTs): unable to determine. |
| Overall risk of bias assessment | Unclear risk | Most domains were at low or unclear risk of bias. |
McCormick 1995.
| Study characteristics | ||
| Methods |
Trial name: The North Carolina School Health and Tobacco Education Project (SHTEP)/Skills Management and Resistance Training (SMART) Study design: cluster‐RCT Intervention duration: 4 years Length of follow‐up from baseline: 4 years Differences in baseline characteristics: not reported Unit of allocation: school district Unit of analysis: school district and individual teachers |
|
| Participants |
School type: junior high or middle schools Region: North Carolina, USA Demographic/socioeconomic characteristics: not reported Inclusion/exclusion criteria: to be eligible for participation, a school district had to have ≥ 2 junior high or middle schools (51/140 school districts in North Carolina met this criterion). All teachers who were eligible to teach health. Number of schools allocated ‐ 21 districts (11 intervention, 10 control) ‐ Initial implementation = 69 teachers (51 intervention, 18 control) ‐ Maintained implementation = 136 teachers (86 intervention, 50 control) ‐ 42 schools Numbers by trial group n (controls baseline) = 10 n (controls follow‐up) = 10 n (interventions baseline) = 11 n (interventions follow‐up) = 11 Recruitment School districts:28 districts were randomly selected and a 5‐stage strategy was used to recruit districts to the study. After a school district agreed to participate, it was randomly assigned to either the experimental or control condition, resulting in 11 experimental and 10 control districts. Schools:in both experimental and control school districts, ≥ 2 schools and ≥ 2 classrooms per school participated in the study Teachers: all teachers in study districts identified by their schools as "eligible to teach health" were included in the sample. Students: not reported Recruitment rate School districts:21 school districts of 28 identified, therefore, 75% Schools:approximately 50 schools Teachers at baseline 69/115 = 60% Teachers at follow‐up 136/175 = 78% Classrooms: approximately 100 classrooms Students:approximately 3000 students exposed to 1 of the tobacco prevention curricula |
|
| Interventions |
Number of experimental conditions: 2 (1 intervention, 1 control) Policies, practices or programmes targeted by the intervention School health/tobacco prevention curricula (schools districts offered choice of 3: Growing Healthy, Teenage Health Teaching Modules, Project SMART). Implementation strategies EPOC: educational meetings ‐ Implementation intervention: in‐depth training for teachers and administrators on the use of the specific curriculum that had been adopted. EPOC: educational materials ‐ Schools were provided with curricular materials (schools chose the most suited of 3 options). EPOC: local consensus processes ‐ Signing of a Memorandum of Understanding: a Memorandum of Understanding, specifying which curriculum was adopted, how many lessons were to be taught, and how many classes would receive instruction, was signed by each district. Adoption intervention: process consultation for adoption. A consultation workshop was conducted with each experimental district to inform school personnel about the 3 health curricula that were being disseminated. Theoretical underpinning: diffusion of innovation Description of control: districts in the control conditions were mailed curricula materials and provided TA upon request, but did not receive the training sessions (EPOC: educational material). |
|
| Outcomes |
Outcome relating to the implementation of school policies, practices or programmes ‐ % later implementation of curriculum for school district ‐ Extent later implementation mean for school district (% of total curriculum activities taught) Data collection method: each teacher who was eligible to teach health received an implementation check sheet and was asked to indicate which activities were taught. Data were also aggregated at school district level. Assessed at year 4 follow‐up "later implementation". A dichotomous measure of implementation (i.e. yes/no) necessary but not sufficient to assess the implementation of a school health curriculum. Therefore, Implementation check sheets were also used to assess implementation as the percentage of total curriculum activities that were taught (extent of implementation). Validity of measures used: not reported/self‐report methods Data collection method: 13‐item measure of awareness and concern among teachers and administrators about tobacco use among students Validity of measures used: validity was not reported, although the authors reported the instrument was described elsewhere. Outcome relating to cost: not reported Outcome relating to adverse consequences: not reported Outcome relating to child diet, PA or weight status: not reported |
|
| Notes |
Research funding: National Cancer Institute (#5 R01 CA 459907‐02). Conflicts of interest: not reported |
|
| Risk of bias | ||
| Bias | Authors' judgement | Support for judgement |
| Random sequence generation (selection bias) | Unclear risk | Random sequence generation procedure not described. |
| Allocation concealment (selection bias) | Unclear risk | No information provided about allocation concealment and, therefore, it was unclear if allocation was concealed. |
| Blinding of participants and personnel (performance bias) Implementation outcome | High risk | Outcome group: all Given the nature of the intervention, participants and study personnel were likely to have been aware of study allocation and, therefore, high risk of performance bias. |
| Blinding of outcome assessment (detection bias) Implementation outcome | High risk | Outcome group: all. All outcomes subjective, self‐report. There was no mention of blinding of participants and personnel. Teachers completed check sheets that assessed their delivery of curricula activities and researchers conducted site visits at implementing schools. High risk of performance bias as the implementation outcomes likely to be influenced by knowledge of group allocation. |
| Incomplete outcome data (attrition bias) Implementation outcome | High risk | Outcome group: organisational climate. The implementation measures represent cross‐sectional assessments. There was low attrition as only 1 experimental and 1 control district dropped out of the study (low risk of bias). Outcome group: organisational size Organisational size represented the total student enrolment for each school district and was obtained from North Carolina Department of Public Instruction records. The smallest district had 4134 students and the largest district had 29,532 students. Intervention = 9 districts (82%) Control = 7 districts (70%) Imbalance across intervention and control district response (high risk of bias) Outcome group: time of adoption Time of adoption range 9.57–19.86 weeks Intervention = 8 districts (73%) Control = 7 districts (70%) (high risk of bias) Outcome group: Awareness – concern – interest The response rate for teacher's awareness and interest was 69% (n = 432), and for concern was 52% (n = 324). Insufficient reporting of attrition/exclusions to permit judgement of 'Low risk' or 'High risk' (e.g. no reasons for missing data provided) (unclear risk of bias). Outcome group: Level of Use – District District level grouping of Level of Use instruments sent to teachers (252/570 returned, response rate 44%). Mean percent of implementation for each district reported. Intervention = 9 districts (82%) Control = 7 districts (70%) Imbalance across intervention and control district response (high risk of bias). Outcome group: Level of Use – Teacher Of the 570 Level of Use instruments sent to teachers, 252 were returned and completed, for a response rate of 44%. Only the Level of Use instruments for School Health and Tobacco Education Project curricula were analysed (n = 71). Intervention = 52 teachers Control = 20 teachers Insufficient reporting of attrition/exclusions to permit judgement of 'Low risk' or 'High risk' (e.g. no reasons for missing data provided) (unclear risk of bias). Outcome group: Implementation Checklist – District Initial implementation Intervention = 8 districts (73%) Control = 6 districts (60%) Later implementation Intervention = 8 districts (73%) Control = 6 districts (60%) Imbalance across intervention and control district response (high risk of bias). Outcome group: Implementation Checklist – Teachers During the third year, 115 Implementation Checksheets were sent to teachers and 69 were returned (60%). Later implementation was measured in year 4 of the project. During this year, 136/175 (78%) Implementation Checksheets were returned. Insufficient reporting of attrition/exclusions to permit judgement of 'Low risk' or 'High risk' (no reasons for missing data provided) (unclear risk of bias). |
| Selective reporting (reporting bias) | Unclear risk | No study protocol, therefore, it was unclear if there was selective outcome reporting. |
| Other bias | Low risk | Did not appear to be at risk of contamination as districts were the unit of randomisation. |
| Recruitment to cluster | Unclear risk | District selected which 2 middle or junior high schools participated. |
| Baseline imbalance | Low risk | Districts randomised to condition. |
| Loss of cluster | Low risk | Small loss of clusters (1 experimental, 1 control) and equal dropout across conditions. |
| Incorrect analysis | High risk | No adjustment for clustering reported in analysis. |
| Compatibility with individually randomised RCTs | Unclear risk | Unable to determine if a herd effect existed. |
| Overall risk of bias assessment | Unclear risk | Most domains were at unclear risk of bias. |
Mobley 2012.
| Study characteristics | ||
| Methods |
Trial name: HEALTHY Study design: cluster‐RCT for implementation outcome Intervention duration: about 3.5 years (autumn 2006 to spring 2009) Length of follow‐up from baseline: about 3.5 years Differences in baseline characteristics: stated as similar but not shown Unit of allocation: schools Unit of analysis: schools |
|
| Participants |
School type: middle schools Region: 10 school districts located at 7 sites across the US Demographic/socioeconomic characteristics: schools were serving largely minority and lower income populations Inclusion criteria ‐ Student body was representative of the adolescent population at risk for type 2 diabetes, defined as either ≥ 50% minority (African American, Hispanic/Latino, American Indian, or a combination) or > 50% eligible for free or reduced lunch, or both. ‐ Annual student attrition from all causes ≤ 25%. ‐ Expected cohort size at end of study was ≥ 50 per school. ‐ School authorities were willing to accept randomisation of an individual school to intervention or control. If a school was assigned to the intervention programme, this meant that the school must have arranged tasks/requirements needed to comply with the trial protocol. ‐ School permitted to perform grade‐wide collection of height, weight, gender, age and race/ethnicity at baseline. ‐ The school assisted with mass mailings of study materials to students' homes. ‐ The school district possessed or obtained Federal Wide Assurance to conduct research. ‐ Appropriate school authorities agreed to adhere to the protocol. Number of schools allocated: 42 (21 intervention, 21 control) Numbers by trial group n (controls baseline) = 21 n (controls follow‐up) = 21 n (interventions baseline) = 21 n (interventions follow‐up) = 21 Recruitment ‐ Each site recruited 6 middle schools that were randomised into intervention or control. ‐ Students provided parental informed consent. Recruitment rate: not reported |
|
| Interventions |
Number of experimental conditions: 2 (1 intervention, 1 control) Policies, practices or programmes targeted by the intervention The following nutritional goals were set for the NSLP, SBP and à la carte school food services ‐ Lower the mean fat content of food served in schools. ‐ Serve ≥ 2 servings of fruit or vegetables (or both) per student on NSLP and ≥ 1 serving per student on SBP each day. ‐ Serve all dessert and snack foods with ≤ 200 kcal per single size serving or package, or both. ‐ Eliminate milk > 1% fat, all other added sugar beverages, and 100% fruit juice (100% fruit juice may only be served as ≤ 6 ounces as part of SBP). ‐ Serve ≥ 2 servings of high fibre (≥ 2 g of fibre per serving) grain‐based foods or legumes (or both) per student on NSLP and ≥ 1 serving per student on SBP each day. Implementation strategies EPOC: educational meetings ‐ Provision of staff training (Food Services Manager and staff). ‐ Educational events held during lunchtime in and around the cafeteria. EPOC: educational games ‐ Conducted 'taste tests' of new products and unfamiliar foods, including conducting comparison of available items. EPOC: external funding ‐ Intervention schools received USD3000 per year to defray expenses and potential loss of income and received USD125 for cafeteria enhancements, and to attend training. EPOC: tailored intervention ‐ Research staff worked with food service managers to identify barriers and develop solutions for schools to achieve selected goals. EPOC: educational materials ‐ Curricula, posters, brief messages displayed near serving lines. EPOC: educational outreach ‐ Research staff met weekly with food service managers to observe the food environment and to plan and support goal achievement. EPOC: the use of information and communication technology ‐ Engagement with social marketing experts to generate content and offer guidance on the school social marketing efforts. EPOC: other ‐ Intervention launch and finale; these events were designed to promote global awareness for the programme at participating schools. Family outreach including delivery of newsletters and materials. ‐ Meetings with district level staff and buyers who procure food and with food distributors, to solicit support for change. Theoretical underpinning: social‐ecological models Description of control: control school followed existing school district standards and guidelines. |
|
| Outcomes |
Outcome relating to the implementation of school policies, practices or programmes 12 scores across the following variables: ‐ Lower than average fat content ‐ Serve 2 servings of fruit and vegetables ‐ Serve all desert and snack foods with < 200 kcal ‐ Eliminate milk > 1% fat ‐ Serve ≥ 2 servings of high fibre Data collection method ‐ Data collected by trained staff not involved in the intervention. ‐ Nutrition data were extracted from food service management source documents maintained by school food service personnel. ‐ Mean food group servings and nutrient amounts served per day were calculated by the trained programme staff using the food service staff records. Validity of measures used: not reported; however, the measures used were objective. Outcome relating to cost: yes Data collection method: by income statements, federal meal records and sales data Validity of measures used: not reported Outcome relating to adverse consequences: adverse impact on scholastic performance. Data collection method: state accountability tests and the total number and passing rates of students taking the test. Grade and school level data were recorded – no individual student data were collected. Validity of measures used: not reported Outcome relating to child diet, PA or weight status: assessed self‐reported dietary intake (energy, macronutrient and grams consumed of selected food groups). Height, waist circumference and BMI. Data collection method Dietary intake: Block Kids Questionnaire Anthropometry: height (Perspective Enterprises PE‐AIM‐101 stadiometer) and weight (SECA Alpha 882 and SECA Large Capacity 634 electronic scales) were measured without shoes. Waist circumference was taken using a tape measure on bare skin measured just above the iliac crest. Validity of measures used Dietary intake:not reported Anthropometry: valid |
|
| Notes |
Notes: this trial also contained a PA component as part of their policy, practice or programmes implemented; however, the trial was downgraded to a nutrition trial only as it did not report implementation outcomes for PA. Research funding: National Institute of Diabetes and Digestive and Kidney Diseases and the National Institute of Health grant numbers U01‐DK61230, U01‐DK61249, U01‐DK61231, and U01‐DK61223 to the STOPP‐T2D collaborative group. Conflicts of interest: 1 author received consulting fees from McDonald's Global Advisory Committee and another received consulting fees from General Mills and ConAgra Foods. The remaining authors declared no conflict of interest. |
|
| Risk of bias | ||
| Bias | Authors' judgement | Support for judgement |
| Random sequence generation (selection bias) | Unclear risk | Schools were randomly allocated to experimental group. Random sequence generation procedure was not described. |
| Allocation concealment (selection bias) | Unclear risk | No information provided about allocation concealment and, therefore, it was unclear if allocation was concealed. |
| Blinding of participants and personnel (performance bias) Implementation outcome | High risk | Outcome group: all Given the nature of the intervention, participants and study personnel were likely to have been aware of study allocation and, therefore, high risk of performance bias. Outcome: child BMI, adverse effects Low: objectively measured. |
| Blinding of outcome assessment (detection bias) Implementation outcome | Low risk | Outcome group: à la carte, nutrition goals, food group servings, adverse effects. Data were collected at baseline and end of study by trained study staff not involved in implementing the intervention. |
| Incomplete outcome data (attrition bias) Implementation outcome | Low risk | Outcome group: all outcomes All 42 schools were retained; therefore, risk of attrition bias was low. Loss to follow‐up among students similar (about 28%) for intervention and control groups at 2 years. No mention of ITT analysis in manuscripts. |
| Selective reporting (reporting bias) | Low risk | Protocol was available and outcomes reported were consistent. |
| Other bias | Low risk | Appeared free from other bias. |
| Overall risk of bias assessment | Low risk | Most domains were at low risk of bias. |
Nathan 2012.
| Study characteristics | ||
| Methods |
Trial name: Good for Kids. Good for Life Study design: non‐randomised Intervention duration: 11–15 months (duration of treatment) Length of follow‐up from baseline: baseline; November 2006 to April 2007, follow‐up: October 2008 to March 2009 Differences in baseline characteristics: no significant difference in the prevalence of vegetable and fruit breaks between intervention and comparison schools. Relative to comparison schools, intervention schools were more likely to be small, and located in rural and lower socioeconomic areas. Unit of allocation: schools Unit of analysis: schools |
|
| Participants |
School type: K‐6 and K‐12 central schools Region: HNE, NSW, Australia Demographic/socioeconomic characteristics: region: a demographically and socioeconomically diverse population of approximately 121,000 children aged 5–14 years (14% of the state population of 5–14 year olds). Sample: schools were primarily government, urban and lower SES schools. Inclusion/exclusion criteria Inclusion ‐ All primary schools (children 5–12 years of age) and central schools (children 5–18 years of age) across the state were eligible for participation. Exclusion ‐ Special purpose schools catering for students with special needs ‐ Juvenile justice schools ‐ Schools serving children who are hospitalised Number of schools allocated: 828 (422 intervention, 406 control) Numbers by trial group n (controls baseline) = 316 n (controls follow‐up) = 258 n (interventions baseline) = 407 n (interventions follow‐up) = 388 Recruitment: principals of both groups of schools were sent a letter inviting them to participate in the study. 2 weeks after receipt of the letter, principals were telephoned by a trained research assistant who confirmed school eligibility, sought consent to participate and scheduled a time for a telephone interview. Recruitment rate: 96.4% of intervention schools and 77.8% of control schools consented to participate in the baseline data collection. |
|
| Interventions |
Number of experimental conditions: 2 (1 intervention, 1 control) Policies, practices or programmes targeted by the intervention ‐ Prevalence of vegetable and fruit breaks Implementation strategies EPOC: local consensus processes ‐ Consensus processes EPOC: local opinion leaders ‐ Leadership support and endorsement EPOC: educational meetings ‐ Staff training and professional development EPOC: educational materials ‐ Programme materials (curriculum resource and materials, information to parents) EPOC:other ‐ Incentives (material goods) EPOC: tailored interventions ‐ Follow‐up support EPOC: monitoring the performance of the delivery of the health care ‐ Implementation feedback (performance monitoring and feedback) Theoretical underpinning A structured multi‐strategy intervention was developed based on theoretical frameworks of practice change and recommendations from reviews and implementation studies conducted in schools and other settings. Description of control: comparison schools were not offered the multi‐strategy intervention described above, but were offered access to information‐based support provided by a non‐government organisation. Information regarding the programme was provided to schools via a website, newsletters and events. If a school chose to register for the programme, teaching resource materials were forwarded to the school, with schools able to receive e‐mail and telephone information‐based support if desired. If the school provided evidence of having adopted the programme, they were eligible to be 'certified' as such and to receive additional resource materials and obtain access to ongoing e‐mail and telephone support. In some areas of the state, schools could access additional support provided at the discretion of local health promotion teams (EPOC: educational material). |
|
| Outcomes |
Outcome relating to the implementation of childcare service policies, practices or programmes ‐ Prevalence of fruit and vegetable breaks Data collection method: principal reported computer‐assisted telephone interviewing Validity of measures used: self‐report; however, method has been validated. The accuracy of principal‐reported implementation of vegetable and fruit breaks in schools was assessed in a convenience sample of intervention schools (42 schools; 10%). Based on observations made in these schools over a 9‐week period, pre‐service teachers located in schools reported in a pen–paper survey if classes at the school had specific breaks or if students had permission to eat vegetables or fruit (or both) during class time ('yes all classes', 'yes some classes', 'no classes', 'don't know'). The pre‐service teacher surveys were completed within 1 month of the principal telephone survey. Comparison of principal and pre‐service teacher report of vegetable and fruit breaks revealed perfect agreement (Kappa = 1.0). Outcome relating to cost: not reported Outcome relating to adverse consequences: not reported Outcome relating to child diet, PA or weight status: not reported |
|
| Notes |
Research funding: New South Wales Health ASSIST programme. The project also received infrastructure support from the Hunter Medical Research Institute (HMRI) and Hunter New England Population Health. Conflicts of interest: authors reported no conflicts of interest. |
|
| Risk of bias | ||
| Bias | Authors' judgement | Support for judgement |
| Random sequence generation (selection bias) | High risk | Non‐randomised trial. High risk of selection bias as intervention services were recruited from a selected area and control services from a comparison region. |
| Allocation concealment (selection bias) | High risk | Non‐randomised trial. Intervention services were recruited from a selected area, therefore, high risk of selection bias as no concealment of allocation. |
| Blinding of participants and personnel (performance bias) Implementation outcome | High risk | Outcome group: all due to nature of the intervention, school staff and study personnel delivering the intervention were not blind to study allocation. |
| Blinding of outcome assessment (detection bias) Implementation outcome | High risk | Outcome group: prevalence of vegetable and fruit breaks. No blinding of outcome assessment and the outcome measurement is likely to be influenced by lack of blinding, self‐report considered high risk. |
| Incomplete outcome data (attrition bias) Implementation outcome | Low risk | Outcome group: although differential response rate for intervention vs comparison schools at baseline and follow‐up (96.4% vs 77.8% and 95.3% and 81.6%, respectively) appropriate analyses to address this were conducted. All schools lost to follow‐up were included in the generalised estimating equation model (using last value carried forward method). |
| Selective reporting (reporting bias) | Unclear risk | No study protocol, therefore, it was unclear if there was selective outcome reporting. |
| Other bias | Low risk | Appeared free from other bias. |
| Potential confounding | High risk | Baseline differences in intervention and control schools not adjusted for in analysis. Relative to comparison schools, intervention schools were more likely to be small, and located in rural and lower socioeconomic areas. |
| Overall risk of bias assessment | High risk | Most domains were at high risk of bias. |
Nathan 2016.
| Study characteristics | ||
| Methods |
Trial name: no trial name Study design: group, i.e. cluster‐RCT for implementation outcome Intervention duration: 9 months Length of follow‐up from baseline: outcome data were collected at baseline (May–July 2014) and follow‐up (May–July 2015) Differences in baseline characteristics: there were no significant differences between groups in school characteristics or menu composition at baseline. Unit of allocation: schools Unit of analysis: schools |
|
| Participants |
School type: primary schools Region: government and Catholic schools located in the HNE Local Health District in NSW, Australia Demographic/socioeconomic characteristics: the HNE region covers a large non‐metropolitan area (> 130,000 km2); with a demographically and socioeconomically diverse population of children aged 5–12 years. Inclusion/exclusion criteria Inclusion ‐ Located within HNE region Australia ‐ Primary schools Exclusion ‐ Independent schools ‐ Having secondary students (including central schools, i.e. enrolling students from kindergarten to grade 12) ‐ Those exclusively catering for children requiring specialist care ‐ Not having a canteen that operated at least once per week ‐ Schools participating in another canteen intervention study ‐ Schools identified by the NSW government as a high‐performing health‐promoting school in terms of implementing nutrition (including canteens) and PA policies and practices Number of schools allocated: 53 Numbers by trial group n (controls baseline) = 25 n (controls follow‐up) = 24 n (interventions baseline) = 28 n (interventions follow‐up) = 27 Recruitment: 68 schools were randomised prior to baseline data collection and approached to participate in the study of which 61 schools agreed. Recruitment rate: 89.7%; however, some schools were later found to be ineligible. |
|
| Interventions |
Number of experimental conditions: 2 (1 intervention, 1 control) Policies, practices or programmes targeted by the intervention The NSW state government had introduced a healthy school canteen policy ("Fresh Tastes @ School"). Utilising a 'traffic light' food classification system, the policy classifies foods and beverages sold in school canteens (whether that be prepackaged foods or those made on site by canteen staff) as either 'red', 'amber' or 'green' based on their nutritional content. For all foods sold in the canteen at recess and lunch the policy requires schools to remove all red foods from regular sale and to fill the menu (i.e. > 50%) with green foods and to not let amber foods dominate the menu. This study was designed assess the effectiveness of a multistrategy implementation intervention in increasing the implementation of the healthy canteen policy in Australian primary schools. Implementation strategies EPOC: audit and feedback ‐ Performance monitoring and feedback. During the workshop, schools were provided with a written feedback report on their previously supplied canteen menu. The feedback report identified the included foods and beverages that were red/banned, amber or green and the proportion of the menu contributed by each category. Red/banned food items in the report were advised to be removed, with alternatives, where possible, identified. Where amber foods dominated the menu (> 50%), green alternative food items were recommended. The feedback report included a sample 'compliant' menu, individually tailored using the schools baseline menu. EPOC: continuous quality improvement ‐ Canteen managers were asked to send an updated version of the menu for review and a second feedback report was generated EPOC: education materials ‐ Tools and resources canteen managers were provided with a 'Canteen Resource Kit' containing various printed and electronic instructional materials, including electronic menu and pricing templates, and a poster‐sized checklist that prompted canteen managers to regularly review their canteen practices relating to Fresh Tastes @ School. EPOC: education meeting ‐ Canteen manager/parent training – a 1‐day (5‐hour) group‐training workshop was offered to canteen managers and parent representatives providing education and skill development in the Fresh Tastes @ School policy, label reading, canteen stock and financial management, pricing and promotion, and change management. Dietitians, experienced in delivering training to canteen managers, conducted the training. If a school canteen manager was unable to attend the workshop, they were telephoned and offered a 30‐ to 45‐minute teleconference call or a face‐to‐face meeting with a dietitian to discuss workshop content and resources. EPOC: local consensus process ‐ The workshop provided opportunities for canteen managers to participate in consensus processes through the development of a canteen action plan identifying how they would implement Fresh Tastes @ School in their school. EPOC: local opinion leader ‐ Executive support – school principals were telephoned to inform them of the training and resources available to their school canteen and asked to demonstrate their support for implementation of the Fresh Tastes @ School policy by encouraging the canteen manager and a parent representative to attend canteen manager training and for receipt of ongoing support. EPOC: tailored intervention ‐ The feedback report included a sample 'compliant' menu, individually tailored using the schools. EPOC: other ‐ Following training, canteen managers received 2 support contacts per school term via text messages. Framed by the Theoretical Domains Framework these contacts provided targeted advice to overcome common barriers to policy implementation and encouraged canteen managers to review progress against their action plan. Canteen managers who requested additional support were contacted by a project officer after the workshop and provided tailored advice. ‐ Recognition: schools with a menu assessed as adhering to the policy (i.e. > 50% green items and no red or banned items) received a congratulatory letter from the research team, and provided a positive feedback article they could include in their school newsletter. ‐ Canteen managers who attended the workshop also received kitchen equipment to the value of AUD100. Theoretical underpinning: Theoretical Domains Framework Description of control: comparison schools were not offered the multi‐strategy intervention described above. |
|
| Outcomes |
Outcome relating to the implementation of school service policies, practices or programmes ‐ The proportion of schools with a canteen menu that did not include red or banned foods and beverages. ‐ The proportion of schools where green items made up most of the menu defined as > 50% of listed menu items. Data collection method: audits of canteen menus faxed or emailed to the project team by the school. Validity of method: objective and reported as valid. Authors reported the method had previously been validated with a cross‐sectional study in 38 schools that compared menu analysis using assumptions to an observational audit (the criterion standard). Outcome relating to cost: not reported Outcome relating to adverse consequences: not reported Outcome relating to child diet, PA or weight status: not reported |
|
| Notes |
Research funding: New South Wales Healthy Children's Initiative. The project also received infrastructure support from the Hunter Medical Research Institute (HMRI) and Hunter New England Population Health. Conflicts of interest: authors reported no conflicts of interest. |
|
| Risk of bias | ||
| Bias | Authors' judgement | Support for judgement |
| Random sequence generation (selection bias) | Low risk | RCT. Random sequence generated using a computerised random number function in Microsoft Excel. |
| Allocation concealment (selection bias) | Unclear risk | Group allocation was concealed from staff involved in school recruitment; however, there was no information about how allocation was concealed. |
| Blinding of participants and personnel (performance bias) Implementation outcome | High risk | Outcome group: schools were not blinded to group allocation and, therefore, were at high risk of performance bias. Cost data: collected retrospectively: low. |
| Blinding of outcome assessment (detection bias) Implementation outcome | Low risk | Outcome group: dietitians conducting menu assessments were blinded to group allocation. Cost data: unclear if data collector knew group allocation. |
| Incomplete outcome data (attrition bias) Implementation outcome | Low risk | Outcome group: only 1 school was lost to follow‐up. Cost data: no loss to follow‐up. |
| Selective reporting (reporting bias) | Low risk | Trial was prospectively registered with the Australian New Zealand Clinical Trials Registry (ACTRN12614001148662). All predetermined outcomes were reported. Cost data: retrospective economic analysis: unclear. |
| Other bias | Low risk | Appeared free from other bias. |
| Overall risk of bias assessment | Low risk | Most domains were at low risk of bias. |
Nathan 2020.
| Study characteristics | ||
| Methods |
Trial name: Pilot of the Physically Active Children in Education (PACE) Study design: 2 × 2 factorial cluster‐RCT Intervention duration: 9 months (January 2017 to September 2017) Length of follow‐up from baseline: students' baseline data were collected between February and March 2017. Follow‐up data collection occurred approximately 9 months postbaseline (October–November 2017). Teacher surveys were conducted at follow‐up only. Differences in baseline characteristics: as shown in Table 2, there were large differences in the proportion of rural vs urban schools intervention vs comparison Unit of allocation: school Unit of analysis Implementation outcomes: cluster (school) Behavioural/health outcomes: individual (student) |
|
| Participants |
School type: 12 Catholic elementary schools Region: Hunter region of NSW Australia Demographics/socioeconomic characteristics: almost 2% of intervention schools were rural, compared to 46% of comparison schools Inclusion/exclusion criteria Inclusion ‐Catholic schools from the study region Exclusion ‐ Schools participating in another PA intervention ‐ Catered for both elementary and secondary students ‐ Exclusively for children requiring specialist care ‐ Did not use the school communications application ("Skoolbag"), as this was required for the lunchbox treatment group. Number of schools allocated Schools ‐ PA group = 6 ‐ No PA support (groups 2 and 4) = 6 Students ‐ PA group = 1323 ‐ No PA support (groups 2 and 4) = 825 Numbers by trial group n (controls baseline) = 1323 n (controls follow‐up) = 940 n (interventions baseline) = 825 n (interventions follow‐up) = 562 Recruitment Schools:Catholic schools from the study region were stratified by school size (small or large) and placed in a random order and invited to participate. School principals provided written informed consent. Recruitment continued until 12 schools consented to participate. Students:all students (ages 5–12 years) attending participating schools were invited to participate in the data collection component of the trial, which required active parent and child consent. Recruitment rate Schools:60% Students:56.9% |
|
| Interventions |
Number of experimental conditions: 4: 1. PA support only, 2. lunchbox support only, 3. both PA and lunchbox support, 4. waitlist comparison. Outcome data comparing the PA outcomes of students from schools that received the PA support (groups 1 and 3) to those who did not (groups 2 and 4). Policies, practices or programmes targeted by the intervention PA policy: the NSW Department of Education Sport and Physical Activity Policy, required teachers to implement ≥ 150 minutes (up from 120 minutes) of planned moderate, with some vigorous, PA across the school week for students in kindergarten to grade 10. Schools were also required to develop a local school policy that stated their commitment to the ongoing implementation of the 150‐minute policy. Implementation strategies EPOC: educational materials ‐ In‐school champions received an "intervention manual" and classroom teachers received various printed and electronic instructional materials. EPOC: educational outreach visits or academic detailing ‐ Conduct educational outreach visits. EPOC: local opinion leaders ‐ Nominated ≥ 2 in‐school champions. EPOC: tailored interventions ‐ Support officers provided in‐school champions with support remotely, i.e. via telephone or e‐mail twice per term to support implementing the intervention. ‐ Centralised technical support. EPOC: other ‐ Mandate change. ‐ Schools were offered teacher relief funding to cover in‐school champions’ attendance at the workshop. Theoretical underpinning ‐ Of the evidence‐based intervention/policy/practice or programme: none ‐ Of the implementation strategy: Theoretical Domains Framework Description of control: waitlist comparison and lunchbox support. Comparison schools were asked to continue their usual PA practices. However, during the trial period, teachers from either intervention or comparison group schools were able to access NSW government‐run programmes directed at supporting school promotion of healthy eating and PA, generally. |
|
| Outcomes |
Outcome relating to the implementation of school policies, practices or programmes Teacher implementation of PA policy across a school week. Data collection method: teacher logbooks were reviewed to determine the mean minute's teachers implemented PA. The daily minutes of PA implemented were then summed for each teacher to obtain the total number of minutes of PA that were delivered across that school week. Validity of measures used: the use of teacher logbooks is frequently used in classroom‐based obesity prevention interventions, with high response rates (i.e. > 80%) and established reliability and validity. Outcome relating to cost: – Outcome relating to adverse consequences: – Outcome relating to child diet, PA or weight status ‐ Student daily activity counts per minute. ‐ Student mean daily MVPA and sedentary behaviour Data collection method: accelerometer data was collected Monday to Friday for the whole school day (i.e. 9 A.M. to 3 P.M.).
Validity of measures used: – |
|
| Notes |
Research funding: Hunter Medical Research Institute (HMRI), Hunter Children's Research Foundation (HCRF), and Hunter New England Population Health. The authors thank the participants for their involvement in this study. N.K.N. is supported by an NHMRC TRIP Fellowship (APP1132450) and a Hunter New England Clinical Research Fellowship; L.W. is supported by an NHMRC Career Development Fellowship (APP1128348), Heart Foundation Future Leader Fellowship (101175), and a Hunter New England Clinical Research Fellowship; R.L.S. is supported by an NHMRC TRIP Fellowship (APP1150661). None of the funding bodies had a role in the design, data collection, analysis, interpretation of data, and dissemination of findings. All authors declare that they have no financial disclosures. Conflicts of interest: all authors declared that they had no financial disclosures. |
|
| Risk of bias | ||
| Bias | Authors' judgement | Support for judgement |
| Random sequence generation (selection bias) | Low risk | Schools were randomly allocated in a 1:1:1:1 ratio to 1 of the 4 arms by an independent investigator using a computerised random number generator. |
| Allocation concealment (selection bias) | Low risk | Random allocation using independent investigator so unlikely to foresee allocation. |
| Blinding of participants and personnel (performance bias) Implementation outcome | High risk | Outcome group: implementation. The nature of the trial precluded blinding. Outcome: child PA accelerometer data. Low: objective measure. |
| Blinding of outcome assessment (detection bias) Implementation outcome | High risk | Teacher log‐book used to assess implementation outcome. Outcome: child PA accelerometer data. Low: objective measure. |
| Incomplete outcome data (attrition bias) Implementation outcome | Unclear risk | Outcome group: teacher self‐reported implementation. Conducted follow‐ups with teachers only. Did not report if some teacher's logbooks were unavailable or not. Outcome: child PA Unclear: there were some missing from analysis due to invalid wear time, and some students did not wear accelerometer at both time points. |
| Selective reporting (reporting bias) | High risk | The outcome assessing the mean minutes teachers implemented PA was not prospectively registered a priori in ANZCTR registry. Child PA: low: prospectively registered. |
| Other bias | Unclear risk | Unclear if at risk of contamination. Appeared free of other biases. |
| Recruitment to cluster | Unclear risk | Unclear at what time point students were recruited (before or after randomisation of schools). |
| Baseline imbalance | Low risk | There was imbalance between student baseline socioeconomic location and remoteness classification between the experimental groups. These variables were also controlled for by including them as fixed effects in all PA outcome models. |
| Loss of cluster | Low risk | No loss of clusters. |
| Incorrect analysis | Low risk | Clustering was taken into account. Analyses of study outcomes were performed under an ITT framework, with participants (students and teachers) analysed according to the group their school was randomised into. 2 random intercepts were included in the model to account for the clustered design of the trial, and to account for the repeated measurements taken on children. |
| Compatibility with individually randomised RCTs | Unclear risk | No statement regarding this. |
| Overall risk of bias assessment | Unclear risk | Most domains were at unclear risk of bias. |
Naylor 2006.
| Study characteristics | ||
| Methods |
Trial name: Action Schools! British Columbia (BC) Study design: cluster‐RCT Intervention duration: 11 months Length of follow‐up from baseline: 16 months Differences in baseline characteristics: not reported Unit of allocation: schools Unit of analysis: teachers/classes |
|
| Participants |
Region: British Columbia, Canada Demographic/socioeconomic characteristics: a broad socioeconomic and cultural spectrum. Inclusion criteria ‐ Elementary schools from 2 British Colombia school districts that were ranked 'low' in terms of current implementation of PA initiatives. Number of schools allocated: 10 randomised, stratified by size (< 300 or > 300 students) and geographic location to: 3 intervention (Champion schools), 4 intervention (Liaison schools), 3 controls (usual practice schools). Numbers by trial group n (controls baseline) = 3 services n (controls follow‐up) = 3 services n (interventions baseline) = 7 services (4 Liaison schools, 3 Champion schools) n (interventions follow‐up) = 7 services (4 Liaison schools, 3 Champion schools) Teachers:42 grade 3 and 4 teachers. 50 grade 5 and 6 teachers Students: not reported Recruitment School districts: elementary schools from 2 BC school districts. Schools: gave presentations at district principals' meetings and from a pool of 103 schools, 20 schools (19%) volunteered to participate. To discriminate between schools who were already undertaking PA initiatives from those who were not, they used results from the 2002 BC Ministry of Education Satisfaction Survey which assessed parent and student satisfaction with current school PA on a 5‐point Likert scale (5 = very satisfied). From the pool of 20 volunteer schools, schools (n = 11) with satisfaction score that ranked ≤ 3 were invited to participate. 1 principal withdrew his school (before randomisation) after determining there was a chance their school could be randomly selected as a control school. Students/teacher: grades 4–6 were included. 42 (100%) grade 4 and 5 teachers consented to participate in phase I and 49 (98%) grade 5 and 6 teachers consented to participate in phase II (23 taught grade 5 in both phases). They also recruited children in these grades to participate in an evaluation of multiple health outcomes. Recruitment rate School districts: – Schools: 19% of schools approached consented, 11/20 (55%) were eligible, 10/11 consented. Classrooms: 42 (100%) grade 4 and 5 teachers consented to participate in phase I and 49 (98%) grade 5 and 6 teachers consented to participate in phase II. Students:not reported |
|
| Interventions |
Number of experimental conditions: 3 (2 intervention: Liaison schools and Champion schools, 1 control: usual practice schools) Policies, practices or programmes targeted by the intervention The AS! BC model provided tools for schools and teachers to create individualised Action Plans that increased PA opportunities across Six Action Zones: School Environment, Scheduled PE, Classroom Action, Family and Community, Extracurricular and School Spirit Implementation strategies EPOC: tailored interventions ‐ The AS! BC model provided tools for schools and teachers to create individualised Action Plans that increased PA opportunities across 6 action zones: School Environment, Scheduled PE, Classroom Action, Family and Community, Extracurricular and School Spirit. EPOC: educational meetings ‐ Teachers received teacher‐on‐call support to attend a Classroom Action training session (half‐day) from the AS! BC Support Team and School Facilitators and had access to further training on professional development days and by telephone consultation (on request). ‐ The AS! BC model provided generalist teachers with training and resources to operationalise their Action Plan with the ultimate goal of providing students with 150 minutes of moderate‐intensity PA per week. ‐ In the Champion school condition the School Facilitator for Champion schools provided the initial training to the designated 'champion' teacher (a teacher willing to activate and support their colleagues). EPOC: educational materials ‐ Each teacher received a Planning Guide and a copy of the Action Pages – The AS! BC model provided generalist teachers with training and resources to operationalise their Action Plan with the ultimate goal of providing students with 150 minutes of moderate‐intensity PA per week. EPOC: other ‐ Teachers received an Action Bin which remained in each teacher's classroom and contained equipment and resources to facilitate Classroom Action activities. Resources were gender inclusive and designed for children at all skill levels. ‐ Classroom Action Bins were enhanced with specific resources as requested. ‐ In the Champion school condition, Classroom Action Bins contained a basic set of resources. EPOC: local consensus process ‐ A school action team – a committee of school stakeholders (e.g. interested intermediate‐grade teachers, administrators, parents, health, sport/recreation practitioners) that created and supported implementation of the Action Plan EPOC: educational outreach meetings ‐ In the Liaison school condition, teachers had weekly contact with the School Facilitator who went to the classroom to provide mentorship and demonstrate activities. ‐ In the Champion schools condition, the School Facilitator for Champion schools provided support to the designated 'champion' teacher (a teacher willing to activate and support their colleagues). Support was not provided to each classroom in the Champion schools group Theoretical underpinning: socio‐ecological Description of control: usual practice schools were control. Teachers were asked to carry‐on with their typical delivery of PA and PE. |
|
| Outcomes |
Outcome relating to the implementation of school policies, practices or programmes ‐ Minutes per week of PA Data collection method: teachers at intervention schools were asked to complete weekly activity logs during phases I and II. Teachers recorded daily, the type, frequency and duration (minutes) of PA implemented in the classroom, in PE or in the other Action Zones. Activity Logs were collected monthly by the School Facilitators. Teachers at usual practice schools completed a modified version of the Activity Log. Validity of measures used: not reported/self‐report methods Outcome relating to cost: not reported Outcome relating to adverse consequences: not reported Outcome relating to child diet, PA or weight status: PA of step count, fitness and PA score as well as anthropometry (BMI). Data collection method PA: all children wore a New Lifestyles Digiwalker SW‐200 pedometer and completed the PAQ‐C Fitness: 20‐m shuttle run. Anthropometry: standing height (without shoes) was measured to the nearest 1 mm (Seca stadiometer Model 242, Hanover, Maryland). Weight in light clothing was measured using an electronic scale (Seca Model 840, Hanover, Maryland) to the nearest 0.1 kg. BMI was determined as kg divided by height in metres squared. Validity of method PA: paper reports pedometers are a valid objective measure of PA. Validity of PAQ‐C is not reported. Fitness: objective Anthropometry: valid |
|
| Notes |
Research funding: British Columbia Ministry of Health, 2010 Legacies Now, BC Ministry of Tourism, Sport and the Arts and the Provincial Health Services Authority. Conflicts of interest: not reported |
|
| Risk of bias | ||
| Bias | Authors' judgement | Support for judgement |
| Random sequence generation (selection bias) | Unclear risk | Schools were stratified by size and geographic location and randomly assigned to a usual practice or intervention or Champion condition. Random sequence generation procedure not described. |
| Allocation concealment (selection bias) | Unclear risk | No information provided about allocation concealment and, therefore, it was unclear if allocation was concealed. |
| Blinding of participants and personnel (performance bias) Implementation outcome | High risk | Outcome group: implementation outcome Given the nature of the intervention, participants and study personnel were likely to have been aware of study allocation and, therefore, high risk of performance bias. Outcome: child BMI and PA Low: objectively assessed outcome Outcome: adverse effects Unclear: little information provided |
| Blinding of outcome assessment (detection bias) Implementation outcome | High risk | Outcome group: implementation outcome All self‐reported outcomes and no blinding of outcome assessment and the outcome measurement is likely to be influenced by lack of blinding. Outcome: BMI, child PA (objective measure) Low: blinding would not impact objective measure. Outcome: adverse effects Unclear: little information provided |
| Incomplete outcome data (attrition bias) Implementation outcome | Unclear risk | Outcome: PA delivered Insufficient information to determine missing data for teacher response rates and intervention fidelity. Outcome: BMI Low: loss to follow‐up < 10%, ITT not mentioned in analysis. |
| Selective reporting (reporting bias) | Low risk | Prespecified outcomes appear to be covered. |
| Other bias | Low risk | Did not appear to be at risk of contamination. |
| Recruitment to cluster | Low risk | Randomisation postrecruitment. |
| Baseline imbalance | Unclear risk | Baseline characteristics by group not reported. |
| Loss of cluster | Low risk | No loss of clusters. |
| Incorrect analysis | Low risk | Clustering has been taken into account. |
| Compatibility with individually randomised RCTs | Unclear risk | Unable to determine if a herd effect existed. |
| Overall risk of bias assessment | Low risk | Most domains were at low risk of bias. |
Perry 1997.
| Study characteristics | ||
| Methods |
Trial name: Child and Adolescent Trial for Cardiovascular Health (CATCH) Study design: cluster‐RCT Intervention duration: 3 years; 1991–1994 Length of follow‐up from baseline: follow‐up of the schools and students took place in the spring of 1992, 1993 and 1994. Differences in baseline characteristics Schools: among 96 schools measured at baseline, there were no significant differences between the study conditions for all relevant variables, insuring equivalency between groups. All 96 schools maintained their participation in their allocated treatment condition over the 3‐year study. Students: no significant differences by site, gender or ethnic group between those who did and did not participate. Unit of allocation: schools Unit of analysis: classrooms and schools |
|
| Participants |
School type: elementary schools Region: CATCH was implemented in 4 study centres: San Diego, California; New Orleans, Los Angeles; Minneapolis, Minnesota and Austin, Texas, USA Demographic/socioeconomic characteristics: students were from ethnically diverse backgrounds and from geographically diverse areas. Inclusion/exclusion criteria Inclusion of schools ‐ Distance from 1 of the 4 study centres ‐ Ethnic diversity ‐ Food service characteristics (potential for intervention) ‐ Commitment to offering ≥ 90 minutes of PE per week ‐ Commitment to participating in a 3‐year study ‐ Co‐operation with random assignment Inclusion of students ‐ In third grade at beginning of trial ‐ Parents and students agreed to provide a blood sample at baseline Number of schools allocated: 96 from 12 districts Numbers by trial group n (controls baseline) = 40 n (controls follow‐up) = 40 n (interventions baseline) = 56 n (interventions follow‐up) = 56 The intervention schools were further randomised into 2 equal subgroups n School‐based only (baseline) = 28 n School‐ and family‐based (baseline) = 28 n School‐based only (follow‐up) = 28 n School‐ and family‐based (follow‐up) = 28 Recruitment: school district superintendents received a letter describing the project and inviting their school district to participate in the study beginning in autumn 1991. While the recruitment process differed among sites, the next step usually involved a personal meeting between a school district representative (e.g. superintendent, curriculum specialist or other district level person) and the principal investigator and site intervention co‐ordinator. After the initial meeting, the necessary decision‐making procedures were followed for each school district indicating interest in participating in CATCH. School districts: of the 15 school districts initially contacted among the 4 sites, 12 chose to participate in the study. In Louisiana, 2/6 school districts declined due to teacher strikes. In Minnesota, 1 district declined due to competing district‐wide commitments. Schools: following recruitment of districts schools within districts were contacted. Students:not reported Recruitment rate School districts: 12/15 Schools:of the 162 schools contacted, 96 agreed to participate (59.3% recruitment rate). Student:total baseline 5106 (60.4%) |
|
| Interventions |
Number of experimental conditions: 3 (2 intervention: 1 control) The schools were randomised to either intervention (56 schools; 14 per field centre) or control status (40 schools; 10 per field centre). Randomisation occurred after all baseline measurements were completed. The intervention schools were further randomised into 2 equal subgroups: 1 group received a school‐based programme consisting of school food service modifications, PE and the CATCH curricula (28 schools; 7 per field centre); the other group received the same school‐based programme plus a family‐based programme (28 schools; 7 per field centre). Policies, practices or programmes targeted by the intervention School level 1. EATSMART ‐ To reduce the total fat content of food served to 30%. ‐ To reduce the total sodium content to 600–1000 mg per serving. ‐ Recommendations to lower the total cholesterol in foods offered. 2. CATCH PE ‐ Increase the amount of PE time that students spent in MVPA to 40% of class time. Implementation strategies EPOC: educational meetings ‐ Staff received training sessions to deliver EATSMART and CATCH PE. EPOC: educational outreach visits ‐ Staff received ongoing support visits to implement EATSMART/CATCH PE. EPOC: educational materials ‐ Educational materials were provided to staff/schools for EATSMART and CATCH PE. ‐ Smart choices manual was provided to all schools. EPOC: other ‐ Families were engaged by Family Fun Nights and home curricula Theoretical underpinning: Social Learning Theory and Organisational Change Description of control: the control group received their usual health curricula, PE and food service programmes, but none of the CATCH interventions. |
|
| Outcomes |
Outcome relating to the implementation of school service policies, practices or programmes ‐ Mean % of kilocalories from fat in lunches ‐ Mean milligrams of sodium in lunches ‐ Cholesterol milligrams in lunches (mean) ‐ Quality of PE lesson % of 7 activities observed Data collection method Nutrient content of school lunches: nutrient content of school lunches: 5 consecutive, non‐ randomly selected days of school menu, recipe and vendor product information were collected from each intervention and control school. School food service managers were instructed by trained and certified CATCH evaluation staff to keep a written record of lunch menus as well as the portions served each day. At the end of the 5‐day, CATCH evaluation, staff conducted in‐person interviews with the managers and cooks about the menus and recipes using standardised probes for ingredients and preparation methods. Nutrient and ingredient information for vendor products (i.e. foods purchased preprepared) were collected from the food companies. Data entry and nutrient calculations for school menu data at each interval were performed using the Minnesota Nutrition Data System (NDS) Version 2.2. Quality of PE lesson:direct observation Validity of measures used Nutrient content of school lunches: not reported (measures not objective) Quality of PE lesson: not reported; however, the measure used was objective. Outcome relating to cost: not reported Outcome relating to adverse consequences: growth and nutritional quality of the school meals Data collection method: measurements of height and nutrient intake as described in implementation outcomes were collected. Validity of measures used: not reported Outcome relating to child diet, PA or weight status: child diet, PA and anthropometry Data collection method Child diet: a 24‐Hour Dietary Recall measured total daily food and nutrient intake in a random subsample of 30 students per school at both baseline and follow‐up. A non‐quantified food record was completed by students on the previous day and was used as a prompt for the interviewer who conducted the 24‐hour recall. The data were directly entered into a laptop computer during the interview and the NCC database was used for evaluation. Self‐reported child PA: the Self‐Administered Physical Activity Checklist (SAPAC). Fitness: 9‐minute distance run. Fitness other: SOFIT Height, weight and triceps and subscapular skin‐folds: measured using the Stadiometer, a balance scale and Lange calipers. Skinfold thickness was measured 3 times at each site, with intraclass correlation coefficients exceeding 0.97. Height was measured to the nearest 0.1 cm, weight to the nearest 0.1 kg, and the skin‐folds to the nearest mm. BMI was defined as weight kg divided by height in metres squared. Validity of measures used Child diet: method had previously been shown to be reliable and valid. Self‐reported child PA: validated Fitness: objective Fitness other: objective Child PA: validated Anthropometry: objective |
|
| Notes |
Note: study targeted PA, nutrition and tobacco; however, implementation outcomes for tobacco were unavailable and as such, this was reported as a nutrition and PA only trial, with their corresponding implementation outcomes and strategies only reported. A variety of outcomes pertaining to programme implementation were reported across the published reports of the CATCH intervention. There was some inconsistency in the reported key implementation policies and practices targeted by the programme. Given this, implementation outcome data were extracted from the study published by Perry and colleagues as the objective of this paper was specifically to report on programme implementation and measures including intervention 'fidelity'. Research funding: National Heart, Lung and Blood Institute (U01HL 33927, UOI HL 39852, UOI HL 39870, UOI HL 33906, UOI HL 39880). Conflicts of interest: not reported |
|
| Risk of bias | ||
| Bias | Authors' judgement | Support for judgement |
| Random sequence generation (selection bias) | Unclear risk | Schools were randomly allocated to experimental group. Random sequence generation procedure not described. |
| Allocation concealment (selection bias) | Unclear risk | No information provided about allocation concealment and, therefore, it was unclear if allocation was concealed. |
| Blinding of participants and personnel (performance bias) Implementation outcome | High risk | Outcome group: no blinding to group allocation of participants or personnel described and this was likely to influence performance. Outcome: child BMI Low: objectively measured Outcome: nutritional quality (adverse effects) High: self‐reported data |
| Blinding of outcome assessment (detection bias) Implementation outcome | High risk | Outcome group: no mention that observers were blinded to group allocation and, therefore, the risk of detection bias was high. Outcome: BMI (objective measure) Low: blinding would not impact objective measure. Outcome: nutritional quality (adverse effects) High: self‐reported data |
| Incomplete outcome data (attrition bias) Implementation outcome | Low risk | Outcome group: all outcomes None of the schools dropped out or refused to participate in the intervention activities. Tracked down students who were loss to follow‐up and living within 100 miles to obtain measurements and enable measurement according to ITT principles. No mention of ITT analysis in manuscript. |
| Selective reporting (reporting bias) | Unclear risk | No study protocol, therefore, it was unclear if there was selective outcome reporting. |
| Other bias | Low risk | Did not appear to be at risk of contamination or other biases. |
| Recruitment to cluster | Low risk | Individuals within each randomised cluster participated. |
| Baseline imbalance | Low risk | Schools were randomly allocated to condition and so risk of baseline imbalance was low. |
| Loss of cluster | Low risk | None of the schools dropped out or refused to participate in the intervention activities. |
| Incorrect analysis | Low risk | The analysis appeared appropriate. |
| Compatibility with individually randomised RCTs | Unclear risk | Unable to determine if a herd effect existed. |
| Overall risk of bias assessment | Low risk | Most domains were at low risk of bias. |
Perry 2004.
| Study characteristics | ||
| Methods |
Trial name: Cafeteria Power Plus project Study design: cluster‐RCT Intervention duration: during 2 consecutive school years beginning in autumn 2000 Length of follow‐up from baseline: 2 years Differences in baseline characteristics: not reported Unit of allocation: schools Unit of analysis: canteen observations |
|
| Participants |
School type: elementary schools Region: twin cities in metropolitan area of Minnesota, USA Demographic/socioeconomic characteristics: 26 schools had an enrolment that was 90% white and 21% of the school meals served were free or reduced price. Inclusion/exclusion criteria: not reported Number of schools allocated: 26 Numbers by trial group n (controls baseline) = 13 n (controls follow‐up) = 13 n (interventions baseline) = 13 n (interventions follow‐up) = 13 Recruitment: not reported Recruitment rate Schools: not reported Children: 91.7%. Of the 1820 students who were eligible to be observed in spring 2000, 1668 were observed and became the baseline sample. Of the 1820 students, 41 had moved, 7 parents and 44 students refused participation, and 60 students were absent. |
|
| Interventions |
Number of experimental conditions: 2 (1 intervention, 1 control) Policies, practices or programmes targeted by the intervention ‐ Increasing the availability, appeal and encouragement of fruits and vegetables in the school lunch programme; emphasising changes in the lunch line; and, secondarily, the school snack cart. ‐ Increase the quality and quantity of fruits and vegetables served. ‐ Increase the choices of fruits and vegetables in the lunch line, to make them look more attractive (by putting them in small cups or arranging by colour), and to vary the type and preparation methods daily. ‐ Special events to promote fruits and vegetables. Implementation strategies EPOC: educational meetings ‐ Monthly meetings were held with the cook managers from each of the 13 intervention schools to discuss and share implementation issues and new ideas during the first school year. EPOC: educational outreach visits ‐ Intervention staff visited schools weekly, on average, and supported the activities for the kick‐off. EPOC: educational materials ‐ The "High 5 Flyers" that were hung in posters around the school cafeteria. EPOC: other ‐ Special events: sampling of fruit and vegetables, class challenges (to eat 3 serves of fruit and vegetables per day at lunch). EPOC: local consensus processes ‐ Monthly meetings were held with the cook managers from each of the 13 intervention schools to discuss and share implementation issues and new ideas during the first school year. Theoretical underpinning: Social Cognitive Theory Description of control: received training and materials at the end of the active study phase in autumn 2002. |
|
| Outcomes |
Outcome relating to the implementation of school service policies, practices or programmes ‐ Verbal encouragement by food staff (mean % of observations) ‐ Number of fruits and vegetables on the snack cart (mean) ‐ Number of fruits and vegetables students can choose (mean) ‐ Fruit and vegetables rated as appealing (mean %) Data collection method: process measures for the study, collected in both the intervention and control schools, included direct observations of the canteen, lunch line, food cart and food service staff behaviour. Validity of measures used: not reported; however, the measure was objective. Outcome relating to cost: not reported Outcome relating to adverse consequences: not reported Outcome relating to child diet, PA or weight status: fruit and vegetable intake. Data collection method: trained observers watched the selected students from a distance in the cafeteria and recorded all items eaten at lunch and their portion. Validity of measures used: reported to be valid. |
|
| Notes |
Research funding: grant from the National Cancer Institute (R01 CA59805). Conflicts of interest: not reported |
|
| Risk of bias | ||
| Bias | Authors' judgement | Support for judgement |
| Random sequence generation (selection bias) | Unclear risk | Schools were randomly allocated to experimental group. Random sequence generation procedure was not described. |
| Allocation concealment (selection bias) | Unclear risk | No information provided about allocation concealment and, therefore, it was unclear if allocation was concealed. |
| Blinding of participants and personnel (performance bias) Implementation outcome | High risk | Outcome group: observations: there was no blinding to group allocation of participants or personnel described and this was likely to influence performance. |
| Blinding of outcome assessment (detection bias) Implementation outcome | High risk | Outcome group: there was no mention that observers were blinded to group allocation and, therefore, the risk of detection bias was high. |
| Incomplete outcome data (attrition bias) Implementation outcome | Low risk | Outcome group: all 26 schools were retained in the study. |
| Selective reporting (reporting bias) | Unclear risk | No study protocol, therefore, it was unclear if there was selective outcome reporting. |
| Other bias | Unclear risk | Unclear if at risk of contamination. Did not appear at risk of other biases. |
| Recruitment to cluster | Low risk | Direct observations of school environment and food service staff. |
| Baseline imbalance | Low risk | There were no significant differences at baseline from the lunch observations for all the main outcome measures. |
| Loss of cluster | Low risk | All 26 schools were retained in the study. |
| Incorrect analysis | Unclear risk | Used mixed‐model regression procedures; however, it was unclear if adjusted for clustering. |
| Compatibility with individually randomised RCTs | Unclear risk | Unable to determine if a herd effect existed. |
| Overall risk of bias assessment | Unclear risk | Most domains were at unclear risk of bias. |
Sallis 1997.
| Study characteristics | ||
| Methods |
Trial name: Sports, Play, and Active Recreation for Kids (SPARK) Study design: non‐randomised Intervention duration: 2.5 years – reported in paper as 3 academic years (1990–1993) (intervention began in autumn 1990 and ended in spring 1992 for fourth grade teachers and started in autumn 1991 and ended in spring 1993 for fifth grade teachers. Follow‐up observations were at 8 months, and then again at 2 years. Length of follow‐up from baseline: baseline was during autumn at fourth grade, and then follow‐up was during spring at fifth grade. Maintenance effects also studied 1.5 years after the termination of the programme (i.e. 4‐year follow‐up from baseline total). Differences in baseline characteristics: not reported (however, matched by size and ethnic make‐up (% white)). There was a significant difference in age by condition (9.49 vs 9.62 years). Unit of allocation: schools Unit of analysis: classroom |
|
| Participants |
School type: elementary schools Region: Southern California, USA Demographic/socioeconomic characteristics: schools were situated in a middle‐class suburb of a large city containing 82% European American, 12% Asian/Pacific Islander, 4% Latino, 2% African American with 53% male. Inclusion/exclusion criteria: school level was not reported Student level inclusion ‐ Students were required to complete baseline and final survey and fitness test. Number of schools allocated: of the 7 schools, there were 4 interventions and 3 controls. The 4 intervention groups were further subdivided into 2 groups; 1 teacher arm and 1 specialist arm. The specialist arm was excluded in this review as the in‐school programme was delivered by certified PE specialist. Conversely, the other intervention arm was delivered by school teachers. Consequently, the study reported 5 schools as allocated. Students: 2 consecutive cohort of fourth graders, followed to fifth grade Numbers by trial group n (controls baseline) = 3 n (controls follow‐up) = 3 n (intervention (teachers‐led) baseline) = 2 n (interventions (teachers‐led) follow‐up) = 2 Recruitment Schools:schools agreed to participation in an experimental programme and be randomised to 1 of 3 study conditions. Schools were stratified by percentages of minority student and within those strata; 2 schools were randomly assigned to each condition (PE specialist, teacher‐led or control). The remaining school was added to the control condition. Teachers: not reported Students:2 consecutive cohorts of fourth‐grade students entered the study. All fourth‐grade students were invited to participate. Approximately 98% provided informed consent through a passive consent procedure. Recruitment rate: 12/16 principals consented (consent rate 75%). Resourcing constraints meant that only 7/12 schools were randomised. All fourth‐grade classes in the 7 schools participated. |
|
| Interventions |
Number of experimental conditions: 3 (2 intervention conditions (PE specialist condition, teacher‐led condition) 1 control condition). PE specialist: credentialed PE specialists were employed and trained by the investigators to ensure full implementation of the intervention. In the trained classroom teacher condition, teachers were trained in the intervention methods. Note: this review only reported the Teacher‐led and control conditions. Policies, practices or programmes targeted by the intervention SPARK PE was designed to be a comprehensive programme for upper elementary students to increase PA. It was deigned to influence the quantity and quality of elementary PE lessons and the amount of PE through: ‐ Number of lessons per week ‐ Minutes of PE per week Implementation strategies EPOC: educational materials ‐ Written curriculum guide identified the programme philosophy and goals and included a yearly plan which was divided into instruction units with activity progressions within each unit. A detailed plan was provided for each PE lesson, which typically had 2 parts: health‐fitness activities and skill‐fitness activities. EPOC: length of consultation ‐ An additional 30 minutes per week was allocated for classroom instruction and practices in self‐management activities and skills. EPOC: other ‐ To support implementation of the curricula, equivalent types of equipment were provided to all 7 schools, including control schools, and replacement equipment was added each year. Trained classroom teacher condition EPOC:educational meetings ‐ Classroom teachers were trained to implement SPARK PE. EPOC:educational outreach visits ‐ On‐site support which was provided during the 3 years ensured the curriculum was followed. A PE specialist provided feedback, encouragement and direct assistance during schools visits. The specialist assisted teachers by leading grade‐level planning meetings, modelling lesson segments, co‐ordinating space and equipment, and giving verbal and written feedback after observing lessons. Theoretical underpinning: not reported Description of control: usual PE was implemented by untrained classroom teachers (usual care). |
|
| Outcomes |
Outcome relating to the implementation of school policies, practices or programmes ‐ Duration (minutes) per week of PE lessons ‐ Frequency (per week) of PE lessons Data collection method: measured by direct observation by trained assessors for 1 full week twice a year in each school year. Validity of measures used: not reported; however, the measure was objective. Outcome relating to cost: not reported Outcome relating to adverse consequences: not reported Outcome relating to child diet, PA or weight status: PA (MVPA of students in classrooms and out of school PA as well as a fitness test) as well as height and weight. Data collection method MVPA of students in classrooms:SOFIT was used to obtain student activity levels. Codes were used to estimate energy expenditure associated with PA, which had been calibrated using heart rate monitoring and the system had been validated using Caltrac accelerometers. Out of school PA:accelerometer was the primary measure of PA for out of school. Fitness:1‐mile‐run test. Anthropometric measures:height and weight were measured in bare feet. Calf and triceps skinfolds were assessed 3 times using calibrated Lange calipers. Validity of measures used MVPA of students in classrooms: system validated using Caltrac accelerometers. Out of school PA: valid Fitness:objective Anthropometric measures:the interobserver agreement (intraclass correlations) was 0.87 for triceps skinfold and 0.93 for calf skinfold (n = 47). Anthropometry is a valid tool. |
|
| Notes |
Notes: the SPARK trial included postintervention implementation outcome data only; however, they used random assignment for 6/7 included schools, randomly allocating them to 1 of 3 conditions. The remaining school was allocated by the researchers to the control group. Despite the lack of baseline implementation data, given the use of random assignment, and similarity of other trial sample characteristics, the trial was retained in the review. Research funding: NIH grant HL44467 Conflicts of interest: not reported |
|
| Risk of bias | ||
| Bias | Authors' judgement | Support for judgement |
| Random sequence generation (selection bias) | High risk | Randomisation of all schools did not occur resulting in high risk of selection bias. Within each stratum, 1 school was randomly assigned to each of the 3 experimental conditions. To guard against loss of control schools, the remaining school was assigned to the control condition. |
| Allocation concealment (selection bias) | High risk | Randomisation of all schools did not occur and there was no indication that allocation was concealed and, therefore, were at high risk of selection bias. |
| Blinding of participants and personnel (performance bias) Implementation outcome | High risk | Outcome group: all. Given the nature of the intervention, participants and study personnel were likely to have been aware of study allocation and, therefore, high risk of performance bias. |
| Blinding of outcome assessment (detection bias) Implementation outcome | Unclear risk | Outcome group: observations of physical education classes. Implementation of the school physical education programme was assessed by direct observation by trained assessors not part of the intervention team. There was insufficient information about whether these assessors were blinded. |
| Incomplete outcome data (attrition bias) Implementation outcome | Unclear risk | Outcome group: observations of physical education classes. Insufficient reporting of attrition/exclusions to permit judgement of 'Low risk' or 'High risk' (e.g. no reasons for missing data provided). |
| Selective reporting (reporting bias) | Unclear risk | No study protocol, therefore, it was unclear if there was selective outcome reporting. |
| Other bias | Low risk | Appeared free from other bias. |
| Potential confounding | Unclear risk | There was insufficient information to determine the risk of potential confounders. |
| Overall risk of bias assessment | Unclear risk | Most domains were at unclear risk of bias. |
Saraf 2015.
| Study characteristics | ||
| Methods |
Trial name: no trial name Study design: cluster‐RCT Intervention duration: intervention started in April 2009 and continued until December 2009. Length of follow‐up from baseline: baseline data were collected from December 2008 to February 2009. The postintervention assessment was carried out in January and February 2010. Differences in baseline characteristics: there were no significant differences between the intervention and the control group in the student population at baseline. Unit of allocation: region Unit of analysis: school |
|
| Participants |
School type: middle schools Region: villages of Ballabgarh Block of Haryana state, India Recruitment: 40 schools were invited to participate. For the purpose of randomisation, all villages predominantly on the left side of Mohna Road (the main road passing through all the villages) were considered 1 group and those on the right side another group. 1 group was allocated as intervention, and the other as control based on draw of lots. Schools: at school level, verbal consent was taken from the school administrator. Students: at student level, written consent was taken from the parents by sending the consent form to the students before administering the questionnaire. Students present at the time of school visit with a written consent from parents were included and those absent on the day of visit were excluded from the study. There were 1026 students in the intervention and 1322 students in control group. Demographic/socioeconomic characteristics: mean age of the study population was 12.5 (SD 1.08) years in the intervention group and 12.3 (SD 1.11) years in the control group (P = 0.08). There were 47 % girls in the intervention group and 46 % girls in the control group (P = 0.6). Inclusion/exclusion criteria School level inclusion:no criteria reported. Students level inclusion:present at the time of school visit with a written consent from parents were included and those absent on the day of visit were excluded from the study. Number of schools allocated: 40 (19 intervention, 21 control) Numbers by trial group n (controls baseline) = 21 n (controls follow‐up) = 21 n (interventions baseline) = 19 n (interventions follow‐up) = 19 |
|
| Interventions |
Number of experimental conditions: 2 (1 intervention, 1 control) Policies, practices or programmes targeted by the intervention The intervention consisted of a school component (policies), a classroom component (activities) and a family component (Information Education & Communication (IEC) material). Implementation strategies EPOC: local consensus processes ‐ Initially a sensitisation meeting was conducted to sensitise the school administrators; a short film on non‐communicable diseases and their risk factors was shown in addition to baseline results. The meeting aimed to conclude with assured support from the school administrators and formation of school health committee. ‐ The intervention had 3 components: a school component, a classroom component and a family/community component. The school component aimed to create enabling environments in the schools by the following. EPOC: local opinion leaders ‐ Formation of school health committee. EPOC: tailored interventions ‐ Formulation of school action plan. EPOC: educational materials ‐ Improving school environment by display of posters and bulletin. EPOC: educational games ‐ Improving school environment by conducting quiz competitions, sports competitions and cultural activities based on non‐communicable diseases. ‐ The classroom component aimed to involve students in health‐promoting activities. EPOC: educational meetings ‐ Health education lectures, flash film, peer group discussions, flip charts, physical training classes. Family/community component: to reach out to the families and community through schools, including the following. EPOC: other ‐ Families were engaged via holiday assignments, school rally, distribution of pamphlets, list of healthy foods, and family orientation about non‐communicable diseases during parent/teacher meetings and annual functions. Theoretical underpinning: it was reported that the intervention was not based on any theoretical model. Description of control: not reported but assume usual practice. |
|
| Outcomes |
Outcome relating to the implementation of school policies, practices or programmes ‐ Schools having tobacco policy ‐ Policy about PA ‐ School food policy ‐ Mean of fried foods ‐ Mean of salted snacks ‐ Mean of healthy foods Data collection methods: measured using a school check list. The information was gathered from school authorities and by direct observation. Validity of measures used: not reported; however, the methods contained objective and non‐objective components. Outcome relating to cost: not reported Outcome relating to adverse consequences: not reported Outcome relating to child diet, PA or weight status: leisure time MVPA, time watching TV, consumption of fruit, vegetables, deep‐fried foods, salted snacks, purchasing 'eatables' from outside and smoking status. Data collection method: student survey Validity of measures used: not reported |
|
| Notes |
Research funding: India Institute of Medical Sciences, New Delhi. Conflicts of interest: authors reported no conflicts of interest. |
|
| Risk of bias | ||
| Bias | Authors' judgement | Support for judgement |
| Random sequence generation (selection bias) | Low risk | All villages predominantly on the left side of the main road passing through all the villages were considered 1 group and those on the right side another group. 1 group was allocated as intervention, and the other as control based on draw of lots. |
| Allocation concealment (selection bias) | Unclear risk | No information provided about allocation concealment and, therefore, it was unclear if allocation was concealed. |
| Blinding of participants and personnel (performance bias) Implementation outcome | High risk | Outcome group: all. No blinding or incomplete blinding, and the outcome was likely to be influenced by lack of blinding. |
| Blinding of outcome assessment (detection bias) Implementation outcome | High risk | Outcome group: school check‐list. The information was gathered from school authorities and by direct observation. No blinding of outcome assessment, and the outcome measurement was likely to be influenced by lack of blinding; self‐report considered high risk. Outcome group: all other outcomes High: collected using self‐report. |
| Incomplete outcome data (attrition bias) Implementation outcome | Low risk | Outcome group: school check‐list/all outcomes. No missing outcome data at school‐level and, therefore, low risk of attrition bias. |
| Selective reporting (reporting bias) | Unclear risk | No study protocol, therefore, it was unclear if there was selective outcome reporting. |
| Other bias | Unclear risk | Unclear if it was at risk of contamination. Did not appear at risk of other biases. |
| Recruitment to cluster | Low risk | Randomisation postrecruitment and baseline data collection. |
| Baseline imbalance | Unclear risk | School‐baseline characteristics not reported, Arbitrary zone boundary used to create groups and unclear if systematic differences existed between‐group areas although balance between government and private schools relatively even in both groups. |
| Loss of cluster | Low risk | No loss of clusters. |
| Incorrect analysis | High risk | Unit of analysis error for the primary trial implementation outcome. |
| Compatibility with individually randomised RCTs | Unclear risk | Unable to determine if a herd effect existed. |
| Overall risk of bias assessment | Unclear risk | Most domains were at unclear risk of bias. |
Saunders 2006.
| Study characteristics | ||
| Methods |
Trial name: Lifestyle Education for Activity Program (LEAP) Study design: cluster‐RCT for implementation outcome Intervention duration: 2 years Length of follow‐up from baseline: 12 months Differences in baseline characteristics: there were no baseline age or racial/ethnic differences between girls in the control and the intervention schools. Unit of allocation: schools Unit of analysis: school |
|
| Participants |
School type: high schools in 14 South Carolina counties (1998–2000) Region: South Carolina, US Demographic/socioeconomic characteristics: no details about participating schools. Of students, 48.7% were African American and 46.7% were white, which was comparable to the population of the participating schools. Inclusion/exclusion criteria: not reported Number of schools allocated: 24 Numbers by trial group n (controls baseline) = 12 schools and 1221 girls n (controls follow‐up) = 12 schools and 741 girls n (interventions baseline) = 12 schools and 1523 girls n (interventions follow‐up) = 12 schools and 863 girls Recruitment Schools: not reported Students: 8155 eighth‐grade girls who attended 1 of the 31 middle schools that "fed" students to the 24 participating high schools were invited to complete the measures. These girls participated in a school assembly during which the measurement protocol was explained, incentives were described (gifts and promotional items valued at < USD10), and all girls were invited to participate. Recruitment rate School districts:not reported Schools: 24 schools, did not report school recruitment rate. Students:97% of those recruited completed the baseline measures (2744/2841 eighth‐grade girls who volunteered to participate in the measurement protocol). |
|
| Interventions |
Number of experimental conditions: 2 (1 intervention, 1 control) Policies, practices or programmes targeted by the intervention The LEAP intervention focused on changing personal, social and environmental factors related to PA and involved changes to the school environment and instructional programmes. Instructional programme components included changes in PE and health instruction to enhance PA self‐efficacy and enjoyment. Schools were not required to implement a specific LEAP curriculum. Rather, to change instructional practice. The environmental strategy involved changing school practices that encouraged and supported PA and included changes to school health services, faculty staff health promotion, school environment and school community linkages. The original 6 components of LEAP from the Coordinated School Health Program model were expanded to 16 "essential elements" (including instructional and environmental). Of these, schools were expected to implement all instructional elements and 3 environmental elements (school administrator support, school PA team and media messages promoting PA). Implementation strategies EPOC: educational outreach visits ‐ 2 full‐time programme support staff provided. EPOC: local opinion leaders ‐ Each LEAP team was headed by a LEAP champion who was usually the teacher responsible for girls PE. The LEAP champion was either the person assigned to be the primary contact for the school or the person who evolved as the strongest supporter of the intervention effort. The LEAP champion, in co‐ordination with the LEAP project staff, worked to involve school administrators, teachers and staff in the LEAP team. EPOC: educational meetings ‐ Schools received training and strong encouragement to implement the remaining environmental elements. Staff training consisted of formal workshops and 1‐on‐1 TA for school personnel. Training was provided through in‐service days before and during the school year. EPOC: educational materials ‐ LEAP staff maintained a wide range of resources, including PA videotapes and books EPOC: other ‐ Equipment (hand weights, exercise bands, pedometers) for the intervention schools. EPOC: local consensus processes ‐ LEAP staff worked with the LEAP champion and the LEAP team in each school to identify opportunities to enhance the environment or change school policy in support of PA. Training was provided for developing and implementing strategic plans to promote PA in the school. LEAP staff provided ongoing consultation and support to LEAP schools through regular visits, telephone calls, e‐mail and lists. Theoretical underpinning An ecological model provided the organising framework for the LEAP intervention and drew primarily from Social Cognitive Theory for the overall intervention. Nothing specific to the implementation strategy. Description of control: 12 control schools received no treatment. |
|
| Outcomes |
Outcome relating to the implementation of school policies, practices or programmes ‐ (Active PA team) School PA team – a team that regularly planned, implemented and evaluated student and faculty PA programmes. ‐ (Admin support) School administrator supports PA promotion – tangible support from the principal for PA promotion, such as providing time and resources PE classes and PA programmes; participates on PA team. ‐ (Emphasise lifelong PE) Emphasises lifelong PA – classes emphasise a variety lifetime PAs girls enjoy, such as dance, aerobics, strength training, etc. ‐ (Co‐op options in PE) Included co‐operative activities – PE had co‐operative games, activities and team‐building, along with the traditional, competitive sport activities. ‐ (Provide health services) School nurse counselling for PA (health services) – school nurse regularly counselled students about PA and had materials related to PA in health room. ‐ (Health promotion for staff) Adult modelling of PA through faculty/staff health promotion – school had an active wellness programme in place which sponsors PA programmes for staff. ‐ (Provide health education) Health education reinforced messages and skills taught in PE – instructional activities in health education complemented and reinforced those taught in PE. ‐ (Co‐ordinate PA events with community) Community agency involvement – school collaborated with community agencies to provide PA programmes and resources for students, faculty/staff and families. ‐ (Family involvement) Family involvement – families were provided information about PA, PA resources and PA opportunities. Data collection method: the organisational assessment interview was a 22‐item interview (administered in 10–15 minutes) conducted by the independent process evaluator in all intervention and control schools with a school administrator (usually assistant principal), to assess organisational‐level components (i.e. school environment and instruction practice consistent with the LEAP intervention). This tool assessed organisational‐level factors and, unlike the process tools described in the previous section, was not designed to measure implementation. The organisational assessment rated 9 of the essential elements, including 7 environmental factors and 2 instructional factors. Additional items assessed events and activities (secular events) that could affect project outcomes such as participation in PE teacher training and receiving an award in school health, and organisational resources such as budget for PE. Validity of measures used: not reported/self‐report methods Outcome relating to cost: not reported Outcome relating to adverse consequences: not reported Outcome relating to child diet, PA or weight status: PA and weight status Data collection method PA:the 3DPAR, a modification of the Previous Day Physical Activity Recall, was used to assess PA. Weight status:height and weight were measured in a private setting while students were dressed in light clothing. Height was measured to the nearest 1.0 cm with a portable stadiometer (Shorr Productions, Olney, Maryland); weight was measured to the nearest 0.1 kg with a calibrated digital scale (model PS6600, BeFour, Inc, Saulsville, WI). BMI was calculated as bodyweight in kg divided by height in metres squared. Validity of measures used PA:3DPAR Weight status:BMI classified in accordance with the CDC's growth charts for BMI. |
|
| Notes |
Notes: in the LEAP trial, implementation of targeted policies and practices in the experimental group was presented in subgroups of 'high' and 'low' implementers and could not be combined into a single group. As such, effect size estimates for outcomes reported in this trial between groups were unable to be reported. Research funding: National Heart, Lung and Blood Institute (R01 HL057775) Conflicts of interest: authors reported no conflicts of interest. |
|
| Risk of bias | ||
| Bias | Authors' judgement | Support for judgement |
| Random sequence generation (selection bias) | Unclear risk | Schools were paired by school size, percentage of girls who were African American, urban/suburban or rural location and class structure. Schools from each pair were randomly assigned to control or intervention groups. Random sequence generation procedure not described. |
| Allocation concealment (selection bias) | Unclear risk | No information provided about allocation concealment and, therefore, it was unclear if allocation was concealed. |
| Blinding of participants and personnel (performance bias) Implementation outcome | High risk | Outcome group: all Given the nature of the intervention, participants and study personnel are likely to have been aware of study allocation and, therefore, high risk of performance bias. |
| Blinding of outcome assessment (detection bias) Implementation outcome | High risk | Outcome group: organisational assessment interview. No blinding of outcome assessment and the outcome measurement was likely to be influenced by lack of blinding; self‐report considered high risk. |
| Incomplete outcome data (attrition bias) Implementation outcome | Low risk | Outcome group: organisational assessment interview. There were no missing outcome data and, therefore, low risk of attrition bias. Outcome: BMI and child PA High: loss to follow‐up 24% at 1 year; unclear if this was even across groups. Did not mention the use of ITT. |
| Selective reporting (reporting bias) | Unclear risk | No study protocol, therefore, it was unclear if there was selective outcome reporting. |
| Other bias | Low risk | Appeared free from other bias. |
| Overall risk of bias assessment | Unclear risk | Most domains were at low or unclear risk of bias. |
Simons‐Morton 1988.
| Study characteristics | ||
| Methods |
Trial name: Go for Health Study design: non‐randomised Intervention duration: 2 years Length of follow‐up from baseline: 12 months. Data collection was conducted during the Spring semester at baseline and the first follow‐up after 1 year of intervention. Differences in baseline characteristics: the ethnic distributions were comparable between treatment and control conditions and were similar to the ethnic distribution in the community. Unit of allocation: schools (elementary) Unit of analysis: schools (elementary) |
|
| Participants |
School type: elementary schools in Texas City Independent School District Region: Texas, USA Demographic/socioeconomic characteristics: for all schools combined, ethnic distributions were Anglo‐American (62.3%), Mexican‐American (20.9%), Black‐American (14.8%) and Asian and American Indian (2%) Inclusion/exclusion criteria: not reported Number of services allocated: 4 schools included Numbers by trial group n (controls baseline) = 2 n (controls follow‐up) = 2 n (interventions baseline) = 2 n (interventions follow‐up) = 2 (1293 third and fourth‐grade students were enrolled in the 4 study schools). Recruitment Schools: all 4 schools in the Texas City Independent School District participated. Students:at baseline, 1293 third‐ and fourth‐grade students were enrolled in the 4 study schools. Recruitment rate Schools:not reported |
|
| Interventions |
Number of experimental conditions: 2 (1 intervention, 1 control) Policies, practices or programmes targeted by the intervention Innovations introduced into the schools included: New School Lunch and Health Education for Healthful Diet. Implementation of each of the programme components required organisational changes in school programmes and in the roles and practices of school personnel. Implementation strategies Commitment of school district administrators to adopt the programme was obtained in writing before intervention was initiated. Principals at each experimental school adopted a statement of support for the goal of providing healthful diet. Planning groups, consisting of teachers and staff, were established to inform intervention staff and to foster programme ownership EPOC: other ‐ Institutional commitment: principals adopted an official statement of support for the goal to provide healthy diet. Alterations in Policies and Practices: 1. Policies to change food purchasing and menu planning, 2. policies to support formation of school health task force at each school to develop school wide learning activities. Alterations in roles and actions of staff: 1. changes to food preparation, presentations and addition of healthy alternatives, 2. school health task force and school staff plan social learning activities to provide social support for continuation and to assist students to learn targeted behaviours. Student learning: changes in behaviour to 1. increase selection and consumption of low‐sodium, low‐fat foods, 2. increase duration and frequency in aerobic activity and 3. skill development, modelling, behaviour rehearsal, reinforcement. School lunch EPOC: monitoring of performance ‐ Existing menu planning, food purchasing, recipe selection and food preparation practices were examined by project staff. EPOC: local consensus processes ‐ Specific practice changes in 4 areas purchasing, menu planning, recipes and food preparation were identified and negotiated with the food service director and with intervention school cafeteria managers. EPOC: educational outreach visits ‐ The dietitian worked with the cafeteria managers and cooks to adjust standard recipes to reflect 25% reductions in fat and sodium. To facilitate implementation, food handlers received 6 hours of summer in‐service training conducted by the project staff in co‐operation with cafeteria managers. The food service director and cafeteria managers were actively involved in the development of the new school lunch. ‐ The staff dietitian continually solicited the input and impressions of the cooks both formally and informally. ‐ To foster adoption of the modules, teachers were provided with 1 hour of training prior to the start date for each module. EPOC: managerial supervision ‐ During the school year, the staff dietitian served as a consultant and was present in the treatment schools on a regular basis, providing feedback on performance and assistance in resolving food viability, recipe preparation, cooking, and serving problems. Health education for healthful diet EPOC: educational materials ‐ The innovation consisted of 6 health education modules on diet. ‐ The modules were attractively packaged with visual aids and teaching materials ready to be handed out to the children. EPOC: local opinion leaders ‐ The classroom modules were developed by project staff with the aid of a classroom teacher who had recently retired from the school district. EPOC:other ‐ Children were eligible to receive token incentives (stickers, T‐shirts, sweat bands) upon completion of the major learning activities. Theoretical underpinning: Charter and Jones framework 4 levels at which implementation of innovations may occur in a school: 1. institutional commitment, 2. structural context, 3. role performance and 4. learning activities. Description of control: not reported but assume usual practice. |
|
| Outcomes |
Outcome relating to the implementation of school policies, practices or programmes ‐ Sodium content of school meals in milligrams by schools ‐ Fat content of school lunches in grams Data collection method: the identical menu was repeated in March and April each year of the study. At baseline, 12 meals were selected randomly from the March and April menus and analysed for nutrient content. Recipe analyses, based on detailed interviews with each cook in the intervention schools at baseline and in all 4 schools at mid‐test and post‐test, were conducted by trained staff nutritionists and analysed by the Nutrition Coding Center. Validity of measures used: not reported/self‐report methods Outcome relating to cost: not reported Outcome relating to adverse consequences: not reported Outcome relating to child diet, PA or weight status: child sodium and fat intake Data collection method: a 24‐hour dietary recall interview was administered. Each child was interviewed at home in the company of 1 parent, who was asked about ingredients, food preparation and other items as needed. Validity of measures used: not reported |
|
| Notes |
Note: this trial also included a PA component in the programme; however, it did not report a corresponding implementation outcome measure. Consequently, this trial was reported as a nutrition trial only. Research funding: grant HL33376 from National Heart, Lung, and Blood Institute, National Institute of Health. Conflicts of interest: not reported |
|
| Risk of bias | ||
| Bias | Authors' judgement | Support for judgement |
| Random sequence generation (selection bias) | High risk | Non‐randomised trial. Elementary schools were not randomly assigned to experimental condition and, therefore, high risk of selection bias. |
| Allocation concealment (selection bias) | High risk | Non‐randomised trial. There is no indication that allocation was concealed and, therefore, were at high risk of selection bias. |
| Blinding of participants and personnel (performance bias) Implementation outcome | High risk | Outcome group: all Due to nature of the intervention, school staff and study personnel delivering the intervention were not blind to study allocation. |
| Blinding of outcome assessment (detection bias) Implementation outcome | Unclear risk | Outcome group: new school lunch Blinding of outcome assessment ensured, and unlikely that the blinding could have been broken (low risk of bias). Outcome group: PE Random, anonymous observations of children's PA were made during PE classes by trained observers. Insufficient information to permit judgement of low or high risk, e.g. not reported in methods or register (unclear risk of bias). Outcome group: classroom instruction No blinding of outcome assessment and the outcome measurement is likely to be influenced by lack of blinding; self‐report considered high risk (high risk of bias). Outcome group: nutrient analysis of school lunches Recipe analyses were conducted by trained staff nutritionists. Insufficient information to permit judgement of low or high risk; e.g. not reported in methods or register (unclear risk of bias). |
| Incomplete outcome data (attrition bias) Implementation outcome | Low risk | Outcome group: new school lunch There were no missing outcome data. Outcome group: PE There were no missing outcome data. Outcome group: classroom instruction Missing outcome data balanced in numbers across intervention groups, with similar reasons for missing data across groups. Outcome group: nutrient analysis of school lunches There were no missing outcome data. |
| Selective reporting (reporting bias) | Unclear risk | No study protocol, therefore, it was unclear if there was selective outcome reporting. |
| Other bias | Low risk | Appeared free from other bias. |
| Potential confounding | High risk | Appeared no adjustments were made in analysis for school‐based confounders. |
| Overall risk of bias assessment | High risk | Most domains were at high risk of bias. |
Story 2000.
| Study characteristics | ||
| Methods |
Trial name: 5‐a‐Day Power Plus Study design: cluster‐RCT Intervention duration: unclear (beginning in the fourth grade (1994–1995) and throughout the fifth‐grade school year (1995–1996) Length of follow‐up from baseline: approximately 12 months Differences in baseline characteristics: similar – schools were matched pairs that were then randomised. Unit of allocation: schools Unit of analysis: cafeteria observations |
|
| Participants |
School type: elementary schools Region: St Paul, Minnesota, USA Demographic/socioeconomic characteristics: of the 1750 fourth‐grade students enrolled at baseline, 1.3% were Native American, 6.4% were Hispanic, 19.1% were African American, 25.2% were Asian American (largely Hmong) and 48% were white. Approximately 60% of the students were eligible for free or reduced‐price school meals. Inclusion/exclusion criteria: not reported Number of schools allocated: 20 inner‐city public elementary schools Numbers by trial group: 10 intervention, 10 control Recruitment: recruitment strategy not reported Recruitment rate: not reported |
|
| Interventions |
Number of experimental conditions: 2 (1 intervention, 1 control) Policies, practices or programmes targeted by the intervention The intervention consisted of a parent, industry, curricula and classroom component. Only the food service and curricula components were subject to an implementation strategy. Only the food service component had an implementation outcome assessed between experimental groups and consequently, only food service implementation strategies were extracted. Regarding the food service intervention, the 4 food service intervention strategies were 1. point‐of‐purchase promotion of fruit and vegetable using characters and messages from the classroom curricula, 2. increasing the appeal of fruit and vegetable by enhancing their attractiveness, 3. increasing the variety and choice of fruit and vegetable served and 4. offering an additional fruit choice on days when baked or frozen desserts were served. These 4 strategies involved 8 guidelines on how to offer appealing fruit and vegetable choices and 4 promotion guidelines. Implementation strategies EPOC: educational meetings ‐ Centralised training sessions were held for food service staff from the intervention schools. It was held during a regularly scheduled school day and was conducted by the 5‐a‐Day Power Plus staff. Food service staff attended the teacher training for 2 hours and also attended 2‐hour training after school each of the 2 intervention years. Food service staff members were paid for attending the training members were paid for attending the training. EPOC: other ‐ A local producer provided some fruit and vegetable for use in classroom taste testing, home snack packs and to expand choice in school lunch. They also provided a 30‐minute presentation on fruit and vegetable to each of the fifth‐grade intervention classrooms. Service staff members were paid for attending the training. Theoretical underpinning: 5‐a‐Day Power Plus intervention programme was guided by Social Cognitive Theory and social learning theory. Description of control: not reported but assume usual practice. |
|
| Outcomes |
Outcome relating to the implementation of school service policies, practices or programmes ‐ Mean number of fruit and vegetable choices available fourth grade ‐ Mean number of fruit and vegetable choices available fifth grade ‐ Mean % of 8 guidelines on how to offer appealing fruit and vegetable met fourth grade ‐ Mean % of 8 guidelines on how to offer appealing fruit and vegetable met fifth grade ‐ Mean % of 4 fruit and vegetable promotions met fourth grade ‐ Mean % of 4 fruit and vegetable promotions met fifth grade Data collection method: an observation‐based process evaluation method was also developed to assess the food service intervention implementation. Direct observations were conducted in each of the 10 intervention and 10 control schools on a monthly basis using trained observers and standardised protocols and instruments. Validity of measures used: not reported; however, considered an objective measure of implementation. Outcome relating to cost: not reported Outcome relating to adverse consequences: not reported Outcome relating to child diet, PA or weight status: student dietary intake Data collection method: 24‐hour quantified food record and recall and student canteen observations. Validity of measures used: not stated, although observations considered an objective measure. |
|
| Notes |
Research funding: grant R01CA59805 from the National Institute of Health. Conflicts of interest: not reported |
|
| Risk of bias | ||
| Bias | Authors' judgement | Support for judgement |
| Random sequence generation (selection bias) | Unclear risk | Schools were matched in pairs and randomly allocated to experimental group. Random sequence generation procedure not described. |
| Allocation concealment (selection bias) | Unclear risk | No information provided about allocation concealment and, therefore, it was unclear if allocation was concealed. |
| Blinding of participants and personnel (performance bias) Implementation outcome | High risk | Outcome: all outcomes. High: participants (teachers and cooks) were aware that they were being asked to implement an intervention. There was no blinding to group allocation and this was likely to influence performance. |
| Blinding of outcome assessment (detection bias) Implementation outcome | High risk | Outcome group: all. Trained evaluation staff visited each school to conduct observations using standardised protocols and measures. However, there was no information provided about whether these personnel were blinded to group allocation and teacher self‐reported measures were completed. |
| Incomplete outcome data (attrition bias) Implementation outcome | Low risk | Outcome group: there was no report of any schools dropping out of the study. No mention of ITT analysis in manuscripts. Outcome: diet Low: loss to follow‐up < 10% with reasons provided. |
| Selective reporting (reporting bias) | Unclear risk | No study protocol, therefore, it was unclear if there was selective outcome reporting. |
| Other bias | Low risk | Did not appear to be at risk of contamination or other biases. |
| Recruitment to cluster | Low risk | Individuals within each randomised cluster participated. |
| Baseline imbalance | Low risk | Schools were randomly allocated to condition and so risk of baseline imbalance was low. |
| Loss of cluster | Low risk | There was no report of any schools dropping out of the study. |
| Incorrect analysis | High risk | There was no reporting of statistical techniques apart from simple t‐tests. |
| Compatibility with individually randomised RCTs | Unclear risk | Unable to determine if a herd effect existed. |
| Overall risk of bias assessment | Low risk | Most domains were at low risk of bias. |
Sutherland 2017.
| Study characteristics | ||
| Methods |
Trial name: no trial name Study design: cluster‐RCT Intervention duration: 2 school terms Length of follow‐up from baseline: 6 months Differences in baseline characteristics: assumed to be none Unit of allocation: schools Unit of analysis: schools and school classes |
|
| Participants |
School type: primary schools Region: HNE region of NSW Demographic/socioeconomic characteristics: socio‐economically disadvantaged communities Inclusion/exclusion criteria Inclusion ‐ Government or Catholic schools. ‐ Located within HNE Local Health District. ‐ Having a SES score of ≤ 5 (lower 50% of NSW) based on school postcode. ‐ Not participating in other PA studies. Number of services allocated: 46 Numbers by trial group n (controls baseline) = 21 n (controls follow‐up) = 21 n (interventions baseline) = 25 n (interventions follow‐up) = 25 Recruitment Schools: 46 Students: 1139 Recruitment rate Schools: 72% Students: 58% |
|
| Interventions |
Number of experimental conditions: 2 (1 intervention, 1 control) Policies, practices or programmes targeted by the intervention The evidence‐based school PA programme known as SCORES (Supporting Children's Outcomes using Rewards, Exercise and Skills) was rolled out in primary schools and the implementation intervention strategies facilitated its roll‐out. Implementation strategies EPOC: audit and feedback ‐ Schools were provided feedback on the implementation of the intervention on 3 occasions via email. Classroom teachers were given detailed feedback reports on PE lesson quality on 2 occasions. Feedback was based on the Supportive, Active, Autonomous, Fair and Enjoyable (SAAFE) teaching principles. EPOC: education materials ‐ Teachers were provided with resources (lesson booklets, posters, whistles, lanyards and fundamental motor skills cards) to support delivery of high‐quality PE lessons, teach fundamental motor skills and increase MVPA within PE lessons. EPOC: education meeting ‐ All classroom teachers were offered a 90‐minute professional learning workshop including theory and practical sessions. The workshop focused on delivery of fundamental motor skills to students, strategies to improve lesson quality through student engagement and increase students' MVPA. The quality PE teaching principles were from the original SCORES programme and known as the SAAFE teaching principles. In additional, teachers were required to team teach a PE lesson with experienced Health Promotion staff on 1 occasion. EPOC: education outreach visits ‐ Peer teaching with experienced Health Promotion staff with a PE background was offered to classroom teachers in intervention schools. PE lessons were also observed, followed by written feedback and verbal encouragement. EPOC: local opinion leader ‐ A meeting with school executive was held at the commencement of intervention and a school champion nominated for each school. School champions were responsible for embedding the PA practices within the school and leading policy development. Ongoing support was provided throughout the intervention from experienced Health Promotion staff. EPOC: other ‐ Ongoing support: was provided to school champions to embed the practices within their schools. Additional support was provided to classroom teachers via 5 × 5‐minute video clips viewed in staff meetings, reinforcing the quality PE teaching principles (based on the SAAFE principles). Classroom teachers were provided with stickers to be used as prompts for quality PE and issued to students throughout practical PE. School champions provided prompts to classroom teachers to implement the strategies via email, electronic calendar reminders and in meetings. School champion also received a polo shirt. Intervention schools also received equipment (USD180) to support delivery of recess and lunchtime activities. Theoretical underpinning: social‐ecological theory Description of control: control schools participated in the measurement components of the trial only and delivered school PA practices according to the curriculum. Support was offered postdata collection. |
|
| Outcomes |
Outcome relating to the implementation of school policies, practices or programmes ‐ School PA policy or plan (% of schools) ‐ Overall lesson quality score ‐ Recess PA (mean % of days offered) ‐ Lunch PA (mean % of days offered) ‐ Provision of sports equipment at recess (mean % of days offered) ‐ Provision of sports equipment at lunch (mean % of days offered) ‐ Provision of parent newsletters regarding PA Data collection method: survey and observation Validity of measures used: not reported/contained both objective and self‐report measures. Outcome relating to cost: not reported Outcome relating to adverse consequences: not reported Outcome relating to child diet, PA or weight status: PA Data collection method: accelerometer Validity of measures used: objective |
|
| Notes |
Research funding: no financial disclosures were reported by the authors of this paper. Conflicts of interest: all authors declared no conflict of interest. |
|
| Risk of bias | ||
| Bias | Authors' judgement | Support for judgement |
| Random sequence generation (selection bias) | Low risk | Cluster‐RCT. Random sequence produced using computerised random number function in Microsoft Excel. |
| Allocation concealment (selection bias) | Unclear risk | No information provided about allocation concealment and, therefore, it was unclear if allocation was concealed. |
| Blinding of participants and personnel (performance bias) Implementation outcome | High risk | Outcome group: implementation Both the schools and the Health Promotion staff delivering the intervention were aware of the schools' group allocation. Outcome: objectively measured (child PA) Low: objectively measured |
| Blinding of outcome assessment (detection bias) Implementation outcome | Low risk | Outcome group: PE teaching quality Low: lessons observed by trained research staff with experience in PE, blinded to group allocation. Outcome group: school PA practices High: teacher‐reported practices and due to the nature of the intervention teachers could not be blinded and, therefore, were at high risk of detection bias. Outcome: child PA Low: objectively measured |
| Incomplete outcome data (attrition bias) Implementation outcome | Low risk | Outcome group: school PA practice 2 Low: quote: "69 lessons were observed (88% of eligible lessons)". Outcome group: school PA practice 1, 3 and 4 High: quote: "141 (87 intervention, 54 control) of the 382 eligible school teachers (37%) completed an online survey across the 46 participating intervention and control schools". High attrition and unequal across study arms. Outcome: child PA Low: 87% provided accelerometer data. |
| Selective reporting (reporting bias) | Low risk | Quote: "The trial was registered with the Australian New Zealand Clinical Trials Registry (ACTRN12615000437561)". All predetermined outcomes were reported. |
| Other bias | Low risk | Did not appear to be at risk of contamination or other bias. |
| Recruitment to cluster | Low risk | Recruitment bias: individuals within each randomised cluster participated/random allocation of schools to group occurred postrecruitment. |
| Baseline imbalance | Low risk | Baseline imbalance: schools were randomly allocated to condition and so risk of baseline imbalance was low. |
| Loss of cluster | High risk | Loss of clusters: high risk of loss of clusters based on teacher reported data. |
| Incorrect analysis | Unclear risk | Incorrect analysis: unclear if clustering was taken into account for the teacher‐reported school PA practices. |
| Compatibility with individually randomised RCTs | Unclear risk | Compatibility with individually randomised RCTs (cluster‐RCTs): unable to determine if a herd effect existed. |
| Overall risk of bias assessment | Low risk | Most domains were at low risk of bias. |
Sutherland 2020.
| Study characteristics | ||
| Methods |
Trial name: Physical Activity 4 Everyone (PA4E1) Study design: cluster‐RCT Intervention duration: implementation duration 24 months. However, data from the first 12 months only reported thus far. Length of follow‐up from baseline: 12 months' follow‐up Differences in baseline characteristics: groups were similar; however, there were more large schools and fewer medium schools in the programme. Unit of allocation: cluster = school Unit of analysis Implementation outcomes: school Behavioural/health outcomes: not reported |
|
| Participants |
School type: government or Catholic secondary schools Region: 4 local health districts in NSW. Schools were located in areas classified as being disadvantaged by the SEIFA Index of Relative Socio‐economic Disadvantage (suburb in lower 50% of NSW). Demographics/socioeconomic characteristics: these districts included approximately 34% of Government and Catholic secondary schools, and 34% of the secondary school student population in NSW. Inclusion/exclusion criteria Inclusion ‐ Government or Catholic schools. ‐ Students enrolled in grades 7–9. ‐ They were located in areas classified as being disadvantaged by the SEIFA Index of Relative Socioeconomic Disadvantage (suburb in lower 50% of NSW). ‐ They were not intervention schools in the original PA4E1 trial. ‐ They were not specialist or fully selective/sports/performing arts/agriculture/boarding schools. ‐ They were not participating in other major whole‐school PA trials or initiatives. Exclusion ‐ Schools in deciles 6–10 were not eligible for the trial. Number of schools allocated Schools:24 intervention schools and 25 control schools Students: 3539 intervention students and 2937 control students Numbers by trial group Recruitment Schools:49 schools were recruited.Recruitment of schools occurred from May to November 2017. The principal or head PE teacher (or both) was contacted by telephone by a Project Officer who had a training background as a PE teacher, to invite their school to participate. A face‐to‐face or telephone meeting was offered to outline the requirements of the study, confirm eligibility and gain active written or oral consent. Students:this was an open trial due to the inability to blind schools and teachers to the programme strategies. Recruitment rate Schools:106 schools, 49 consented and 57 declined (46% consent rate) Students:not reported |
|
| Interventions |
Number of experimental conditions: 2 intervention and control Policies, practices or programmes targeted by the intervention Primary: proportion of schools adopting ≥ 4 of the 7 PA practices. Secondary: 1. mean number of practices achieved; 2. whether or not schools implemented each of the 7 practices. Implementation strategies EPOC: audit and feedback ‐ Peer observation feedback is against the department's quality PE principles. ‐ Implementation performance monitoring and feedback surveys was taken by the In‐School Champion each term via the programme website (PA4E1 Online). A feedback report was automatically generated and sent to in‐School Champions and the school Principals via email. EPOC: educational materials ‐ Newsletters, parent app, and parent information evening. ‐ Printed posters outlining Quality PE principles (SAAFE Principles) to be displayed in PE department delivered to in‐School Champions. ‐ Electronic resources housed on the programme website (PA4E1 online) included an overview of programme presentation; project milestones to be achieved each term (over 4 terms), online quality PE training; student personal PA plan templates; recess and lunch resources; policy templates; examples of community PA providers; and tips and frequently asked questions. EPOC: educational meetings ‐ Peer observation of a practical PE lesson. ‐ Parent information evening. EPOC: educational outreach visits or academic detailing ‐ Health Promotion Support Officer (ideally a trained PE teacher) appointed to support schools with the programme was co‐located within the relevant local health district. Weekly contact was made with in‐School Champion via telephone, email, face‐to‐face site visits or a combination of these for 12 months. ‐ Support Officer and in‐School Champion had a face‐to‐face contact at least once a term. EPOC: clinical practice guidelines ‐ PE department used documented principles or guidelines for teachers to maximise PE quality, active learning time and student engagement in PE lessons (programme schools used the SAAFE principles. EPOC: interprofessional education ‐ Enhanced school sport training – in‐School Champions and other teachers involved in delivering the programme could attend an existing 1‐day face‐to‐face Resistance Training for Teens workshop offered by the NSW Department of Education (School Sport Unit), or equivalent training run by PA4E1 implementation team (not accredited). Course costs to be paid by project for in‐School Champion, but not for other teachers. ‐ School PA policy training – in‐School Champion offered existing online training run by the NSW Department of Education School Sport Unit (Government schools only, n = 19). EPOC: local opinion leaders ‐ Embedded school staff: in‐School Champion. An existing school PE teacher was allocated the role of in‐School Champion to support implementation for full 12 months. The position was funded by the NSW Department of Health, half day per week (equivalent to AUD350 every 2 weeks). EPOC: other ‐ Development of school policy. Theoretical underpinning ‐ Of the evidence‐based intervention/policy/practice or programme: Health promoting school framework and Social Ecological Theory. ‐ Of the implementation strategy: Theoretical Domains Framework and the Behaviour Change Wheel. Description of control: the control schools continued with their usual practices and received no contact from the research team other than to organise data collection. |
|
| Outcomes |
Outcome relating to the implementation of school policies, practices or programmes ‐ Proportion of schools adopting ≥ 4 of 7 PA practices: 1. quality PE lessons; 2. student PA plans; 3. enhanced school sport programme; 4. recess/lunchtime PA; 5. school PA policy or procedure; 6. links with community PA providers; 7. communicating PA messages to all parents). ‐ Mean number of practices achieved. ‐ Whether or not schools implemented each of the 7 practices. ‐ Fidelity. ‐ Reach. Data collection method: telephone interviews with head PE teachers. Validity of measures used: self‐report Outcome relating to cost: not yet published Outcome relating to adverse consequences: not yet published Outcome relating to child diet, PA or weight status: not yet published Data collection method: not reported Validity of measures used: not reported |
|
| Notes |
Research funding: NSW Ministry of Health, Translational Research Grant Scheme. The NSW Ministry of Health has not had any role in the design of the study as outlined in this protocol and will not have a role in data collection, analysis of data, interpretation of data and dissemination of findings. The project also received infrastructure support from the Hunter Medical Research Institute (HMRI). Conflicts of interest: authors RS, LC, NN, LW, KG, MW, NE, AB and JW received salary support from their respective Local Health Districts. Hunter New England Local Health District contributes funding to the project. None of these agencies were involved in the peer review of this grant. All other authors declared no competing interests. |
|
| Risk of bias | ||
| Bias | Authors' judgement | Support for judgement |
| Random sequence generation (selection bias) | Low risk | Stratified block randomisation was used to allocate consenting schools to 1 of 2 groups in a 1:1 ratio. Separate random block sequences of sizes 2 and 4 were used within each of 8 strata. The blocks were created through SAS version 9.3. Population of the blocks involved using a random number generator in Microsoft Excel to randomise the order of the schools, prior to pasting into their respective stratum block. This was conducted by a statistician not involved in recruitment and blinded during the randomisation phase. |
| Allocation concealment (selection bias) | Low risk | Stratified block randomisation was used to allocate consenting schools to 1 of 2 groups in a 1:1 ratio. Separate random block sequences of sizes 2 and 4 were used within each of 8 strata. The blocks were created through SAS version 9.3. Population of the blocks involved using a random number generator in Microsoft Excel to randomise the order of the schools, prior to pasting into their respective stratum block. This was conducted by a statistician not involved in recruitment and blinded during the randomisation phase. |
| Blinding of participants and personnel (performance bias) Implementation outcome | High risk | The nature of the study precluded blinding. This was an open trial due to the inability to blind schools and teachers to the programme strategies. |
| Blinding of outcome assessment (detection bias) Implementation outcome | High risk | Measures of the school practices were undertaken via computer‐assisted telephone interview surveys with head PE teachers, administered by trained interviewers. Self‐report was considered high risk. |
| Incomplete outcome data (attrition bias) Implementation outcome | Low risk | No schools lost at the 12‐month follow‐up. Outcome data were available for all schools. |
| Selective reporting (reporting bias) | Unclear risk | Protocol available. Trial incomplete. Unclear as several other outcomes were preregistered in the trial registration; however, are yet to be published. |
| Other bias | Low risk | Did not appear to be at risk of contamination and other biases. |
| Recruitment to cluster | Low risk | Principals were notified by research staff of their school's allocation to either the intervention (programme) or usual care control following baseline collection of school practice measures (head PE teacher surveys). Randomisation occurred by a blinded statistician and process well‐documented in paper. |
| Baseline imbalance | Low risk | Groups were similar, although there were more large schools and fewer medium schools in the programme group. |
| Loss of cluster | Low risk | No loss of clusters. |
| Incorrect analysis | Low risk | Appeared to take clustering into account. |
| Compatibility with individually randomised RCTs | Unclear risk | No statement regarding this. |
| Overall risk of bias assessment | Low risk | Most domains were at low risk of bias. |
Taylor 2018.
| Study characteristics | ||
| Methods |
Trial name: Shaping Healthy Choices Program (SHCP) Study design: cluster‐RCT for implementation outcome Intervention duration: 9 months Length of follow‐up from baseline: 9 months autumn 2012 to spring 2013 Differences in baseline characteristics: characteristics of schools and participating students were similar across the 2 school sites, although a greater proportion of control students had 1 or both parents with a bachelor's degree or above (Chi2 = 6.496, P < 0.05). Unit of allocation: cluster (school) Unit of analysis: ‐ Implementation outcomes: cluster (school) ‐ Behavioural/health outcomes: individual (child) |
|
| Participants |
School type: 2 elementary schools Region: 2 school districts in central and Northern California, USA Demographics/socioeconomic characteristics: ethnic diversity index: control 76, intervention 64. FARMS eligibility: control 29.6, intervention 34.2; greater proportion of control students had 1 or both parents with a bachelor's degree or above (Chi2 = 6.496, P < 0.05). Inclusion/exclusion criteria Inclusion Schools were selected based on moderate eligibility rates for FARMS (30–49%), presence of ≥ 4 fourth‐grade classrooms, absence of a salad bar and absence of an instructional school garden. Exclusion:not reported Number of schools allocated Schools:2 Students:111 children with pretest data and 112 with post‐test data. Numbers by trial group n (controls baseline) = 39 students, 1 school n (controls follow‐up) = 39 students, 1 school n (interventions baseline) = 72 students, 1 school n (interventions follow‐up) = 72 students, 1 school (73 for vegetable outcome) Recruitment Schools:2 school districts in central and Northern California were recruited to participate in this pilot study evaluating the SHCP. Schools were selected based on moderate eligibility rates for FARMS (30–49%), presence of ≥ 4 fourth‐grade classrooms, absence of a salad bar and absence of an instructional school garden. Additional details on inclusion criteria and sample size determination are published elsewhere. Students:of the 303 students enrolled at the 2 schools, 294 fourth‐grade students (133 control, 161 intervention) consented into the study. Of these students, pretest data were available for 168 and 172 students for fruits and vegetables, respectively. Students with both pretest and post‐test data were included in the final sample, with data available for 111 and 112 students for fruits and vegetables, respectively. Recruitment rate Schools:not reported Students:not reported |
|
| Interventions |
Number of experimental conditions: 2 (1 intervention, 1 control) Policies, practices or programmes targeted by the intervention: healthy eating Implementation strategies EPOC: educational outreach visits ‐ Food‐service staff provided an in‐class demonstration of salad bar use prior to its cafeteria launch marketed regionally grown produce in the cafeteria as a complement to messaging in parent newsletters. EPOC: local consensus processes ‐ School site‐specific wellness committees. EPOC: educational materials ‐ District's nutrition services director was provided a list of foods grown in the garden and used in cooking demonstrations, so purchases could mirror SHCP activities when possible; 9 take‐home activities and family newsletters. EPOC: external funding ‐ A salad bar was installed in the intervention school cafeteria. The school district was provided USD3000 to increase procurement of regionally grown produce for use in the National School Lunch Program (NSLP). EPOC: other ‐ Health fair Theoretical underpinning ‐ Of the evidence‐based intervention/policy/practice or programme: social‐ecological model and Social Cognitive Theory. ‐ Of the implementation strategy: none reported. Description of control: control schools received a delayed intervention during the 2013–2014 school year. |
|
| Outcomes |
Outcome relating to the implementation of school policies, practices or programmes: fruit and vegetable availability within the school canteen. Data collection method Based on produce expenditures and variety for use in the schools' NSLP. The extent of regional produce procurement was documented by measuring regional and non‐regional procurement dollars spent in the intervention and control school cafeterias on fresh fruits and vegetables. For this school district, regional produce was defined using the nutrition services director's definition, which was approximately 7 hours of driving time from farm to canteen. Procurement records, including school inventory and delivery records as well as district invoices and year‐end summaries, provided the current level of produce procurement and types of produce purchased. Validity of measures used: not reported Outcome relating to cost: availability: the extent of regional produce procurement was documented by measuring regional and non‐regional procurement dollars spent in the intervention and control school cafeterias on fresh fruits and vegetables. Procurement records, including school inventory and delivery records as well as district invoices and year‐end summaries, provided the current level of produce procurement and types of produce purchased. Each month's expenditures were divided by the number of meals served in that period to arrive at mean dollars spent per participating student per day. Outcome relating to adverse consequences: fruit and vegetable waste at lunchtime was assessed via lunchtime intake method. Outcome relating to child diet, PA or weight status: child lunchtime intake of fruit and vegetables (selection not included). Data collection method: lunchtime intake of fruits and vegetables was assessed among students choosing meals provided through the NSLP. Selection, consumption and plate waste were determined for all fruits excluding juice and all vegetables offered as side dishes. Vegetables integrated in entrée dishes (e.g. burritos, lasagne) were excluded, because the intent of this evaluation was to focus on changes in dietary behaviour that may indicate that vegetables are chosen actively, as opposed to consuming them passively in mixed dishes. Because there are well‐known limitations of self‐reported dietary intake, such as depending on one's capacity to accurately estimate portion sizes, 16 dietary behaviours were assessed using digital imaging. Adopting protocols described in previous studies, digital images of students’ lunch trays were collected at the beginning and end of the meal with the students' study ID to facilitate matching of the selection and plate waste images. Validity of measures used: this method had demonstrated reliability and validity for measurement of fruit and vegetable consumption among elementary school students. |
|
| Notes |
Research funding: Division of Agriculture and Natural Resources, University of California (11‐1018), and US Department of Agriculture (2011‐38420‐20082, 221082). Conflicts of interest: none reported. |
|
| Risk of bias | ||
| Bias | Authors' judgement | Support for judgement |
| Random sequence generation (selection bias) | Unclear risk | No details on randomisation process. |
| Allocation concealment (selection bias) | High risk | Allocation could not have been concealed. Intervention school would have determined their status as a salad bar was installed. |
| Blinding of participants and personnel (performance bias) Implementation outcome | High risk | Outcome group: procurement records. High: schools were not blinded to group allocation. The nature of the study precluded blinding. Outcome group: fruit and vegetable outcome data and food wastage (adverse effects). High: children unlikely to know allocation, researchers blind to condition. Trained research analysts, blinded to treatment assignment, estimated quantities of fruits and vegetables selected, consumed and wasted in cups. |
| Blinding of outcome assessment (detection bias) Implementation outcome | Low risk | Outcome group: objective data (procurement records) likely to be low. |
| Incomplete outcome data (attrition bias) Implementation outcome | Unclear risk | Outcome group: procurement records. Unclear: incomplete data unclear. Assumed available for both schools. Outcome group: fruit and vegetable outcome data. High: 111 and 112/294 (about 38%) consenting students had both pretest and post‐test data. |
| Selective reporting (reporting bias) | Unclear risk | Unclear – no trial registry or protocol available. |
| Other bias | High risk | Appeared to be at risk of contamination and other biases. |
| Recruitment to cluster | Unclear risk | Unclear if students knew group allocation when consenting to the study. |
| Baseline imbalance | High risk | Characteristics of schools and participating students were similar across the 2 school sites, although a greater proportion of control students had 1 or both parents with a bachelor's degree or above (Chi2 = 6.496, P < 0.05). |
| Loss of cluster | Low risk | Presume no loss of clusters as there were only 2 schools. 303 students enrolled at the 2 schools, 294 fourth‐grade students consented into the study. Of these students, pretest data were available for 168 and 172 students for fruit and vegetables, respectively. Students with both pretest and post‐test data were included in the final sample, with data available for 111 and 112 students for fruit and vegetables, respectively. |
| Incorrect analysis | High risk | Clustering not accounted for in analysis. 14 classrooms across 2 schools, analyses did not account for clustering because a small proportion of variability was attributed to clustering at the classroom level. |
| Compatibility with individually randomised RCTs | Unclear risk | No statement regarding this. |
| Overall risk of bias assessment | High risk | Most domains were at high risk of bias. |
Waters 2017.
| Study characteristics | ||
| Methods |
Trial name: Fun n healthy in Moreland! Study design: cluster‐RCT. Repeated cross‐sectional design for the collection and analysis of quantitative data. Intervention duration: 5‐year programme with 3.5‐year intervention period Length of follow‐up from baseline: baseline (2004–2005), midway (2007) and completion (2009). Differences in baseline characteristics: at baseline there were no observed differences between trial arms in the proportion of children with overseas‐born mothers, but the intervention arm had higher levels of maternal education, smaller family size and fewer possessing a healthcare card. At follow‐up there were no observed differences between trial arms in maternal or paternal education or the proportion of children with Australian‐born mothers. Smaller differences in family size, healthcare card and family employment status remained. At school level, the intervention arm had more schools from the religious sector and a smaller mean school size. Unit of allocation: schools were randomised using computer‐generated random numbers to either actively engage with the Fun n Healthy in Moreland! programme (intervention arm) or continue with normal school activities and programmes for healthy eating and PA (comparison arm). Unit of analysis Implementation outcomes: school Behavioural/health outcomes: child |
|
| Participants |
School type: primary schools, children aged 5–12 years Region: Moreland, Victoria, Australia Demographics/socioeconomic characteristics: the City of Moreland, a local government municipality (population of 135,205 in 2006) is located 8.5 km northwest of the central business district of Melbourne, in South Eastern Australia. Of the 31 Melbourne municipalities, this area ranked seventh in social disadvantage at the time of the study. Inclusion/exclusion criteria Inclusion Schools were eligible to participate in the study if they were located in the Moreland municipality and exclusively covered the primary (elementary) school‐aged group, aged 4–13 years (n = 36 schools). Exclusion:not reported Number of schools allocated Schools:24 schools (12 intervention, 12 control) Students:3222 students (1628 control, 1594 intervention) Numbers by trial group n (controls baseline) = 11 schools, 1588 students n (controls follow‐up) = 10 schools, 1460 students n (interventions baseline) = 12 schools, 1579 students n (interventions follow‐up) = 12 schools, 1346 students Recruitment Schools:all 37 school principals of primary schools in the Moreland municipality were contacted by telephone by the Research Project Manager (LGi) and invited to participate in the study. Students:all children attending the consenting schools and their parent/guardian were invited to participate. Recruitment rate Schools:65% Students:recruitment/consent rate within schools was 38.6–64.3%. |
|
| Interventions |
Number of experimental conditions: 2 (1 intervention, 1 control) Policies, practices or programmes targeted by the intervention ‐ Programme to focus on increasing fruit, vegetable and water consumption, increasing PA and encouraging positive self‐esteem in children not explicitly stated. ‐ Policies targeted within the intervention included canteen policy, PA policy and nutrition policy. Implementation strategies EPOC: tailored interventions Customised development of intervention programme strategies. Theoretical underpinning ‐ Of the evidence‐based intervention/policy/practice or programme: not reported ‐ Of the implementation strategy: the design and implementation of the intervention was underpinned by the World Health Organization Health Promoting Schools Framework. Description of control: continue with normal school activities and programmes for healthy eating and PA (comparison arm). |
|
| Outcomes |
Outcome relating to the implementation of school policies, practices or programmes Implementation of PA and healthy eating practices directed at students, parents and staff. Data collection method Schools were asked to indicate if they had a written policy relating to PA and the canteen. As part of the intervention process, many of the schools chose to expand their canteen policy to include a broader school‐wide healthy eating policy to include strategies such as healthy fundraising, drink water policies and replacement of confectionery as in‐class rewards. School reported audit of the school food and PA environment, including PA facilities, canteen and fundraising policies and practices. Observational measure used was SOPLAY (System for Observing Play and Leisure Activity in Youth) based on momentary time sampling techniques using systematic and periodic scans of individuals and contextual factors within predetermined target areas. The instrument permits comparison of PA levels in different play environments. Validity of measures used: SOPLAY was validated. Other measures were not reported. Outcome relating to cost ‐ Costing of the resources invested in the intervention, including the Community Development Workers salaries, school resources and parent expenses was also undertaken. ‐ Cost of changes to school environment: not reported ‐ Data collection: process evaluation using monitoring maps, photos and audits to track and record changes in school plans, policies and environment, stability of changes, costs of changes, and level of independence from the research team. ‐ Validity not reported Outcome relating to adverse consequences ‐ Child quality of life: not reported ‐ Data collection: child‐report through child questionnaire of quality of life using the 10‐item version of the international self‐reported measure of quality of life, KidScreen. ‐ Validity: assumed to be valid measure, not reported though. Outcome relating to child diet, PA or weight status ‐ Child anthropometry (i.e. BMI z‐score and waist circumference) (primary) ‐ Fruit and vegetable intake and sweet drink consumption (secondary) ‐ Participation in PA and sedentary behaviour (secondary) Data collection method ‐ BMI z‐score calculated using direct measure of child height and weight to generate BMI, and then z‐scores against the World Health Organization reference curves. Project staff were trained in standardised child height and weight measurement, and a process developed that was sensitive, confidential and avoided value judgements. Weight in light clothing without shoes was recorded to the nearest 0.1 kg. ‐ Using digital scales and height to the nearest 0.5 cm using rigid stadiometers. All measures were taken twice and the mean value used. Where 2 readings differed by > 0.4 kg or 4 cm, a third reading was taken and the 2 closest values used to calculate the mean. ‐ Height and weight measured. ‐ Child and parent report though questionnaire assessing food behaviours and family food habits, respectively, lunch box audit and 24‐hour food record. ‐ Child and parent report of PA/sedentary behaviour. Validity of measures used: not reported |
|
| Notes |
Research funding: Victorian State Government as part of the Go For Your Life Campaign. The collaboration of schools. Conflicts of interest: authors CA and MT were employed by Merri Community Health Services at the time of the study. The authors had no other financial or non‐financial competing interests to declare. |
|
| Risk of bias | ||
| Bias | Authors' judgement | Support for judgement |
| Random sequence generation (selection bias) | Low risk | Schools were randomised using computer‐generated random numbers to either the intervention or comparison arm. The randomisation allocator was blind to school status. |
| Allocation concealment (selection bias) | Low risk | Participants could not foresee blinding given randomisation was computer generated and conducted by a blind allocator. |
| Blinding of participants and personnel (performance bias) Implementation outcome | High risk | Outcome group: implementation, student PA and diet. The nature of the study precluded blinding. Outcome: child BMI Low: objectively measured. |
| Blinding of outcome assessment (detection bias) Implementation outcome | High risk | Outcome group: implementation outcome, child PA and diet High: likely principals knew the outcome of interest given they were asked directly about it and were not blind to allocation. Outcome group: school audit and BMI Low: given it is objective data |
| Incomplete outcome data (attrition bias) Implementation outcome | Low risk | Outcome group: school audits. Data appeared available for all schools. Outcome: BMI Low: loss to follow‐up even across groups and < 10%. ITT analysis used. |
| Selective reporting (reporting bias) | Unclear risk | Protocol registered. Unclear as there were additional outcomes in this manuscript that were not reported in the protocol registration (i.e. principal reported barriers and facilitator). |
| Other bias | Unclear risk | May have been at risk of contamination. |
| Recruitment to cluster | High risk | Baseline data collection occurred prior to randomisation; however, they re‐consented at each data point for follow‐up evaluations. |
| Baseline imbalance | High risk | Baseline imbalance appeared to exist. There are also imbalances in the follow‐up groups. At baseline there were no observed differences between trial arms in the proportion of children with overseas‐born mothers, but the intervention arm had higher levels of maternal education, smaller family size and fewer possessing a healthcare card. At follow‐up, there were no observed differences between trial arms in maternal or paternal education or the proportion of children with Australian‐born mothers. Smaller differences in family size, healthcare card and family employment status remained. At school level, the intervention arm had more schools from the religious sector and a smaller mean school size. |
| Loss of cluster | High risk | Loss of 2 schools (from comparison group) by the completing of follow‐up. |
| Incorrect analysis | Low risk | School data were presented as proportions. Descriptive statistical analyses of school policies, environments and practices were undertaken using school questionnaire data. |
| Compatibility with individually randomised RCTs | Unclear risk | Unclear, no statement regarding this. |
| Overall risk of bias assessment | High risk | Most domains were at high risk of bias. |
Whatley Blum 2007.
| Study characteristics | ||
| Methods |
Trial name: no trial name Study design: non‐randomised Intervention duration: 1 year Length of follow‐up from baseline: approximately 1 year between baseline and follow‐up data collection spring 2004 (baseline data collection) to spring 2005 (follow‐up data collection). Recruitment date not provided. Differences in baseline characteristics: intervention schools had more students eligible for free/reduced‐price meal (32.9%) compared to controls (20.0%). Unit of allocation: school Unit of analysis: school |
|
| Participants |
School type: public high schools Region: Maine, USA Demographic/socioeconomic characteristics: % students eligible for free/reduced‐price meal: control = 20.0%, intervention = 32.9%. No further details of student demographics provided. Inclusion/exclusion criteria Inclusion ‐ Participation in NSLP. ‐ Offered an à la carte programme. ‐ Have ≥ 1 snack and 1 beverage vending machine accessible to students. Exclusion: not provided Number of schools allocated: 7 Numbers by trial group n (controls baseline) = 3 n (controls follow‐up) = 3 n (interventions baseline) = 4 n (interventions follow‐up) = 4 Recruitment: electronic informational letter sent from the Maine Department of Education to all 150 superintendents. 50 Interested schools were screened by telephone. Recruitment rate: 7 schools expressed interest and met inclusion criteria (denominator unknown). |
|
| Interventions |
Number of experimental conditions: 2 (1 intervention, 1 control) Policies, practices or programmes targeted by the intervention Implementing low‐fat, low‐sugar and portion‐controlled guidelines in à la carte and vending (snack and beverage) programmes. Implementation strategies EPOC: educational outreach visits ‐ Visits by research staff to each school's food and beverage supplier to identify items that met the low fat, low sugar guidelines. EPOC: educational materials ‐ Suppliers who stocked vending machines were given lists of the available low fat, low sugar items (expected to stock from the autumn 2004) and letters sent home to parents and students informing them of changes incentives. Banners were also displayed to promote healthier foods and taste testing was conducted. EPOC: clinical practice guidelines ‐ Modification of recipes and preparation techniques by research and food service personnel. EPOC: procurement and distribution of supplies ‐ Food service directors were given lists of available products/vendors that met low fat, low sugar guidelines. EPOC: educational meetings ‐ Presentations describing low fat, low sugar guideline made to school administrations, faculty, staff or a combination of these. EPOC: external funding ‐ USD1500 allocated annual to school liaison personnel. EPOC: local consensus process ‐ A committee at each school site was created. A liaison identified at each school was responsible for establishing the committee to promote the healthy changes in the vending machines and à la carte menus at their schools. Expectations for the committees were discussed in detail with each school liaison; these expectations included recruitment of representatives from all stakeholder groups — school administration, faculty, students, parents and food service personnel — and the completion of ≥ 4 activities over the course of the school year to promote the healthy changes. EPOC: other ‐ Early communication between the project team and schools began in 2004 as a means to obtain the co‐operation of school administration, and meet food service personnel. Theoretical underpinning: not reported Description of control: made no changes to à la carte and vending machine programmes for 1 school year. |
|
| Outcomes |
Outcome relating to the implementation of school service policies, practices or programmes ‐ % items meeting nutrient (low fat, low sugar) criteria in à la carte ‐ % items meeting nutrient (low fat, low sugar) criteria in snack vending ‐ % items meeting nutrient (low fat, low sugar) criteria in beverage vending ‐ % items meeting nutrient (low fat, low sugar) AND proportion criteria in à la carte ‐ % items meeting nutrient (low fat, low sugar) AND proportion criteria in snack vending ‐ % items meeting nutrient (low fat, low sugar) AND proportion criteria in beverage vending Data collection method: trained personnel visited the school on 5 consecutive non‐randomised days at baseline and follow‐up. Observation and recording of items sold was taken at breakfast and lunch at cafeterias. Vending machine data included: number of machines, items and nutritional information completed on the same day as nutritional observation. Validity of method: not reported; however, methods considered objective Outcome relating to cost: not reported Outcome relating to adverse consequences: not reported Outcome relating to child diet, PA or weight status: consumption of sugar sweetened beverages Data collection method: food frequency questionnaire: subjects were asked to complete the youth food frequency questionnaire for what they ate and drank over the past 30 days. Validity of method: the youth food frequency questionnaire has been shown to be valid in youth (defined as 9–18 years of age) with mean correlation of r = 0.49 for food groups from the youth food frequency questionnaire compared with 3 × 24‐hour recalls. |
|
| Notes |
Research funding: grant from the CDC (03022). Conflicts of interest: not reported |
|
| Risk of bias | ||
| Bias | Authors' judgement | Support for judgement |
| Random sequence generation (selection bias) | High risk | Non‐randomised design. High risk of selection bias as high schools volunteered into the intervention or control group. |
| Allocation concealment (selection bias) | High risk | Non‐randomised design. High schools volunteered into an experimental group, therefore, high risk of bias as no concealment of allocation. |
| Blinding of participants and personnel (performance bias) Implementation outcome | High risk | Outcome group: high schools volunteered as intervention or control, therefore, participants and personnel were not blind to allocation and there was a high risk of performance bias. |
| Blinding of outcome assessment (detection bias) Implementation outcome | Unclear risk | Outcome group: trained personnel visited each school to conduct observations. There was no information provided about whether these personnel were blinded to group allocation (i.e. may have conducted observations only and be unaware of the purpose of the study) and, therefore, the risk of detection bias was unclear. |
| Incomplete outcome data (attrition bias) Implementation outcome | Low risk | Outcome group: no schools dropped out and this study conducted observations of à la carte and vending programmes in schools. |
| Selective reporting (reporting bias) | Unclear risk | No study protocol, therefore, it was unclear if there was selective outcome reporting. |
| Other bias | Low risk | Appeared free from other bias. |
| Potential confounding | Unclear risk | The characteristics of the school and food environments were presented for the control and intervention groups (i.e. number of students, percentage of students eligible for free/reduced‐price meal, closed campus policy during lunch, offered à la carte breakfast). However, given this was a quasi‐experimental trial with no random allocation, it was unclear if all potential confounders were measured. |
| Overall risk of bias assessment | Unclear risk | Most domains were at low or unclear risk of bias. |
Wolfenden 2017.
| Study characteristics | ||
| Methods |
Trial name: no trial name Study design: cluster‐RCT for implementation outcome Intervention duration: 12–14 months Length of follow‐up from baseline: to assess the primary trial outcome, data were collected at baseline (April to September 2013) and at the completion of the implementation period (November 2014 to April 2015). Differences in baseline characteristics: there were no significant differences in baseline characteristic among schools. Unit of allocation: schools Unit of analysis: schools |
|
| Participants |
School type: primary schools Region: Hunter region of NSW, Australia Demographic/socioeconomic characteristics: the trial region contained a socioeconomically diverse group. Inclusion/exclusion criteria: schools from the study region were randomly selected and invited to participate. Inclusion ‐ Schools were required to have an operational canteen. ‐ ≥ 1 items on their canteen menu that was restricted for sale ('red' or 'banned') or < 50% of menu items classified as healthy ('green' items). Exclusion ‐ Non‐government schools ‐ Schools with both primary and secondary students ‐ Schools catering exclusively for children requiring specialist care Number of schools allocated: 70 Numbers by trial group n (controls baseline) = 35 n (controls follow‐up) = 30 n (interventions baseline) = 35 n (interventions follow‐up) = 27 Recruitment: recruitment continued until 70 schools provided consent for study participation. Recruitment rate: 88% |
|
| Interventions |
Number of experimental conditions: 2 (1 intervention, 1 control) Policies, practices or programmes targeted by the intervention The NSW Government launched a Healthy School Canteen Strategy (also known as Fresh Tastes @ School) to help prevent childhood obesity. The strategy classified foods sold by schools as 'red', 'amber' or 'green' based on their nutritional content. The strategy was adopted as policy by the government education department, and all government schools were mandated to remove items classified as 'red' from regular sale. Furthermore, schools were encouraged to 'fill the menu' with items classified as 'green' and ensure items classified as 'amber' did not dominate the menu. The primary aim of this study was to assess the effectiveness of a multi‐strategic intervention to increase implementation of the state‐wide healthy canteen policy. Implementation strategies EPOC: audit and feedback ‐ Performance monitoring and feedback menu reviews were conducted quarterly (unless menus were unchanged), and the results were used to compile written feedback reports to the canteen manager and school principal. Verbal discussion of the reports occurred during academic detailing visits or via telephone support calls. EPOC: continuous quality improvement ‐ Policy implementation support schools were allocated a support officer with qualifications in nutrition and dietetics and experience in supporting schools to implement the policy. Support officers contacted canteen managers every 2 months (via email, telephone or in person) throughout the intervention and used a continuous quality improvement framework of repeated goal setting, action planning, self‐monitoring and problem‐solving with canteen managers. EPOC: external funding ‐ Schools were also offered a small reimbursement to cover the costs associated with canteen manager attendance at training. EPOC: education materials ‐ Tools and resources – printed instructional materials, sample policies/menus, planning templates, pricing guides, product lists of policy compliant menu items, supplier contacts and menu assessment feedback were provided to all school canteen managers during the workshop or mailed to non‐attenders of the workshop. EPOC: education meeting ‐ Canteen managers, canteen staff and parent representatives were invited to attend a training workshop (5 hours) with the aim of providing education and skill development in the policy, nutrition and food label reading, canteen stock and financial management, pricing and promotion, and change management. Training combined didactic and interactive components including opportunities for self‐assessment, role play and facilitator provided feedback. Training was facilitated by a support officer. EPOC: education outreach visits ‐ School canteen visits were conducted 1 and 3 months after canteen manager training to enable support officers to observe the operational canteen environment, provide feedback and assist with problem‐solving barriers to policy implementation EPOC: local consensus process ‐ Meetings between support officers and canteen staff were held to discuss and reach consensus regarding the policy, how best to implement it and to develop local canteen action plans to co‐ordinate implementation tasks. EPOC: local opinion leader ‐ Executive support school principals were asked to communicate support for policy implementation and maintenance to teachers, parents, students and canteen managers during staff meetings, in newsletters and assemblies. Support officers also sought meetings with the executive of parent representative groups to garner their support for and input on policy implementation. EPOC: tailored intervention ‐ Individualised goal setting, action planning with canteen managers at different schools EPOC: other ‐ Quarterly project newsletters communicated key messages, provided information and case studies of successful implementation approaches to common barriers. ‐ Recognition schools with a menu assessed as adhering to the policy (i.e. > 50% 'green' items and no 'red' or 'banned' items) received a congratulatory letter and telephone call from the research team and were publicly acknowledged via marketing strategies. ‐ Canteen managers also received kitchen equipment to the value of AUD100. Theoretical underpinning: the selection of intervention components was guided by the Theoretical Domains Framework. Description of control: no contact was made, and no resources provided to control schools during the intervention period by the research team. |
|
| Outcomes |
Outcome relating to the implementation of school service policies, practices or programmes ‐ The proportion of schools with a canteen menu that did not contain foods or beverages restricted for sale ('red' and 'banned') under the policy. ‐ The proportion of schools where healthy canteen items ('green items') represented > 50% of listed menu items. Data collection method: copies of canteen menus were collected from all participating schools and audited by 2 dietitians independently. Validity of method: not reported yet objective. Outcome relating to cost: not reported Outcome relating to adverse consequences: as a measure of potential adverse effects yearly income and expenditure of canteen profitability were calculated. Data collection method: canteen's financial records. Validity: objective Outcome relating to child diet, PA or weight status: mean (95% confidence intervals) energy, total fat and sodium of student purchases. Data collection method: direct observation Validity of method: objective |
|
| Notes |
Research funding: Australian Research Council who provided funding for the trial [LP130101008]. In‐kind support was provided by the Hunter New England Population Health and the Hunter Medical Research Institute. Conflicts of interest: authors reported grants from Australian Research Council Linkage Project Scheme (LP130101008) during the conduct of the study; no financial relationships with any organisation that might have had an interest in the submitted work in the previous 3 years; and no other relationships or activities that could appear to have influenced the submitted work. |
|
| Risk of bias | ||
| Bias | Authors' judgement | Support for judgement |
| Random sequence generation (selection bias) | Low risk | RCT. Random sequence generated using a random number function in Microsoft Excel. |
| Allocation concealment (selection bias) | Unclear risk | No information provided about allocation concealment and, therefore, it was unclear if allocation was concealed. |
| Blinding of participants and personnel (performance bias) Implementation outcome | High risk | Outcome group: all outcomes (including adverse events) School staff (principals and canteen managers) were not blinded to group allocation. Cost data: collected retrospectively: low |
| Blinding of outcome assessment (detection bias) Implementation outcome | Low risk | Outcome group: data collectors were blinded to group allocation. Cost data: collected retrospectively: low |
| Incomplete outcome data (attrition bias) Implementation outcome | Low risk | Outcome group: all outcomes 13/70 (19%) schools did not provide their menu for assessment at follow‐up. There were no significant differences in baseline characteristics among schools that did and did not provide follow‐up data. Analyses of study outcomes were performed under an ITT framework. Cost data: no loss to follow‐up |
| Selective reporting (reporting bias) | Low risk | There were no unreported implementation outcomes according to those planned in the published protocol. Cost data: retrospective economic analysis: unclear |
| Other bias | Low risk | Appeared free from other bias. |
| Overall risk of bias assessment | Low risk | Most domains were at low risk of bias. |
Yoong 2016.
| Study characteristics | ||
| Methods |
Trial name: CAFÉ Study design: cluster‐RCT for implementation outcome Intervention duration: 12 months Length of follow‐up from baseline: to assess the primary trial outcome, data were collected at baseline (February–October 2013) and follow‐up (September 2014 to January 2015). Differences in baseline characteristics: no differences in the baseline characteristics of participating schools in the intervention and control group were apparent. Unit of allocation: schools Unit of analysis: schools |
|
| Participants |
School type: primary schools Region: the study was conducted in the Hunter New England Local Health District of NSW, Australia. Demographic/socioeconomic characteristics: study region consisted of a socioeconomically and demographically diverse population of approximately 112,000 children aged 5–12 years. Inclusion/exclusion criteria Inclusion ‐ Rural or remote primary schools within areas within the study region. ‐ Having a canteen open ≥ 1 day per week. ‐ Were not compliant with the NSW Healthy School Canteen Policy, defined as either having ≥ 1 canteen menu item restricted for sale ('red' or 'banned' item) or having < 50% of menu items classified as healthy ('green' items) (based on dietitian assessment of the supplied canteen menu). Exclusion ‐ Schools enrolling both primary and secondary students. ‐ Schools catering exclusively for children requiring specialist care. Number of schools allocated: 72 Numbers by trial group n (controls baseline) = 36 n (controls follow‐up) = 24 n (interventions baseline) = 36 n (interventions follow‐up) = 29 Recruitment: 72 schools Recruitment rate: 64% |
|
| Interventions |
Number of experimental conditions: 2 (1 intervention, 1 control) Policies, practices or programmes targeted by the intervention As part of the NSW obesity prevention strategy in 2005 the State Government introduced the NSW Healthy School Canteen Policy called 'Fresh Tastes @ School'. The policy was based on the 2003 Australian Dietary Guidelines and utilises a traffic light system to classify menu items as 'red', 'amber' or 'green' based on their nutritional profile (including energy, saturated fat, salt, or a combination of these). 'Red' items are typically nutrient poor, high‐energy foods; 'amber' items are considered to have some nutritional value; however, if consumed in large amounts can contribute to excess energy intake, and 'green' items are those that are considered to be good sources of nutrients, such as fruit, vegetables and lean meats. The 'Fresh Tastes @ School' policy requires that schools: provide primarily 'green' items (> 50% of the menu) and restrict the sale of 'red' foods and remove 'banned' drinks. Government primary schools are mandated to implement the policy, while implementation amongst non‐government schools is strongly encouraged. The efficacy of the intervention (implementation) strategies to facilitate the implementation of the 'Fresh Tastes @ School' policy were tested in this trial. Implementation strategies EPOC: audit and feedback ‐ Menu audit: a dietitian who was blind to group allocation and not involved in the delivery of the intervention undertook audits of the canteen menus using a standardised template based on the 'Fresh Tastes @ School' policy. Canteen managers were requested to provide a copy of their menu and additional information needed to assess menu compliance with the 'Fresh Tastes @ School' policy (as described above). Additional telephone contact was made by the dietitian as needed to obtain all necessary information to classify menu items as 'red', 'banned', 'amber' and 'green' according to the policy. Subsequent menu audits were planned for each term (4 over a 12‐month period) with verbal and written feedback (described below) provided after each audit. Feedback report ‐ Dietitians developed a standard feedback report template which summarised whether or not the school menu complied with the 'Fresh Tastes @ School' policy. The feedback report was delivered via email or mail by a member of the health promotion team, depending on individual school preference. The report graphically displayed the proportion of 'red', 'banned', 'amber' and 'green' items on the menu and outlined the school's compliance with the 'Fresh Tastes @ School' policy. Specific suggestions on how to change canteen menus to meet the requirements of the 'Fresh Tastes @ School' policy were provided including: healthy recipes, ideas about how to increase the number of 'green' items on their menu, and alternative food options to replace specific 'red' foods or 'banned' drinks. The health promotion staff also provided other useful resources based on canteen managers' reported requirements, as assessed during the feedback calls (described below in 'Resources'). EPOC: continuous quality improvement ‐ Feedback calls: during the initial feedback call, the Health Promotion Officer reiterated the purpose of the report, discussed the results, clarified any unclear components, supported the canteen manager to undertake a goal‐setting process to identify key areas for improvement in order to improve compliance with the 'Fresh Tastes @ School' policy, and developed an action plan to overcome existing barriers to policy compliance. In all subsequent calls (2–4), the Health Promotion Officer tailored the discussion to the needs of the Canteen Manager based on previous contact; and monitored their actions and progress toward their goals, set new goals where required, or monitored compliance. Where possible, the same Health Promotion Officer provided support to the same school throughout the intervention period. 2/5 Health Promotion Officers had qualifications in nutrition and dietetics; however, all support officers received the same training in implementing strategies to support organisational change processes and intervention delivery. EPOC: education materials ‐ All intervention schools were provided with 'Fresh Tastes @ School' resources (including a Canteen Menu Planning guide, recipes, and a manual on financial management and food safety), healthy food guidelines, a menu planning template, sample policies and menus, pricing guides and a local suppliers buyer's guide which lists foods that meet the 'amber' and 'green' criteria, developed by a state nutrition agency which provides canteen support to their member schools (Healthy Kids Association). EPOC: tailored intervention ‐ The specific number of menu audits, feedback reports and calls provided was tailored depending on each school's compliance with the guidelines and whether menu changes had occurred between the previous and planned menu audit; and the responsiveness of the canteen manager to the feedback (e.g. whether they declined to take feedback calls). Theoretical underpinning The selection of specific canteen manager behaviour change techniques was based on Control Theory, which has previously been applied to audit and feedback interventions in healthcare settings. The theory suggests that the key behaviour change techniques to target knowledge gaps and skill barriers include: feedback on current performance, goal setting to allow comparison between current and target performance, and development of action plans to support target attainment. Description of control: usual practice: schools in the control group received the standard offer of professional development opportunities provided through the NSW Government's Live Life Well @ School initiative. No support to implement the Fresh Tastes @ School was specifically provided by the local health promotion unit. |
|
| Outcomes |
Outcome relating to the implementation of school service policies, practices or programmes ‐ Proportion of schools having a canteen menu that did not contain any 'red' foods or 'banned' drinks ‐ Proportion of schools having a canteen menu that contained > 50% 'green' items as specified by the 'Fresh Tastes @ School' policy Data collection method ‐ Menu audits were used to assess the primary trial outcome. Canteen managers were asked to supply their current canteen menu and participate in follow‐up telephone calls from dietitians to collect additional information required to assess menu compliance. If additional information was required to classify a menu item according to the policy, dietitians collected additional product information from canteen managers via phone or email using a standard data collection template. Validity of measure: not reported/contained both objective assessments and self‐reports Outcome relating to cost: not reported Outcome relating to adverse consequences: not reported Outcome relating to child diet, PA or weight status: not reported |
|
| Notes |
Research funding: in‐kind funding was received by Hunter New England Population Health to support conduct of the trial. Some authors were Postdoctoral Research Fellows funded by the National Heart Foundation and the National Health and Medical Research Council Career Statistical support was funded by the Priority Research Centre for Health Behaviour. Conflicts of interest: authors declared that they had no competing interests. |
|
| Risk of bias | ||
| Bias | Authors' judgement | Support for judgement |
| Random sequence generation (selection bias) | Low risk | RCT. Random sequence was produced using a computer‐generated randomisation schedule in Microsoft Excel. |
| Allocation concealment (selection bias) | Unclear risk | No information provided about allocation concealment and, therefore, it was unclear if allocation was concealed. |
| Blinding of participants and personnel (performance bias) Implementation outcome | High risk | Outcome group: due to the nature of the intervention, schools could not be blinded to group allocation and, therefore, were at high risk of performance bias. Cost data: collected retrospectively: low |
| Blinding of outcome assessment (detection bias) Implementation outcome | Low risk | Outcome group: menu audits were undertaken by dietitians blinded to group allocation. Cost data: unclear if data collector knew group allocation. |
| Incomplete outcome data (attrition bias) Implementation outcome | Low risk | Outcome group: 19/72 (26%) schools did not provide menus at follow‐up. There were no significant differences in baseline characteristics among schools that did and did not provide follow‐up data. Cost data: no loss to follow‐up. |
| Selective reporting (reporting bias) | Low risk | There were no unreported implementation outcomes according to those planned in the published protocol. Cost data: retrospective economic analysis: unclear |
| Other bias | Low risk | Appeared free from other bias. |
| Overall risk of bias assessment | Low risk | Most domains were at low risk of bias. |
Young 2008.
| Study characteristics | ||
| Methods |
Trial name: Trial of Activity for Adolescent Girls (TAAG) Study design: cluster‐RCT Intervention duration: 2‐year study‐directed intervention (autumn 2003 to spring 2005). A third‐year intervention used school and community personnel to direct intervention activities. Length of follow‐up from baseline: 2 years. Differences in baseline characteristics: the study population was diverse with the largest percentage of African American girls in Louisiana and South Carolina and the largest percentage of Hispanic girls in California and Arizona. Differences between groups at baseline were not presented. Unit of allocation: schools Unit of analysis: classrooms and schools |
|
| Participants |
School type: middle schools Region: TAAG was conducted at 6 university‐based field sites representing diverse geographic locations and populations: Universities of Arizona, Maryland, Minnesota and South Carolina, San Diego State University and Tulane University. Demographic/socioeconomic characteristics: not reported Inclusion/exclusion criteria Inclusion ‐ Public middle schools (grades 6–8) were eligible if the majority of children enrolled lived in the community served by the school, so that the community component of the intervention would be relevant to them. Exclusion ‐ Schools were unwilling or unable to respond to and report medical emergencies during the trial ‐ Planned to close or merge within 3 years ‐ < 90 girls in the eighth grade ‐ Expected transience of > 38% in any given year or 35% over 2 years ‐ Did not offer PE each semester for all grades ‐ < 2 (year‐round schools) or 3 (semester‐based schools) PE classes per week ‐ Participation in pilot testing of the study materials. ‐ Student exclusions included unable to read or understand questions in English, been told not to participate in or avoid exercise for health reasons, or have an existing medical condition; parent unwilling or unable to give consent; girls unwilling to assessment measurement. Number of schools allocated: 36 Numbers by trial group n (controls baseline) = 18 n (controls follow‐up) = 18 n (interventions baseline) = 18 n (interventions follow‐up) = 18 Note: all 36 schools participated in the sixth‐grade measurements during spring 2003 and in the eighth‐grade measurements during spring 2005; however, only 34 schools participated in the eighth‐grade measurements during spring 2006. Recruitment Schools: 6 schools were recruited at each of the 6 field centres (36 schools in total). Of the 68 schools invited to participate, 41 agreed and the 36 most conveniently accessed from the university‐based research centres were selected. Students: in each of 36 schools (6 per field centre), 60 randomly selected sixth‐grade girls were invited at baseline to be measured with a goal of measuring ≥ 80% (48) of those girls. At the end of the 2‐year intervention (endpoint) and in the subsequent year (follow‐up), 120 randomly selected eighth‐grade girls per field centre will be invited to participate in the measurements. Recruitment rate Schools: of the 68 schools invited to participate, 41 agreed (60%) and the 36 most conveniently accessed from the university‐based research centres were selected. Students:during spring 2003, 60 girls per school were randomly chosen. 1721/2160 (79.7%) eligible girls consented and participated in the measurement. During spring 2005, 4123 girls were eligible for the student‐level measurements, and 3504 (85.0%) consented and participated in the measurements. During spring 2006, 3915 were eligible at the 6 study sites, and 3502 (89.5%) consented and participated in the measurements. The approximate doubling of the number of girls measured in each eighth‐grade survey compared to the sixth‐grade survey was purposeful and based on their determination that the smaller sixth‐grade sample would have little adverse effect on power. |
|
| Interventions |
Number of experimental conditions: 2 (1 intervention, 1 control) Policies, practices or programmes targeted by the intervention Adaptation of PE classes to meet TAAG objectives and implementation of health education lessons were assessed through structured observations throughout the academic year by TAAG staff and teacher surveys at the end of the school year (dose, fidelity and acceptability). Implementation strategies EPOC: education meetings ‐ Health education, PE, science or homeroom teachers attended workshops to teach a series of 6 lessons that promoted development of behavioural skills associated with PA. Each health education lesson included an activity challenge (i.e. homework) in which students monitored a behaviour and set goals to increase their activity. EPOC: education materials ‐ PE teachers received instructional materials for PE lessons; social marketing efforts that included posters, flyers and special activities were launched to encourage overall PA and promote TAAG‐specific programmes to students. EPOC: educational outreach visits ‐ PE teachers received regular on‐site support to conduct lessons that encouraged active participation of girls during PE classes and to promote out‐of‐class PA. EPOC: interprofessional education ‐ Collaborations were created between schools, community agencies and TAAG university staff to increase girl‐focused PA programmes outside of PE classes. EPOC: local opinion leaders ‐ Programme champions were recruited and trained during the second intervention year, and they directed the intervention to enhance its sustainability in the third year. EPOC: local consensus processes ‐ Intervention goals were identified to indicate optimal intervention implementation. Goals varied by component, but essentially were set for 100% fidelity for delivery of the intervention by TAAG staff to teachers and 80% fidelity for delivery by teachers to the students. Theoretical underpinning: social‐ecological model, Operant Learning Theory, Social Cognitive Theory, organisational change and diffusions of innovation. Description of control: not reported but assume usual practice. |
|
| Outcomes |
Outcome relating to the implementation of school policies, practices or programmes Continuous ‐ Average number of PA programmes Dichotomous ‐ Students were encouraged for out‐of‐PE‐class PA (percentage of classes) ‐ Teacher used strategies to minimise management time (% classes) ‐ Students were provided with choices (percentage of classes) ‐ Students were encouraged for in‐class PA (% classes) ‐ Student equipment ratio was appropriate for activity (% classes) ‐ Group sizes were appropriate for activity (percentage of classes) ‐ Percentage of school reporting collaborations Data collection method Implementation of TAAG PE Fidelity: measured by observation. Implementation variable was observed 'some', 'most' or 'all' of class. Intervention goal = observation of 50% for item 1, 80% for all other items. Collaboration: interview with principal. Average number PE programmes: measured by surveys of PA programme leaders at intervention and control schools. Validity of measures used: trial used a combination of objective and self‐report components to assess implementation outcome. The self‐report components were reported as validated. Outcome relating to cost: not reported Outcome relating to adverse consequences: not reported Outcome relating to child diet, PA or weight status: PA and body composition Data collection method PA:assessed by accelerometer (daily MET weighted minutes of MVPA). Sedentary minutes were defined as the number of minutes with less than light activity. Anthropometry: BMI, height, weight and percentage body fat. Standing height was measured without shoes using a portable stadiometer (Shorr Productions) to the nearest 0.1 cm. Bodyweight was assessed using a digital scale (Seca 880) and measured to the nearest 0.1 kg while the girl was dressed in light clothing without shoes. Triceps skinfold thickness was measured in triplicate on the right side of the body to the nearest 0.1 mm. BMI was calculated as kg divided by height in metres squared. Percentage body fat was estimated from anthropometric measures using an equation that was developed for use in girls in this age range. Validity of measures used PA:not reported Anthropometry:valid |
|
| Notes |
Research funding: National Heart, Lung and Blood Institute; National Institutes of Health (U01HL66858, U01HL66857, U01HL66845, U01HL66856, U01HL66855, U01HL66853 and U01HL66852). Conflicts of interest: authors reported no conflicts of interest. |
|
| Risk of bias | ||
| Bias | Authors' judgement | Support for judgement |
| Random sequence generation (selection bias) | Unclear risk | Randomisation was stratified by field centre and by school district. Random sequence generation not described. |
| Allocation concealment (selection bias) | Unclear risk | No information provided about allocation concealment and, therefore, it was unclear if allocation was concealed. |
| Blinding of participants and personnel (performance bias) Implementation outcome | High risk | Outcome group: there was no mention that participants or personnel were blinded to experimental group and, therefore, were at high risk of performance bias. Outcome: child PA Low: objectively measured |
| Blinding of outcome assessment (detection bias) Implementation outcome | High risk | Outcome group: not reported that observers or participants were blind to group allocation. Outcome group: BMI and child PA (objective data) Low: blinding would not impact objective measure. |
| Incomplete outcome data (attrition bias) Implementation outcome | Low risk | Outcome group: low school attrition rate reported. All 36 schools participated in the measurements in 2003 and 2005 and 34 schools participated in 2006. No mention of ITT analysis in manuscripts. |
| Selective reporting (reporting bias) | Low risk | There were no unreported implementation outcomes according to those planned in the published protocol. |
| Other bias | Low risk | Did not appear to be at risk of contamination or other biases. |
| Recruitment to cluster | Low risk | Individuals within each randomised cluster participated. |
| Baseline imbalance | Low risk | Schools were randomly allocated to condition and so risk of baseline imbalance was low. |
| Loss of cluster | Low risk | 2/36 schools in Louisiana were closed due to damage from Hurricane Katrina. There was no mention though to which condition these were assigned. |
| Incorrect analysis | Low risk | All analyses took into account the expected positive intraclass correlation among responses for students, teachers and classes in the same school and school‐ or community‐level responses within the same site. |
| Compatibility with individually randomised RCTs | Unclear risk | Unable to determine if a herd effect existed. |
| Overall risk of bias assessment | Low risk | Most domains were at low risk of bias. |
3DPAR: 3‐Day Physical Activity Recall; AB: activity break; ANOVA: analysis of variance; BMI: body mass index; BSTS: Bihar School Teachers Study; CATCH: Child and Adolescent Trial for Cardiovascular Health; CDC: Centers for Disease Control and Prevention; df: degrees of freedom; DPA: daily physical activity; EPOC: Effective Practice and Organisation of Care; FARMS: free and reduced‐price meal; FRL: free/reduced price lunch; HNE: Hunter New England; HSAT: Healthy Schools Action Team; ITT: intention to treat; LEAP: Lifestyle Education for Activity Program; MET: Metabolic Equivalents of Task; MI: movement integration; MVPA: moderate to vigorous physical activity; n: number; NSLP: National School Lunch Program; NSW: New South Wales; PA; physical activity; PACE: Pilot of the Physically Active Children in Education; PAQ‐C: Physical Activity Questionnaire for Older Children; PE: physical education; PU30: Power Up for 30; RCT: randomised controlled trial; SAAFE: Supportive, Autonomous, Active, Fair, Enjoyable; SBP: School Breakfast Program; SCORES: Supporting Children's Outcomes using Rewards, Exercise and Skills; SEPS: School Environment and Policy Survey; SES: socioeconomic status; SHCP: Shaping Healthy Choices Program; SMART: Skills Management and Resistance Training; SNAK: School Nutrition Advances Kids; SOFIT: System for Observing Fitness Instruction Time; SOPLAY: System for Observing Play and Leisure Activity in Youth; SPARK: Sports, Play, and Active Recreation for Kids; TA: technical assistance; TAAG: Trial of Activity for Adolescent Girls; TACOS: Trying Alternative Cafeteria Options in Schools; TEENS: Teens Eating for Energy and Nutrition at School; TFS: Tobacco‐Free Society; TFT: Tobacco‐Free Teachers; WCC: Wellness Champions for Change.
Characteristics of excluded studies [ordered by study ID]
| Study | Reason for exclusion |
|---|---|
| ACTRN12619000431123 | Inappropriate outcomes |
| Cunningham‐Sabo 2016 | Protocol only (not associated with an included study) |
| Hodder 2012 | Inappropriate outcomes |
| Hoelscher 2001 | Did not report results of a trial |
| Hoelscher 2003 | No baseline data, non‐randomised |
| Hoelscher 2004 | No baseline data, non‐randomised |
| Hoelscher 2016 | Inappropriate outcomes |
| ISRCTN11867516 | Inappropriate outcomes |
| ISRCTN61188203 | Inappropriate outcomes |
| Kajons 2018 | Protocol only (not associated with an included study) |
| Kelder 2003 | No baseline data, non‐randomised |
| Kim 2012 | Inappropriate outcomes |
| Li 2010 | Inappropriate outcomes |
| Li 2014 | Inappropriate outcomes |
| Lubans 2005 | Inappropriate outcomes |
| Lubans 2010 | Inappropriate outcomes |
| Lubans 2014 | Inappropriate outcomes |
| Lubans 2015 | Inappropriate outcomes |
| NCT00061165 | No implementation outcome |
| Osganian 2003a | Non‐controlled study/inappropriate comparator |
| Prell 2005 | Inappropriate outcomes |
| Rissel 2012 | Inappropriate outcomes |
| Rosario 2013 | Inappropriate outcomes |
| Rosario 2016 | Inappropriate outcomes |
| Rosenbaum 2007 | Inappropriate outcomes |
| Rosenkranz 2012 | Inappropriate outcomes |
| Rothwell 2011 | Inappropriate outcomes |
| Rowlands 2008 | Inappropriate participants OR inappropriate setting |
| Rozi 2019 | Inappropriate outcomes |
| Ruzita 2007 | Inappropriate outcomes |
| Sallis 2003 | Inappropriate outcomes |
| Salmon 2005 | Inappropriate outcomes |
| Singhal 2010 | Inappropriate outcomes |
| Sirikulchayanonta 2011 | Non‐controlled study/inappropriate comparator |
| Smith 2001 | Did not report results of a trial |
| Smith 2015 | Non‐controlled study/inappropriate comparator |
| Somsri 2016 | Inappropriate outcomes |
| Sutherland 2016 | Inappropriate outcomes |
| Uys 2016 | Inappropriate outcomes |
| Velicer 2007 | Inappropriate outcomes |
| Vetter, 2015 | Inappropriate outcomes |
| Veugelers 2005 | Non‐controlled study/inappropriate comparator |
| Viggiano 2015 | Inappropriate outcomes |
| Volpe 2013 | Non‐controlled study/inappropriate comparator |
| Wang 2015 | Inappropriate outcomes |
Characteristics of ongoing studies [ordered by study ID]
Fernandez‐Jimenez 2019.
| Study name | The SI! Program for Secondary Schools |
| Methods | Study design: cluster‐randomised controlled intervention |
| Participants |
School type: secondary schools. Adolescents aged 12–16 years in grades 1–4 Region: Barcelona and Madrid |
| Interventions |
Number of experimental conditions: 3 (1 long intervention, 1 short intervention, 1 control) Policies, practices or programmes targeted by the intervention The intervention consists of teacher‐led computer‐based simulations and games (virtual trip) targeting the different age groups (grades 1–2 or 1–4). The minimum intervention load is 18 hours per year in the short‐term intervention group and 12 hours per year in the long‐term intervention group. The health challenge topics (healthy eating, physical activity and substance abuse avoidance) are integrated into the regular curricular subjects (science, PE, etc.) and are designed to stimulate a range of motivational pathways related to the diverse content through a shared methodology. Implementation strategies EPOC: audit and feedback ‐ Annual report EPOC: educational materials ‐ Newsletters EPOC: educational meetings ‐ Meetings between a co‐ordinator from the SHE Foundation and the designated health co‐ordinator, together with the other participating teachers at the school. ‐ A health day will be held in each academic year and will include participation of teachers, adolescents and families. ‐ Receive training in the promotion of cardiovascular health in the school setting. ‐ Health fair. |
| Outcomes |
Outcome relating to the implementation of childcare service policies, practices or programmes School principal will complete a survey containing questions related to recommendations made by the SI! Program. These questions will deal with the type of foods permitted on the school premises (including products offered in the cafeteria or vending machines), measures to promote active commuting to and from school (walking or cycling) and physical activity during recess, and conflict resolution. |
| Starting date | June 2017 |
| Contact information | Rosa M Lamuela‐Raventós, Associate Professor, University of Barcelona |
| Notes | Trial registration: NCT03504059 |
Haible 2019.
| Study name | GEKOS |
| Methods | Study design: cluster‐RCT |
| Participants |
School type: secondary schools; ninth grade students Region: Baden‐Wuerttemberg, Germany |
| Interventions |
Number of experimental conditions: 4 (2 intervention 2 waitlist control; control (CG‐run, CG‐game play) or the experimental conditions (IG‐run, IG‐game play). Policies, practices or programmes targeted by the intervention The study is designed to investigate the superiority of an intervention compared to a control condition. The 2 intervention programmes only differ in the type of PA that is carried out during these lessons; the run intervention involves running and jumping activities, while the game play intervention focuses on small‐sided games and football as well as handball drills. Implementation strategies EPOC: educational materials ‐ Manual and materials EPOC: educational meetings ‐ Teacher 2‐hour training |
| Outcomes |
Outcome relating to the implementation of childcare service policies, practices or programmes Intervention group teachers fill out the self‐report form which assesses intervention delivery of the different steps of the learning process, any deviations and potential incidents. Control group teachers also complete a self‐report form to record their class contents. |
| Starting date | 14 September 2017 |
| Contact information | Mr Prof Dr Gorden Sudeck, Institut für Sportwissenschaft der Eberhard Karls Universität Tübingen |
| Notes | Trial registration: DRKS00016349 |
Liu 2019b.
| Study name | The DECIDE‐Children study |
| Methods | Study design: cluster‐RCT |
| Participants |
School type: primary schools; grade 4 (aged 8–10 years) students Region: China (Beijing, Shanxi, and Xinjiang) |
| Interventions |
Number of experimental conditions: 2 intervention and control Policies, practices or programmes targeted by the intervention The DECIDE‐Children study aims to develop a school‐based, multi‐faceted childhood obesity prevention programme targeting school children aged 8–10 years in 3 different regions of China and rigorously test its effectiveness in preventing excessive weight gain in Chinese primary school settings. Implementation strategies EPOC: audit and feedback ‐ Review of phone app data with follow‐ups for those not complying with protocol. EPOC: educational materials ‐ Smartphone app. EPOC: educational meetings ‐ Health education activities for school staff. |
| Outcomes |
Outcome relating to the implementation of childcare service policies, practices or programmes School policies related to obesity prevention and management, which will be collected by the questionnaires in both the intervention and the control groups. |
| Starting date | September 2018 |
| Contact information | Hai‐Jun Wang, Peking University |
| Notes | Trial registration: NCT03665857 |
Lonsdale 2016.
| Study name | Scaling‐up an efficacious school‐based physical activity intervention: Study protocol for the 'Internet‐based Professional Learning to help teachers support Activity in Youth' (iPLAY) cluster randomized controlled trial and scale‐up implementation evaluation |
| Methods | Study design: 2 complementary studies will be conducted and evaluated alongside each other. |
| Participants |
School type: primary schools Region: NSW, Australia |
| Interventions |
Number of experimental conditions: 2 (1 intervention, 1 control) Policies, practices or programmes targeted by the intervention The programme targeted by the intervention is a modified version of the SCORES programme. SCORES was a comprehensive, multicomponent physical activity and fundamental movement skills programme for primary schools. The modified intervention centres around online delivery of professional learning to teachers. The modified intervention will be known as iPLAY (Internet‐based Professional Learning to help teachers to support Activity in Youth) and will be facilitated by various implementation strategies/interventions. Implementation strategies EPOC: audit and feedback ‐ Individualised mentoring to primary teachers and feedback EPOC: educational meetings ‐ Peer observations and group discussions EPOC: tailored interventions ‐ Prompts and self‐reflection ‐ Action plan EPOC: educational materials ‐ Online learning and resources ‐ Professional learning EPOC: other ‐ Rewards for teachers ‐ Social marketing |
| Outcomes |
Outcome relating to the implementation of childcare service policies, practices or programmes ‐ A range of implementation outcomes will be collected and may be appropriate for inclusion. |
| Starting date | Enrolments began: 13 June 2016 |
| Contact information | A/Prof Chris Lonsdale, Institute for Positive Psychology and Education, Australian Catholic University, Locked Bag 2002, Strathfield NSW 2135 |
| Notes | Trial registration: Australia and New Zealand Clinical Trials Registry (ACTRN12616000731493). Date of registration: 3 June 2016 |
Nathan 2019a.
| Study name | PACE |
| Methods | Study design: RCT |
| Participants |
School type: primary schools Region: NSW, Australia |
| Interventions |
Number of experimental conditions: 2‐ intervention and control Policies, practices or programmes targeted by the intervention: scheduling of mean minutes of PA by teachers Implementation strategies EPOC: educational materials ‐ Resources EPOC: educational meetings ‐ Face‐to‐face training EPOC: tailored interventions ‐ On‐going support via telephone and email and an online portal to support the implementation of the policy |
| Outcomes |
Outcome relating to the implementation of childcare service policies, practices or programmes The mean minutes of PA scheduled by primary school teachers across the school week measured via teachers' class timetable. Teachers will provide their weekly class schedule reporting the minutes of PA scheduled. Additionally, the mean minutes of class PA across the school week where > 50% of students within classes are engaged in moderate or vigorous PA. Total minutes of PA will be measured objectively using an accelerometer, worn by students in grade 2–3. |
| Starting date | 1 October 2017 |
| Contact information | Nicole Nathan, University of Newcastle |
| Notes | Trial registration: ACTRN12617001265369. |
Nathan 2019b.
| Study name | PACE non‐inferiority trial |
| Methods | Study design: – |
| Participants |
School type: primary schools; students 6–11 years Region: Australia |
| Interventions |
Number of experimental conditions: 2 (low‐intensity PACE intervention vs high‐intensity PACE (original)) intervention Policies, practices or programmes targeted by the intervention: implementation of PA intervention Implementation strategies EPOC: monitoring the performance of the delivery of healthcare ‐ Project officers further support policy implementation via ongoing distance communication EPOC: educational materials ‐ Resources: online portal, physical activity packs, example schedule, example policies, manuals EPOC: educational meetings ‐ Face‐to‐face meetings EPOC: local opinion leaders ‐ School champion |
| Outcomes |
Outcome relating to the implementation of childcare service policies, practices or programmes Adoption, reach and implementation will all be measured. |
| Starting date | 25 September 2018 |
| Contact information | Dr Nicole Nathan, Hunter New England Population Health |
| Notes | Trial registration: ACTRN12619001229167 |
Nathan 2020a.
| Study name | A randomised trial of an intervention to sustain primary schools' implementation of a state‐wide physical activity policy. |
| Methods | Study design: RCT |
| Participants |
School type: primary schools Region: Hunter New England, NSW, Australia |
| Interventions |
Number of experimental conditions: 2 intervention vs control (usual care) Policies, practices or programmes targeted by the intervention: sustainment of state‐wide PA policy Implementation strategies EPOC: monitoring the performance of the delivery of health care ‐ Executive support EPOC: educational materials ‐ Resources EPOC: educational meetings ‐ Face‐to‐face training ‐ Online training EPOC: other ‐ Peer teacher networks |
| Outcomes |
Outcome relating to the implementation of childcare service policies, practices or programmes The difference in mean weekly minutes of PA scheduled by primary school teachers at 12 and 24 months' follow‐up compared to baseline. Teachers will provide their weekly class schedule reporting the minutes of PA scheduled. |
| Starting date | 30 March 2020 |
| Contact information | Nicole Nathan, University of Newcastle |
| Notes | Trial registration: ACTRN12620000372987 |
Randby 2019.
| Study name | An implementation intervention to increase adherence to the Norwegian school food guideline |
| Methods | Study design: single‐centre hybrid implementation‐effectiveness trial with a pre–post non‐equivalent control group design |
| Participants |
School type: primary schools and after care schools Region: Oslo, Norway |
| Interventions |
Number of experimental conditions: unclear Policies, practices or programmes targeted by the intervention An implementation intervention consisting of information, training and locally conducted self‐evaluation workshops by appointed internal facilitators will improve adherence to the national guideline on food and meals in primary school and after school care. Implementation strategies EPOC: educational meetings ‐ Education meeting will provide information about the study, content and rationale of the current guideline, and allowing time for questions and discussion. ‐ Food ambassadors from each school with participate in 2 physical gatherings with information and training, each lasting for around 3 hours. ‐ Food ambassadors will conduct worships with staff. ‐ Training of the after‐school care leader. EPOC: local opinion leaders ‐ Food ambassador. |
| Outcomes | Outcome relating to the implementation of childcare service policies, practices or programmes: adherence to the guideline |
| Starting date | 25 April 2019 |
| Contact information | Public sector PhD Candidate Jorunn Sofie Randby Email: Jorunn.Sofie.Randby@helseidr.no |
| Notes | Trial registration: ISRCTN12683953 |
Sutherland 2019.
| Study name | Physical Activity 4 Everyone (PA4E1) program |
| Methods | Study design: RCT |
| Participants |
School type: secondary schools, grades 7–10 Region: low‐income communities |
| Interventions |
Number of experimental conditions: 1 intervention and 1 control (control received a lower dose of the intervention) Policies, practices or programmes targeted by the intervention: aimed at reducing physical inactivity, overweight and obesity Implementation strategies EPOC: clinical incident reporting ‐ Received support from health district staff for the duration of the intervention EPOC: educational materials ‐ Resources EPOC: educational meetings ‐ Face‐to‐face training/online training EPOC: local opinion leaders ‐ School champion EPOC: other ‐ Prompts and reminders |
| Outcomes |
Outcome relating to the implementation of childcare service policies, practices or programmes The primary trial outcome will be whether or not the school implements ≥ 4 of the 7 PA practices. Measures of the 7 school PA practices will be undertaken at all schools via telephone interview surveys of head PE teachers. Observational verification of practice implementation and an audit of documents relevant to the practices will also be undertaken. |
| Starting date | 19 September 2017 |
| Contact information | Rachel Sutherland, Hunter New England Population Health |
| Notes | Trial registration: ACTRN12617000681358 |
Welk 2019.
| Study name | SWITCH Implementation effectiveness trial |
| Methods | Study design: cluster‐randomised controlled superiority trial |
| Participants |
School type: primary school; children aged 9–11 years Region: USA. |
| Interventions |
Number of experimental conditions: 2: standard implementation (control) and enhanced implementation (intervention) Policies, practices or programmes targeted by the intervention: aims to impact obesity through diet, PA and sedentary behaviour Implementation strategies EPOC: audit and feedback ‐ Feedback throughout the implementation process ‐ Checkpoint sessions EPOC: educational materials ‐ Provided with information about how to capitalise on support from local 4H programme leaders in their county EPOC: tailored interventions ‐ Personalised, web‐based training based |
| Outcomes |
Outcome relating to the implementation of childcare service policies, practices or programmes ‐ Average weekly tracking rate ‐ Adherence to quality elements ‐ Adherence to best practices |
| Starting date | 5 August 2019 |
| Contact information | Gregory Welk, Barbara E Forker Professor of Kinesiology, Iowa State University |
| Notes | Trial registration: NCT04045288 |
Wyse 2019.
| Study name | Click & Crunch |
| Methods | Study design: cluster‐RCT design |
| Participants |
School type: government, independent and Catholic primary schools Region: NSW, Australia |
| Interventions |
Number of experimental conditions: 2 intervention and control Policies, practices or programmes targeted by the intervention The intervention seeks to encourage the purchase of healthier foods and drinks for school canteen lunch orders, that is, items lower in energy, saturated fat, sugar, sodium or a combination of these consistent with the NSW Healthy School Canteen Strategy. Implementation strategies EPOC: monitoring the performance of the delivery of healthcare ‐ The canteen manager at each intervention school will receive a tailored feedback report summarising the results of an assessment of their online canteen menu against the 'NSW Healthy School Canteen Strategy: Food and Drink Criteria', conducted by a trained dietitian. |
| Outcomes |
Outcome relating to the implementation of childcare service policies, practices or programme At baseline and follow‐up, an experienced dietitian will use the assessment of nutrition quality (above) to calculate the proportion of 'Everyday' items, 'Occasional' items and 'Should Not Be Sold' items within each menu, to compare against the 'NSW Healthy School Canteen Strategy: Food and Drink Criteria' which state that ≥ 75% of the menu should be 'Everyday' items and ≤ 25% should be 'Occasional' items. The proportion of schools meeting the criteria at baseline and follow‐up will be reported per group to determine if changes to the availability of healthier items were made. |
| Starting date | 23 May 2018 |
| Contact information | Dr Rebecca Wyse, Hunter New England Population Health Email: Rebecca.wyse@hnehealth.nsw.gov.au |
| Notes | Trial registration: ACTRN12618000855224 |
Zoellner 2019.
| Study name | Kids SIPsmartER |
| Methods | Study design: cluster‐RCT |
| Participants |
School type: 12 middle schools; seventh grade students Region: medically underserved Appalachia counties in southwest Virginia |
| Interventions |
Number of experimental conditions: 2 (intervention and control) schools randomised into Control School conditions transition into the Delayed Intervention School in the following academic year, while the Intervention Schools transition into Support Schools). Policies, practices or programmes targeted by the intervention: implementation of intervention to address sugar sweetened beverage consumption. Implementation strategies EPOC: educational materials ‐ Detailed lesson plans and training videos on secure programme website. ‐ Teachers receive binder with all printed materials and resources. EPOC: educational meetings ‐ An initial overview training, lasting approximately 3 hours, will orient teachers to the Kids SIPsmartER programme structure, available training resources, co‐delivery plan with researchers, informed consent and assent processes, and evaluation components. EPOC: tailored interventions ‐ Teacher training and TA, via in‐person and telephone‐based options, customised to the implementation phase and experience of the teacher. EPOC: other ‐ Financial support |
| Outcomes |
Outcome relating to the implementation of childcare service policies, practices or programmes Implementation process data are captured via lesson debrief forms, fidelity observations, and surveys and interviews with delivery agents. |
| Starting date | 15 August 2018 |
| Contact information | Jamie Zoellner, PhD RD, Associate Professor, University of Virginia |
| Notes | Trial registration: NCT03740113 |
NSW: New South Wales; PA: physical activity; PACE: Physically Active Children in Education; PE: physical education; RCT: randomised controlled trial; SCORES: Supporting Children's Outcomes using Rewards, Exercise and Skills.
Differences between protocol and review
Slight title change to better reflect the interventions under review, from Strategies for enhancing the implementation of school‐based policies or practices targeting risk factors for chronic disease to Strategies for enhancing the implementation of school‐based policies or practices targeting diet, physical activity, obesity, tobacco or alcohol use.
Overall risk of bias was determined using a different criterion to that mentioned in the protocol to this review. Specifically, studies were judged as low, unclear or high risk depending on how the majority of the individual risk of bias domains were scored.
We removed the results section which examined the impact of implementation strategies on knowledge, skill or attitudes of school staff. The decision was made to remove these prior to the update, as such outcomes were infrequently reported and did not aid in the interpretation of the study findings.
A decision hierarchy was utilised to select and analyse all outcomes of interest given the number and complexity including all outcomes would have presented (see explanation in Primary outcomes).
Outcomes of interest were combined to present the impact of implementation strategies on health more broadly rather than individual health outcomes as this was determined to provide a better response to the review questions of interest.
Contributions of authors
All review authors contributed to the conception and conduct of the research.
LW and SMc led the development of the review.
SMc, CB, KO, KN, NN, RS, RH, FT, CW, and SLY contributed to the selection of studies.
SMc, CB, KO, KN, EN and LW contributed to data extraction and management.
SMc and CB contributed to the assessment of the risk of bias of included studies.
EN conducted primary analysis.
SMc, KO and RH contributed to the assessment of the overall quality of evidence.
LW and SMc led the drafting of the manuscript.
All authors provided critical comment on drafts.
Sources of support
Internal sources
-
University of Newcastle, Australia
Salary support for review authors
-
Hunter New England Population Health, Australia
Salary support for review authors
-
Hunter Medical Research Institute, Australia
Salary support for review authors
External sources
-
National Health and Medical Research Council, Australia
Author LW is supported by an NHMRC Career Development Fellowship (Grant ID: APP1128348) and Heart Foundation Future Leader Fellowship (Grant ID: 101175)
-
National Health and Medical Research Council, Australia
Author NN is supported by an NHMRC Translating Research into Practice Fellowship (APP1132450)
-
National Health and Medical Research Council, Australia
Author SY is supported by a Discovery Early Career Researcher Award Fellowship
-
Heart Foundation, Australia
Author FT is supported by a Heart Foundation Postdoctoral Fellowship (100128)
-
National Health and Medical Research Council, Australia
Author RS is supported by an NHMRC Translating Research into Practice Fellowship (APP1150661)
-
National Health and Medical Research Council, Australia
Author FT is supported by an NHMRC Career Development Fellowship (APP1143269)
-
National Health and Medical Research Council, Australia
Author CW is supported by a NHMRC Early Career Fellowship (APP1113272)
-
Health Research Board, Ireland
KN was part supported by the Health Board Ireland and the HSC Public Health Agency (Grant number CBES‐2018‐001) through Evidence Synthesis Ireland/Cochrane Ireland.
Declarations of interest
Some members of the review team are currently undertaking a series of randomised trials aiming to facilitate the implementation of healthy eating and physical activity policies and practices by schools (LW, CB, KO, NN, RS, RH, CW, SLY). Authors LW, NN, RS, SLY, RH, and CMW are authors on one or more of the trials conducted in Australia. For such trials, eligibility, data extraction, risk of bias assessment and GRADE assessment were carried out by review authors who were not directly involved in these studies, this is in line with the Cochrane Conflict of Interests Policy. The authors have not received any benefit, in cash or kind, any hospitality, or any subsidy derived from any source perceived to have an interest in the outcome of the review. All authors have contributed to the development of evaluation of trials examining the impact of implementation strategies in community settings, including those conducted in schools. LW is Co‐ordinating Editor, SMc is Assistant Managing Editor and Method Editor, and KO is a Method Editor for Cochrane Public Health. LW, SMc and KO were not involved in any stage of the editorial management or assessment of this review.
LW: no other conflicts of interest.
SMc: no other conflicts of interest.
CB: no other conflicts of interest.
KO: no other conflicts of interest.
KN: no other conflicts of interest.
NN: no other conflicts of interest.
RS: no other conflicts of interest.
RH: no other conflicts of interest.
FT: no other conflicts of interest.
EN: no other conflicts of interest.
CMW: no other conflicts of interest.
SLY: no other conflicts of interest.
Edited (no change to conclusions)
References
References to studies included in this review
Alaimo 2015 {published data only}
- Alaimo K, Oleksyk S, Golzynski D, Drzal N, Lucarelli J, Reznar M, et al. The Michigan healthy school action tools process generates improvements in school nutrition policies and practices, and student dietary intake. Health Promotion Practice 2015;16(3):401-10. [DOI] [PubMed] [Google Scholar]
- Alaimo K, Oleksyk SC, Drzal NB, Golzynski DL, Lucarelli JF, Wen Y, et al. Effects of changes in lunch-time competitive foods, nutrition practices, and nutrition policies on low-income middle-school children's diets. Childhood Obesity 2013;9(6):509-23. [DOI] [PubMed] [Google Scholar]
Bremer 2018 {published data only}
- Bremer E, Graham JD, Veldhuizen S, Cairney J. A program evaluation of an in-school daily physical activity initiative for children and youth. BMC Public Health 2018;18:1023. [DOI] [PMC free article] [PubMed] [Google Scholar]
Cheung 2018 {published data only}
- Cheung P, Franks P, Kramera M, Drews-Botsch C, Welsh J, Kay C, et al. Impact of a Georgia elementary school-based intervention on physical activity opportunities: a quasi-experimental study. Journal of Science and Medicine in Sport 2018;22(2):191-5. [DOI] [PMC free article] [PubMed] [Google Scholar]
Cunningham‐Sabo 2003 {published data only}
- Caballero B, Clay T, Davis SM, Ethelbah B, Rock BH, Lohman T, et al. Pathways: a school-based, randomized controlled trial for the prevention of obesity in American Indian schoolchildren. American Journal of Clinical Nutrition 2003;78(5):1030-8. [DOI] [PMC free article] [PubMed] [Google Scholar]
- Cunningham-Sabo L, Snyder MP, Anliker J, Thompson J, Weber JL, Thomas O, et al. Impact of the Pathways food service intervention on breakfast served in American-Indian schools. Preventive Medicine 2003;37:S46-54. [DOI] [PubMed] [Google Scholar]
- Davis CE, Hunsberger S, Murray DM, Fabsitz RR, Himes JH, Stephenson LK, et al. Design and statistical analysis for the Pathways study. American Journal of Clinical Nutrition 1999;69(4):S760-3. [DOI] [PubMed] [Google Scholar]
- Stevens J, Story M, Ring K, Murray DM, Cornell CE, Gittelsohn J. The impact of the Pathways intervention on psychosocial variables related to diet and physical activity in American Indian school children. Preventive Medicine 2003;37:S70-9. [DOI] [PubMed] [Google Scholar]
- Story M, Snyder MP, Anliker J, Weber JL, Cunningham-Sabo L, Stone EJ, et al. Changes in the nutrient content of school lunches: results from the Pathways study. Preventive Medicine 2003;37:S35-45. [DOI] [PubMed] [Google Scholar]
Delk 2014 {published data only}
- Delk J, Springer AE, Kelder SH, Grayless M. Promoting teacher adoption of physical activity breaks in the classroom: findings of the Central Texas CATCH Middle School Project. Journal of School Health 2014;84(11):722-30. [DOI] [PubMed] [Google Scholar]
de Villiers 2015 {published data only}
- Villiers A, Steyn NP, Draper CE, Hill J, Dalais L, Fourie J, et al. Implementation of the HealthKick intervention in primary schools in low-income settings in the Western Cape Province, South Africa: a process evaluation. BMC Public Health 2015;15:818. [DOI] [PMC free article] [PubMed] [Google Scholar]
- Draper CE, Villiers A, Lambert EV, Fourie J, Hill J, Dalais L, et al. HealthKick: a nutrition and physical activity intervention for primary schools in low-income settings. BMC Public Health 2010;10:398. [DOI] [PMC free article] [PubMed] [Google Scholar]
- Steyn NP, Villiers A, Gwebushe N, Draper CE, Hill J, Waal M, et al. Did HealthKick, a randomised controlled trial primary school nutrition intervention improve dietary quality of children in low-income settings in South Africa? BMC Public Health 2015;15:948. [DOI] [PMC free article] [PubMed] [Google Scholar]
Egan 2018 {published and unpublished data}
- Egan CA, Webster C, Weaver RG, Brian A, Stodden D, Russ L, et al. Partnerships for Active Children in Elementary Schools (PACES): first year process evaluation. Evaluation and Program Planning 2018;67:61-9. [DOI] [PubMed] [Google Scholar]
Evenhuis 2020 {published data only}
- Evenhuis IJ, Jacobs SM, Vyth EL, Veldhuis L, Boer MR, Seidell JC, et al. The effect of supportive implementation of healthier canteen guidelines on changes in Dutch school canteens and student purchase behaviour. Nutrients 2020;12(8):2419. [DOI] [PMC free article] [PubMed] [Google Scholar]
Farmer 2017 {published data only}
- Farmer VL, Williams SM, Mann JI, Schofield G, McPhee JC, Taylor RW. The effect of increasing risk and challenge in the school playground on physical activity and weight in children: a cluster randomised controlled trial (PLAY). International Journal of Obesity 2017;41(5):793-800. [DOI] [PubMed] [Google Scholar]
French 2004 {published data only (unpublished sought but not used)}
- French SA, Story M, Fulkerson JA, Hannan P. An environmental intervention to promote lower-fat food choices in secondary schools: outcomes of the TACOS Study. American Journal of Public Health 2004;94(9):1507-12. [DOI] [PMC free article] [PubMed] [Google Scholar]
Gingiss 2006 {published data only}
- Boerm M, Gingiss P. Status of school tobacco prevention and control two years after the beginning of the Texas Tobacco Prevention Initiative: comparisons of intervention and comparison schools, 2003. Available at: uh.edu/hnets/TobaccoSchEval.html. Accessed April 25 (accessed prior to 12 August 2022).
- Gingiss P, Boerm M, Roberts-Gray C. Follow-up comparisons of intervention and comparison schools in a state tobacco prevention and control Initiative. Journal of School Health 2006;76(3):98-103. [DOI] [PubMed] [Google Scholar]
Hager 2018 {published data only}
- Hager ER, Song HJ, Lane HG, Guo HH, Jaspers LH, Lopes MA. Pilot-testing an intervention to enhance wellness policy implementation in schools: Wellness Champions for Change. Journal of Nutrition Education and Behavior 2018;50(8):765-75. [DOI] [PMC free article] [PubMed] [Google Scholar]
Heath 2002 {published data only}
- Brown HS, Perez A, Li YP, Hoelscher DM, Kelder SH, Rivera R. The cost-effectiveness of a school-based overweight program. International Journal of Behavioral Nutrition and Physical Activity 2007;4(1):47. [DOI] [PMC free article] [PubMed] [Google Scholar]
- Coleman KJ, Tiller CL, Sanchez J, Heath EM, Sy O, Milliken G, et al. Prevention of the epidemic increase in child risk of overweight in low-income schools: the El Paso coordinated approach to child health. Archives of Pediatrics & Adolescent Medicine 2005;159(3):217-24. [DOI] [PubMed] [Google Scholar]
- Heath EM, Coleman KJ. Evaluation of the institutionalization of the coordinated approach to child health (CATCH) in a US/Mexico border community. Health Education & Behavior 2002;29(4):444-60. [DOI] [PubMed] [Google Scholar]
Hodder 2017 {published data only}
- Hodder RK, Freund M, Bowman J, Wolfenden L, Campbell E, Dray J, et al. Effectiveness of a pragmatic school based universal resilience intervention in reducing tobacco, alcohol and illicit substance use in a population of adolescents: cluster-randomised controlled trial. BMJ Open 2017;7:e016060. [DOI] [PMC free article] [PubMed] [Google Scholar]
Hoelscher 2010 {published data only (unpublished sought but not used)}
- Hoelscher DM, Springer AE, Ranjit N, Perry CL, Evans AE, Stigler M, et al. Reductions in child obesity among disadvantaged school children with community involvement: the Travis County CATCH Trial. Obesity 2010;18(S1):S36-44. [DOI] [PubMed] [Google Scholar]
Lytle 2006 {published data only (unpublished sought but not used)}
- Birnbaum AS, Lytle LA, Story M, Perry CL, Murray DM. Are differences in exposure to a multicomponent school-based intervention associated with varying dietary outcomes in adolescents? Health Education & Behavior 2002;29(4):427-43. [DOI] [PubMed] [Google Scholar]
- Lytle LA, Kubik MY, Perry C, Story M, Birnbaum AS, Murray DM. Influencing healthful food choices in school and home environments: results from the TEENS study. Preventive Medicine 2006;43(1):8-13. [DOI] [PubMed] [Google Scholar]
- Lytle LA, Murray DM, Perry CL, Story M, Birnbaum AS, Kubik MY, et al. School-based approaches to affect adolescents' diets: results from the TEENS study. Health Education & Behavior 2004;31(2):270-87. [DOI] [PubMed] [Google Scholar]
Mathur 2016 {published data only}
- Mathur N, Pednekar M, Sorensen G, Nagler E, Stoddard A, Lando H. Adoption and implementation of tobacco control policies in schools in India: results of the Bihar School Teachers Study. Asian Pacific Journal of Cancer Prevention 2016;17(6):2821-6. [PubMed] [Google Scholar]
- Nagler EM, Pednekar MS, Viswanath K, Sinha DN, Aghi MB, Pischke CR. Designing in the social context: using the social contextual model of health behavior change to develop a tobacco control intervention for teachers in India. Health Education Research 2012;28(1):113-29. [DOI] [PMC free article] [PubMed] [Google Scholar]
- Pawar PS, Nagler EM, Gupta PC, Stoddard AM, Lando HA, Shulman L. Tracking intervention delivery in the 'Tobacco-Free Teachers/Tobacco-Free Society' program, Bihar, India. Health Education Research 2015;30(5):731-41. [DOI] [PMC free article] [PubMed] [Google Scholar]
- Sorensen G, Pednekar MS, Sinha DN, Stoddard AM, Nagler E, Aghi MB. Effects of a tobacco control intervention for teachers in India: results of the Bihar School Teachers Study. American Journal of Public Health 2013;103(11):2035-40. [DOI] [PMC free article] [PubMed] [Google Scholar]
McCormick 1995 {published data only}
- McCormick LK, Steckler AB, McLeroy KR. Diffusion of innovations in schools: a study of adoption and implementation of school-based tobacco prevention curricula. American Journal of Health Promotion 1995;9(3):210-9. [DOI] [PubMed] [Google Scholar]
- Smith DW, McCormick LK, Steckler AB, McLeroy KR. Teachers' use of health curricula: implementation of Growing Healthy, Project SMART, and the Teenage Health Teaching Modules. Journal of School Health 1993;63(8):349-54. [DOI] [PubMed] [Google Scholar]
Mobley 2012 {published data only}
- DeBar LL, Schneider M, Ford EG, Hernandez AE, Showell B, Drews KL, et al. Social marketing-based communications to integrate and support the HEALTHY study intervention. International Journal of Obesity 2009;33:S52-9. [DOI] [PMC free article] [PubMed] [Google Scholar]
- Drews KL, Harrell JS, Thompson D, Mazzuto SL, Ford EG, Carter M, et al. Recruitment and retention strategies and methods in the HEALTHY study. International Journal of Obesity 2009;33:S21-8. [DOI] [PMC free article] [PubMed] [Google Scholar]
- Gillis B, Mobley C, Stadler DD, Hartstein J, Virus A, Volpe SL. Rationale, design and methods of the HEALTHY study nutrition intervention component. International Journal of Obesity 2009;33:29-36. [DOI] [PMC free article] [PubMed] [Google Scholar]
- HEALTHY Study Group. A school-based intervention for diabetes risk reduction. New England Journal of Medicine 2010;363:443-53. [DOI] [PMC free article] [PubMed] [Google Scholar]
- HEALTHY Study Group. HEALTHY study rationale, design and methods: moderating risk of type 2 diabetes in multi-ethnic middle school students. International Journal of Obesity 2009;33:S4. [DOI] [PMC free article] [PubMed] [Google Scholar]
- Hernandez AE, Marcus MD, Hirst K, Faith MS, Goldberg L, Trevino RP. Impact of implementation and conduct of the HEALTHY primary prevention trial on student performance. American Journal of Health Promotion 2014;29(1):55-8. [DOI] [PMC free article] [PubMed] [Google Scholar]
- Mobley CC, Stadler DD, Staten MA, Gillis B, Hartstein J, Siega-Riz AM, et al. Effect of nutrition changes on foods selected by students in a middle school-based diabetes prevention intervention program: the HEALTHY Experience. Journal of School Health 2012;82(2):82-90. [DOI] [PMC free article] [PubMed] [Google Scholar]
- Siega-Riz AM, El Ghormli L, Mobley C, Gillis B, Stadler D, Hartstein J. The effects of the HEALTHY study intervention on middle school student dietary intakes. International Journal of Behavioral Nutrition and Physical Activity 2011;8(1):7. [DOI] [PMC free article] [PubMed] [Google Scholar]
- Trevino RP, Pham T, Mobley C, Hartstein J, Ghormli LE, Songer T. HEALTHY study school food service revenue and expense report. Journal of School Health 2012;82(9):417-23. [DOI] [PMC free article] [PubMed] [Google Scholar]
Nathan 2012 {published data only}
- Nathan N, Wolfenden L, Bell AC, Wyse R, Morgan PJ, Butler M, et al. Effectiveness of a multi-strategy intervention in increasing the implementation of vegetable and fruit breaks by Australian primary schools: a non-randomized controlled trial. BMC Public Health 2012;12:651. [DOI] [PMC free article] [PubMed] [Google Scholar]
Nathan 2016 {published data only}
- Nathan N, Yoong SL, Sutherland R, Reilly K, Delaney T, Janssen L. Effectiveness of a multicomponent intervention to enhance implementation of a healthy canteen policy in Australian primary schools: a randomised controlled trial. International Journal of Behavioral Nutrition and Physical Activity 2016;13(1):106. [DOI] [PMC free article] [PubMed] [Google Scholar]
- Reilly KL, Reeves P, Deeming S, Yoong SL, Wolfenden L, Nathan N, Wiggers J. Economic analysis of three interventions of different intensity in improving school implementation of a government healthy canteen policy in Australia: costs, incremental and relative cost effectiveness. BMC Public Health 2018;18:378. [DOI] [PMC free article] [PubMed] [Google Scholar]
Nathan 2020 {published data only}
- Nathan NK, Sutherland RL, Hope K, McCarthy NJ, Pettett M, Elton B, et al. Implementation of a school physical activity policy improves student physical activity levels: outcomes of a cluster-randomized controlled trial. Journal of Physical Activity and Health 2020;1:1-0. [DOI] [PubMed] [Google Scholar]
Naylor 2006 {published data only (unpublished sought but not used)}
- Kravetsky LB. Targeting Childhood Obesity Through a School-Based Physical Activity Intervention: Action Schools! BC [Masters thesis]. Vancouver (BC): University of British Columbia, 2006. [Google Scholar]
- Naylor PJ, Macdonald HM, Reed KE, McKay HA. Action Schools! BC: a socioecological approach to modifying chronic disease risk factors in elementary school children. Preventing Chronic Disease: Public Health Research, Practice and Policy 2006;3(2):60. [PMC free article] [PubMed] [Google Scholar]
- Naylor PJ, Macdonald HM, Warburton DE, Reed KE, McKay HA. An active school model to promote physical activity in elementary schools: action schools! BC. British Journal of Sports Medicine 2008;42(5):338-43. [DOI] [PubMed] [Google Scholar]
- Naylor PJ, Macdonald HM, Zebedee JA, Reed KE, McKay HA. Lessons learned from Action Schools! BC – an 'active school' model to promote physical activity in elementary schools. Journal of Science and Medicine in Sport 2006;9(5):413-23. [DOI] [PubMed] [Google Scholar]
- Reed KE, Warburton DE, Macdonald HM, Naylor PJ, McKay HA. Action Schools! BC: a school-based physical activity intervention designed to decrease cardiovascular disease risk factors in children. Preventive Medicine 2008;46(6):525-31. [DOI] [PubMed] [Google Scholar]
Perry 1997 {published data only}
- Edmundson EW, Luton SC, McGraw SA, Kelder SH, Layman AK, Smyth MH, et al. CATCH: classroom process evaluation in a multicenter trial. Health Education & Behavior 1994;21(S1):S27-50. [DOI] [PubMed] [Google Scholar]
- Luepker RV, Perry CL, McKinlay SM, Nader PR, Parcel GS, Stone EJ, et al. Outcomes of a field trial to improve children's dietary patterns and physical activity: the Child and Adolescent Trial for Cardiovascular Health (CATCH). JAMA 1996;275(10):768-76. [DOI] [PubMed] [Google Scholar]
- Luepker RV, Perry CL, Osganian V, Nader PR, Parcel GS, Stone EJ, et al. The Child and Adolescent Trial for Cardiovascular Health (CATCH). Journal of Nutritional Biochemistry 1998;9(9):525-34. [Google Scholar]
- Lytle LA, Johnson CC, Bachman K, Wambsgans K, Perry CL, Stone EJ, et al. Successful recruitment strategies for school-based health promotion: experiences from CATCH. Journal of School Health 1994;64(10):405-9. [DOI] [PubMed] [Google Scholar]
- Lytle LA, Stone EJ, Nichaman MZ, Perry CL, Montgomery DH, Nicklas TA, et al. Changes in nutrient intakes of elementary school children following a school-based intervention: results from the CATCH Study. Preventive Medicine 1996;25(4):465-77. [DOI] [PubMed] [Google Scholar]
- McKenzie TL, Nader PR, Strikmiller PK, Yang M, Stone EJ, Perry CL, et al. School physical education: effect of the Child and Adolescent Trial for Cardiovascular Health. Preventive Medicine 1996;25(4):423-31. [DOI] [PubMed] [Google Scholar]
- Nicklas TA, Dwyer J, Mitchell P, Zive M, Montgomery D, Lytle L, et al. Impact of fat reduction on micronutrient density of children's diets: the CATCH study. Preventive Medicine 1996;25(4):478-85. [DOI] [PubMed] [Google Scholar]
- Osganian SK, Ebzery MK, Montgomery DH, Nicklas TA, Evans MA, Mitchell PD, et al. Changes in the nutrient content of school lunches: results from the CATCH Eat Smart Food service Intervention. Preventive Medicine 1996;25(4):400-12. [DOI] [PubMed] [Google Scholar]
- Perry CL, Sellers DE, Johnson C, Pedersen S, Bachman KJ, Parcel GS, et al. The Child and Adolescent Trial for Cardiovascular Health (CATCH): intervention, implementation, and feasibility for elementary schools in the United States. Health Education & Behavior 1997;24(6):716-35. [DOI] [PubMed] [Google Scholar]
- Webber LS, Osganian SK, Feldman HA, Wu M, McKenzie TL, Nichaman M, et al. Cardiovascular risk factors among children after a 2 1/2-year intervention – the CATCH study. Preventive Medicine 1996;25(4):432-41. [DOI] [PubMed] [Google Scholar]
Perry 2004 {published data only}
- Perry CL, Bishop DB, Taylor GL, Davis M, Story M, Gray C, et al. A randomized school trial of environmental strategies to encourage fruit and vegetable consumption among children. Health Education & Behavior 2004;31(1):65-76. [DOI] [PubMed] [Google Scholar]
Sallis 1997 {published data only}
- McKenzie TL, Sallis JF, Faucette N, Roby JJ, Kolody B. Effects of a curriculum and inservice program on the quantity and quality of elementary physical education classes. Research Quarterly for Exercise and Sport 1993;64(2):178-87. [DOI] [PubMed] [Google Scholar]
- McKenzie TL, Sallis JF, Kolody B, Faucette FN. Long-term effects of a physical education curriculum and staff development program: SPARK. Research Quarterly for Exercise and Sport 1997;68(4):280-91. [DOI] [PubMed] [Google Scholar]
- Sallis JF, McKencie TL, Alcarez JE, Kolody B, Hovell MF, Nader PR. Project SPARK – effects of physical exercise on adiposity in children. Prevention and treatment of childhood obesity. Annuals of the New York Academy of Sciences 1993;299:127-36. [DOI] [PubMed] [Google Scholar]
- Sallis JF, McKenzie TL, Alcaraz JE, Kolody B, Faucette N, Hovell MF. The effects of a 2-year physical education program (SPARK) on physical activity and fitness in elementary school students. Sports, Play and Active Recreation for Kids. American Journal of Public Health 1997;87(8):1328-34. [DOI] [PMC free article] [PubMed] [Google Scholar]
Saraf 2015 {published data only}
- Saraf DS, Gupta SK, Pandav CS, Nongkinrih B, Kapoor SK, Pradhan SK, et al. Effectiveness of a school based intervention for prevention of non-communicable diseases in middle school children of rural North India: a randomized controlled trial. Indian Journal of Pediatrics 2015;82(4):354-62. [DOI] [PubMed] [Google Scholar]
Saunders 2006 {published data only}
- Pate RR, Ward DS, Saunders RP, Felton G, Dishman RK, Dowda M. Promotion of physical activity among high-school girls: a randomized controlled trial. American Journal of Public Health 2005;95(9):1582-7. [DOI] [PMC free article] [PubMed] [Google Scholar]
- Saunders RP, Ward D, Felton GM, Dowda M, Pate RR. Examining the link between program implementation and behavior outcomes in the Lifestyle Education for Activity Program (LEAP). Evaluation and Program Planning 2006;29(4):352-64. [DOI] [PubMed] [Google Scholar]
- Ward DS, Saunders R, Felton GM, Williams E, Epping JN, Pate RR. Implementation of a school environment intervention to increase physical activity in high school girls. Health Education Research 2006;21(6):896-910. [DOI] [PubMed] [Google Scholar]
Simons‐Morton 1988 {published data only}
- Parcel GS, Simons-Morton B, O'Hara NM, Baranowski T, Wilson B. School promotion of healthful diet and physical activity: impact on learning outcomes and self-reported behavior. Health Education Quarterly 1989;16(2):181-99. [DOI] [PubMed] [Google Scholar]
- Parcel GS, Simons-Morton BG, O'Hara NM, Baranowski T, Kolbe LJ, Bee DE. School promotion of healthful diet and exercise behavior: an integration of organizational change and social learning theory interventions. Journal of School Health 1987;57(4):150-6. [DOI] [PubMed] [Google Scholar]
- Simons-Morton BG, Parcel GS, Baranowski T, Forthofer R, O'Hara NM. Promoting physical activity and a healthful diet among children: results of a school-based intervention study. American Journal of Public Health 1991;81(8):986-91. [DOI] [PMC free article] [PubMed] [Google Scholar]
- Simons-Morton BG, Parcel GS, O'Hara NM. Implementing organizational changes to promote healthful diet and physical activity at school. Health Education Quarterly 1988;15(1):115-30. [DOI] [PubMed] [Google Scholar]
Story 2000 {published data only}
- Perry CL, Bishop DB, Taylor G, Murray DM, Mays RW, Dudovitz BS, et al. Changing fruit and vegetable consumption among children: the 5-a-Day Power Plus program in St. Paul, Minnesota. American Journal of Public Health. 1998;88(4):603-9. [DOI] [PMC free article] [PubMed] [Google Scholar]
- Story M, Mays RW, Bishop DB, Perry CL, Taylor G, Smyth M, et al. 5-a-day Power Plus: process evaluation of a multicomponent elementary school program to increase fruit and vegetable consumption. Health Education & Behavior 2000;27(2):187-200. [DOI] [PubMed] [Google Scholar]
Sutherland 2017 {published and unpublished data}
Sutherland 2020 {published data only}
- Sutherland R, Campbell E, McLaughlin M, Nathan N, Wolfenden L, Lubans DR, et al. Scale-up of the Physical Activity 4 Everyone (PA4E1) intervention in secondary schools: 12-month implementation outcomes from a cluster randomized controlled trial. International Journal of Behavioral Nutrition and Physical Activity 2020;17(1):1-4. [DOI] [PMC free article] [PubMed] [Google Scholar]
Taylor 2018 {published and unpublished data}
- Taylor JC, Zidenberg-Cherr S, Linnell JD, Feenstra G, Scherr RE. Impact of a multicomponent, school-based nutrition intervention on students’ lunchtime fruit and vegetable availability and intake: a pilot study evaluating the Shaping Healthy Choices Program. Journal of Hunger & Environmental Nutrition 2018;13(3):415-28. [Google Scholar]
Waters 2017 {published data only}
- Waters E, Gibbs L, Tadic M, Ukoumunne OC, Magarey A, Okely AD, et al. Cluster randomised trial of a school-community child health promotion and obesity prevention intervention: findings from the evaluation of Fun 'n Healthy in Moreland! BMC Public Health 2017;18(1):92. [DOI: ] [DOI] [PMC free article] [PubMed] [Google Scholar]
Whatley Blum 2007 {published data only}
- Davee AM, Whatley Blum JE, Devore RL, Beaudoin CM, Kaley LA, Leiter JL. The vending and à la carte policy intervention in Maine public high schools. Preventing Chronic Disease 2005;2:Spec no: A14. [PMC free article] [PubMed] [Google Scholar]
- Whatley Blum JE, Davee AM, Beaudoin CM, Jenkins PL, Kaley LA, Wigand DA. Reduced availability of sugar-sweetened beverages and diet soda has a limited impact on beverage consumption patterns in Maine high school youth. Journal of Nutrition Education and Behavior 2008;40(6):341-7. [DOI] [PubMed] [Google Scholar]
- Whatley Blum JE, Davee AM, Devore RL, Beaudoin CM, Jenkins PL, Kaley LA, et al. Implementation of low-fat, low-sugar, and portion-controlled nutrition guidelines in competitive food venues of Maine public high schools. Journal of School Health 2007;77(10):687-93. [DOI] [PubMed] [Google Scholar]
Wolfenden 2017 {published data only}
- Reilly KL, Reeves P, Deeming S, Yoong SL, Wolfenden L, Nathan N, et al. Economic analysis of three interventions of different intensity in improving school implementation of a government healthy canteen policy in Australia: costs, incremental and relative cost effectiveness. BMC Public Health 2018;18:378. [DOI] [PMC free article] [PubMed] [Google Scholar]
- Wolfenden L, Nathan N, Janssen LM, Wiggers J, Reilly K, Delaney T. Multi-strategic intervention to enhance implementation of healthy canteen policy: a randomised controlled trial. Implementation Science 2017;12(1):6. [DOI] [PMC free article] [PubMed] [Google Scholar]
- Wolfenden L, Nathan N, Williams CM, Delaney T, Reilly KL, Freund M. A randomised controlled trial of an intervention to increase the implementation of a healthy canteen policy in Australian primary schools: study protocol. Implementation Science 2014;9(1):147. [DOI] [PMC free article] [PubMed] [Google Scholar]
Yoong 2016 {published data only}
- Reilly KL, Reeves P, Deeming S, Yoong SL, Wolfenden L, Nathan N, et al. Economic analysis of three interventions of different intensity in improving school implementation of a government healthy canteen policy in Australia: costs, incremental and relative cost effectiveness. BMC Public Health 2018;18:378. [DOI] [PMC free article] [PubMed] [Google Scholar]
- Williams CM, Nathan N, Delaney T, Yoong SL, Wiggers J, Preece S. CAFÉ: a multicomponent audit and feedback intervention to improve implementation of healthy food policy in primary school canteens: protocol of a randomised controlled trial. BMJ Open 2015;5(6):e006969. [DOI] [PMC free article] [PubMed] [Google Scholar]
- Yoong SL, Nathan N, Wolfenden L, Wiggers J, Reilly K, Oldmeadow C. CAFÉ: a multicomponent audit and feedback intervention to improve implementation of healthy food policy in primary school canteens: a randomised controlled trial. International Journal of Behavioral Nutrition and Physical Activity 2016;13(1):126. [DOI] [PMC free article] [PubMed] [Google Scholar]
Young 2008 {published data only}
- Elder JP, Lytle L, Sallis JF, Young DR, Steckler A, Simons-Morton D. A description of the social–ecological framework used in the Trial of Activity for Adolescent Girls (TAAG). Health Education Research 2007;22(2):155-65. [DOI] [PMC free article] [PubMed] [Google Scholar]
- Elder JP, Shuler L, Moe SG, Grieser M, Pratt C, Cameron S. Recruiting a diverse group of middle school girls into the trial of activity for adolescent girls. Journal of School Health 2008;78(10):523-31. [DOI] [PMC free article] [PubMed] [Google Scholar]
- Stevens J, Murray DM, Catellier DJ, Hannan PJ, Lytle LA, Elder JP, et al. Design of the Trial of Activity in Adolescent Girls (TAAG). Contemporary Clinical Trials 2005;26(2):223-33. [DOI] [PMC free article] [PubMed] [Google Scholar]
- Webber LS, Catellier DJ, Lytle LA, Murray DM, Pratt CA, Young DR, et al. Promoting physical activity in middle school girls: Trial of Activity for Adolescent Girls. American Journal of Preventive Medicine 2008;34(3):173-84. [DOI] [PMC free article] [PubMed] [Google Scholar]
- Young DR, Steckler A, Cohen S, Pratt C, Felton G, Moe SG. Process evaluation results from a school-and community-linked intervention: the Trial of Activity for Adolescent Girls (TAAG). Health Education Research 2008;23(6):976-86. [DOI] [PMC free article] [PubMed] [Google Scholar]
References to studies excluded from this review
ACTRN12619000431123 {published data only}
- ACTRN12619000431123. A technology-based program to promote healthy lifestyles among secondary school students. trialsearch.who.int/Trial2.aspx?TrialID=ACTRN12619000431123 (first received 18 March 2019). [ACTRN ID: 12619000431123]
Cunningham‐Sabo 2016 {published data only}
- Cunningham-Sabo L, Lohse B, Smith S, Browning R, Strutz E, Nigg C, et al. Fuel for Fun: a cluster-randomized controlled study of cooking skills, eating behaviors, and physical activity of 4th graders. BMC Public Health 2016;16:444. [DOI] [PMC free article] [PubMed] [Google Scholar]
Hodder 2012 {published data only}
- Hodder RK, Freund M, Bowman J, Wolfenden L, Campbell E, Wye P, et al. A cluster randomised trial of a school-based resilience intervention to decrease tobacco, alcohol and illicit drug use in secondary school students: study protocol. BMC Public Health 2012;12:1009. [DOI] [PMC free article] [PubMed] [Google Scholar]
Hoelscher 2001 {published data only}
- Hoelscher DM, Kelder SH, Murray N, Cribb PW, Conroy J, Parcel GS. Dissemination and adoption of the Child and Adolescent Trial for Cardiovascular Health (CATCH): a case study in Texas. Journal of Public Health Management & Practice 2001;7(2):90-100. [DOI] [PubMed] [Google Scholar]
Hoelscher 2003 {published data only}
- Hoelscher DM, Mitchell P, Dwyer J, Elder J, Clesi A, Snyder P. How the CATCH Eat Smart Program helps implement the USDA regulations in school cafeterias. Health Education & Behavior 2003;30(4):434-46. [DOI] [PubMed] [Google Scholar]
Hoelscher 2004 {published data only}
- Hoelscher DM, Feldman HA, Johnson CC, Lytle LA, Osganian SK, Parcel GS, et al. School-based health education programs can be maintained over time: results from the CATCH Institutionalization study. Preventive Medicine Reports 2004;38(5):594-606. [DOI] [PubMed] [Google Scholar]
Hoelscher 2016 {published data only}
- Hoelscher D, Ory M, Dowdy D, Miao J, Atteberry H, Nichols D, et al. Effects of funding allocation for Safe Routes to School programs on active commuting to school and related behavioral, knowledge, and psychosocial outcomes: results from the Texas Childhood Obesity Prevention Policy Evaluation (T-COPPE) study. Environment and Behavior 2016;48(1):210-29. [Google Scholar]
ISRCTN11867516 {published data only}
- ISRCTN11867516. Chinese primary school children physical activity and dietary behaviour changes intervention (CHIRPY DRAGON Study). trialsearch.who.int/Trial2.aspx?TrialID=ISRCTN11867516 (first received 25 August 2015).
ISRCTN61188203 {published data only}
- ISRCTN61188203. Active Programme Promoting Lifestyle Education. trialsearch.who.int/Trial2.aspx?TrialID=ISRCTN61188203 (first received 23 January 2004).
Kajons 2018 {published data only}
- Kajons N, David M, Gowland-Ella J, Lewis P, Batchelor S. Thirsty? Choose Water! Behavioural interventions and water stations in secondary schools a two-by-two factorial. BMC Public Health 2018;18(788):1-7. [DOI] [PMC free article] [PubMed] [Google Scholar]
Kelder 2003 {published data only}
- Kelder SH, Mitchell PD, McKenzie TL, Derby C, Strikmiller PK, Luepker RV, et al. Long-term implementation of the Catch Physical Education Program. Health Education & Behavior 2003;30(4):463-75. [DOI] [PubMed] [Google Scholar]
Kim 2012 {published data only}
- Kim K, Hong SA, Yun SH, Ryou HJ, Lee SS, Kim MK. The effect of a healthy school tuck shop program on the access of students to healthy foods. Nutrition Research & Practice 2012;6(2):138-45. [DOI] [PMC free article] [PubMed] [Google Scholar]
Li 2010 {published data only}
- Li Y, Hu X, Zhang Q, Liu A, Fang H, Hao L, et al. The nutrition-based comprehensive intervention study on childhood obesity in China (NISCOC): a randomised cluster controlled trial. BMC Public Health 2010;10:229. [DOI] [PMC free article] [PubMed] [Google Scholar]
Li 2014 {published data only}
- Li XH, Lin S, Guo H, Huang Y, Wu L, Zhang Z, et al. Effectiveness of a school-based physical activity intervention on obesity in school children: a nonrandomized controlled trial. BMC Public Health 2014;14:1282. [DOI] [PMC free article] [PubMed] [Google Scholar]
Lubans 2005 {published data only}
- Lubans DR. Promoting Physical Activity in the Secondary School Setting: Evaluation of the Lifetime Activity Programme [Doctoral thesis]. Ann Arbor: University of Oxford (UK), 2005. [Google Scholar]
Lubans 2010 {published data only}
- Lubans D, Morgan P, Aguiar E, Callister R. Randomised controlled trial of the Physical Activity Leaders (PALs) program for low-active adolescent boys from disadvantaged secondary schools. Journal of Science and Medicine in Sport 2010;13:12. [DOI] [PubMed] [Google Scholar]
Lubans 2014 {published data only}
- Lubans D, Cohen K, Plotnikoff R, Callister R, Morgan P. The SCORES physical activity intervention for children attending schools in low-income communities: a cluster RCT. Journal of Science and Medicine in Sport 2014;18:121. [Google Scholar]
Lubans 2015 {published data only}
- Lubans D, Smith J, Morgan P, Beauchamp M, Miller A, Lonsdale C, et al. Improving muscular fitness enhances psychological well-being in low-income adolescent boys: findings from the ATLAS cluster RCT. Journal of Science and Medicine in Sport 2015;19:75. [Google Scholar]
NCT00061165 {published data only}
- NCT00061165. Obesity prevention in African American school children. clinicaltrials.gov/ct2/show/nct00061165 (first received 23 May 2003).
Osganian 2003a {published data only}
- Osganian SK, Parcel GS, Stone EJ. Introduction. Institutionalization of a school health promotion program: background and rationale of the CATCH-ON study. Health Education & Behavior 2003;30(4):410-7. [DOI] [PubMed] [Google Scholar]
Prell 2005 {published data only}
- Prell HC, Berg MC, Jonsson LM, Lissner L. A school-based intervention to promote dietary change. Journal of Adolescent Health 2005;36(6):529-30. [DOI] [PubMed] [Google Scholar]
Rissel 2012 {published data only}
- Rissel C, Laws R, St George A, Hector D, Milat AJ, Baur LA. Research to practice: application of an evidence building framework to a childhood obesity prevention initiative in New South Wales. Health Promotion Journal of Australia 2012;23(1):16-24. [DOI] [PubMed] [Google Scholar]
Rosario 2013 {published data only}
- Rosario R, Araujo A, Oliveira B, Padrao P, Lopes O, Teixeira V, et al. Impact of an intervention through teachers to prevent consumption of low nutrition, energy-dense foods and beverages: a randomized trial. Preventive Medicine 2013;57(1):20-5. [DOI] [PubMed] [Google Scholar]
Rosario 2016 {published data only}
- Rosário R, Araújo A, Padrão P, Lopes O, Moreira A, Abreu S. Impact of a school-based intervention to promote fruit intake: a cluster randomized controlled trial. Public Health 2016;136:94-100. [DOI] [PubMed] [Google Scholar]
Rosenbaum 2007 {published data only}
- Rosenbaum M, Nonas C, Weil R, Horlick M, Fennoy I, Vargas I, et al. School-based intervention acutely improves insulin sensitivity and decreases inflammatory markers and body fatness in junior high school students. Journal of Clinical Endocrinology & Metabolism 2007;92(2):504-8. [DOI] [PubMed] [Google Scholar]
Rosenkranz 2012 {published data only}
- Rosenkranz RR, Lubans DR, Peralta LR, Bennie A, Sanders T, Lonsdale C. A cluster-randomized controlled trial of strategies to increase adolescents' physical activity and motivation during physical education lessons: the Motivating Active Learning in Physical Education (MALP) trial. BMC Public Health 2012;12:834. [DOI] [PMC free article] [PubMed] [Google Scholar]
Rothwell 2011 {published data only}
- Rothwell H, Segrott J. Preventing alcohol misuse in young people aged 9-11 years through promoting family communication: an exploratory evaluation of the Kids, Adults Together (KAT) Programme. BMC Public Health 2011;11:810. [DOI] [PMC free article] [PubMed] [Google Scholar]
Rowlands 2008 {published data only}
- Rowlands A, Esliger DW, Pilgrim EL, Middlebrooke AR, Eston RG. Physical activity content of Motive8 PE compared to primary school PE lessons in the context of children's overall daily activity levels. Journal of Obesity 2008;6:1-8.
Rozi 2019 {published data only}
- Rozi S, Zahid N, Roome T, Lakhdir MP, Sawani S, Razzak A, et al. Effectiveness of a school based smokeless tobacco intervention: a cluster randomized trial. Journal of Community Health 2019;44(6):1098-110. [DOI] [PubMed] [Google Scholar]
Ruzita 2007 {published data only}
- Ruzita AT, Wan Azdie M, Ismail M. The effectiveness of nutrition education programme for primary school children. Malaysian Journal of Nutrition 2007;13(1):45-54. [PubMed] [Google Scholar]
Sallis 2003 {published data only}
- Sallis JF, McKenzie TL, Conway TL, Elder JP, Prochaska JJ, Brown M, et al. Environmental interventions for eating and physical activity: a randomized controlled trial in middle schools. American Journal of Preventive Medicine 2003;24(3):209-17. [DOI] [PubMed] [Google Scholar]
Salmon 2005 {published data only}
- Salmon J, Ball K, Crawford D, Booth M, Telford A, Hume C, et al. Reducing sedentary behaviour and increasing physical activity among 10-year-old children: overview and process evaluation of the 'Switch-Play' intervention. Health Promotion International 2005;20(1):7-17. [DOI] [PubMed] [Google Scholar]
Singhal 2010 {published data only}
- Singhal N, Misra A, Shah P, Gulati S. Effects of controlled school-based multi-component model of nutrition and lifestyle interventions on behavior modification, anthropometry and metabolic risk profile of urban Asian Indian adolescents in North India. European Journal of Clinical Nutrition 2010;64(4):364-73. [DOI] [PubMed] [Google Scholar]
Sirikulchayanonta 2011 {published data only}
- Sirikulchayanonta C, Pavadhgul P, Chongsuwat R, Klaewkla J. Participatory action project in reducing childhood obesity in Thai primary schools. Asia-Pacific Journal of Public Health 2011;23(6):917-27. [DOI] [PubMed] [Google Scholar]
Smith 2001 {published data only}
- Smith KW, Hoelscher DM, Lytle LA, Dwyer JT, Nicklas TA, Zive MM, et al. Reliability and validity of the Child and Adolescent Trial for Cardiovascular Health (CATCH) Food Checklist: a self-report instrument to measure fat and sodium intake by middle school students. Journal of the American Dietetic Association 2001;101(6):635-47. [DOI] [PubMed] [Google Scholar]
Smith 2015 {published data only}
- Smith NJ, Monnat SM, Lounsbery MA. Physical activity in physical education: are longer lessons better? Journal of School Health 2015;85(3):141-8. [DOI] [PMC free article] [PubMed] [Google Scholar]
Somsri 2016 {published data only}
- Somsri P, Satheannoppakao W, Tipayamongkholgul M, Vatanasomboon P, Kasemsup R. A cosmetic content-based nutrition education program improves fruit and vegetable consumption among grade 11 Thai students. Journal of Nutrition Education & Behavior 2016;48(3):190-8. [DOI] [PubMed] [Google Scholar]
Sutherland 2016 {published data only}
- Sutherland R, Campbell E, Lubans DR, Morgan PJ, Okely AD, Nathan N. 'Physical Activity 4 Everyone' school-based intervention to prevent decline in adolescent physical activity levels: 12 month (mid-intervention) report on a cluster randomised trial. British Journal of Sports Medicine 2016;50(8):488-95. [DOI] [PMC free article] [PubMed] [Google Scholar]
Uys 2016 {published data only}
- Uys M, Draper CE, Hendricks S, Villiers A, Fourie J, Steyn NP, et al. Impact of a South African school-based intervention, HealthKick, on fitness correlates. American Journal of Health Behavior 2016;40(1):55-66. [DOI] [PubMed] [Google Scholar]
Velicer 2007 {published data only}
- Velicer WF, Redding CA, Anatchkova MD, Fava JL, Prochaska JO. Identifying cluster subtypes for the prevention of adolescent smoking acquisition. Addictive Behaviors 2007;32(2):228-47. [DOI] [PubMed] [Google Scholar]
Vetter, 2015 {published data only}
- Vetter, O'Connor H, O'Dwyer N, Orr R. Active learning: effectiveness of learning a numeracy skill with physical activity, reducing sedentary time in school children. Journal of Science and Medicine in Sport 2015;19:12. [Google Scholar]
Veugelers 2005 {published data only}
- Veugelers PJ, Fitzgerald AL. Effectiveness of school programs in preventing childhood obesity: a multilevel comparison. American Journal of Public Health 2005;95(3):432-5. [DOI] [PMC free article] [PubMed] [Google Scholar]
Viggiano 2015 {published data only}
- Viggiano A, Viggiano E, Di Costanzo A, Viggiano A, Andreozzi E, Romano V, et al. Kaledo, a board game for nutrition education of children and adolescents at school: cluster randomized controlled trial of healthy lifestyle promotion. European Journal of Pediatrics 2015;174(2):217-28. [DOI] [PubMed] [Google Scholar]
Volpe 2013 {published data only}
- Volpe SL, Hall WJ, Steckler A, Schneider M, Thompson D, Mobley C, et al. Process evaluation results from the HEALTHY nutrition intervention to modify the total school food environment. Health Education Research 2013;28(6):970-8. [DOI] [PMC free article] [PubMed] [Google Scholar]
Wang 2015 {published data only}
- Wang D, Stewart D, Yuan Y, Chang C. Do health-promoting schools improve nutrition in China? Health Promotion International 2015;30(2):359-68. [DOI] [PubMed] [Google Scholar]
References to ongoing studies
Fernandez‐Jimenez 2019 {published data only}
- Fernandez-Jimenez R, Santos-Beneit G, Tresserra-Rimbau A, Bodega P, Miguel M, Cos-Gandoy A, et al. Rationale and design of the school-based SI! Program to face obesity and promote health among Spanish adolescents: a cluster-randomized controlled trial. American Heart Journal 2019;215:27-40. [DOI] [PubMed] [Google Scholar]
Haible 2019 {published data only}
- Haible S, Volk C, Demetriou Y, Honer O, Thiel A, Trautwein U, et al. Promotion of physical activity-related health competence in physical education: study protocol for the GEKOS cluster randomized controlled trial. BMC Public Health 2019;19(1):396. [DOI] [PMC free article] [PubMed] [Google Scholar]
Liu 2019b {published data only}
- Liu Z, Wu Y, Niu WY, Feng X, Lin Y, Gao A, et al. A school-based, multi-faceted health promotion programme to prevent obesity among children: protocol of a cluster-randomised controlled trial (the DECIDE-Children study). BMJ Open 2019;9(11):e027902. [DOI] [PMC free article] [PubMed] [Google Scholar]
Lonsdale 2016 {published data only}
- Lonsdale C, Sanders T, Cohen KE, Parker P, Noetel M, Hartwig T. Scaling-up an efficacious school-based physical activity intervention: study protocol for the 'Internet-based Professional Learning to help teachers support Activity in Youth' (iPLAY) cluster randomized controlled trial and scale-up implementation evaluation. BMC Public Health 2016;16(1):873. [DOI] [PMC free article] [PubMed] [Google Scholar]
Nathan 2019a {published data only}
- ACTRN12617001265369. A randomised trial of an intervention to facilitate the implementation of scheduled physical activity in NSW primary schools. www.anzctr.org.au/Trial/Registration/TrialReview.aspx?id=373520 (first received 24 August 2017).
Nathan 2019b {published data only}
- ACTRN12619001229167. Preparing an effective school-based physical activity implementation strategy for scale-up: a randomized noninferiority trial. anzctr.org.au/Trial/Registration/TrialReview.aspx?id=378086 (first received 31 July 2019).
Nathan 2020a {published data only}
- Nathan N. A randomised trial of an intervention to sustain primary schools’ implementation of a state-wide physical activity policy. www.anzctr.org.au/Trial/Registration/TrialReview.aspx?id=378735 (first received 9 March 2020).
Randby 2019 {published data only}
- ISRCTN12683953. An implementation intervention to increase adherence to the Norwegian school food guideline. www.isrctn.com/ISRCTN12683953 (first received 7 July 2019).
Sutherland 2019 {published data only}
- Mclaughlin M, Duff J, Sutherland R, Campbell E, Wolfenden L, Wiggers J. Protocol for a mixed methods process evaluation of a hybrid implementation-effectiveness trial of a scaled-up whole-school physical activity program for adolescents: Physical Activity 4 Everyone (PA4E1). Trials 2020;21:268. [DOI] [PMC free article] [PubMed] [Google Scholar]
- Sutherland R, Campbell E, Nathan N, Wolfenden L, Lubans DR, Morgan PJ, et al. A cluster randomised trial of an intervention to increase the implementation of physical activity practices in secondary schools: study protocol for scaling up the Physical Activity 4 Everyone (PA4E1) program. BMC Public Health 2019;19(1):883. [DOI] [PMC free article] [PubMed] [Google Scholar]
Welk 2019 {published data only}
- NCT04045288. SWITCH Implementation Effectiveness Trial. clinicaltrials.gov/ct2/show/NCT04045288 (first received 5 August 2019).
Wyse 2019 {published data only}
- Leonard A, Delaney T, Seward K, Zoetemeyer R, Lamont H, Sutherland R, et al. Investigating differences between traditional (paper bag) ordering and online ordering from primary school canteens: a cross-sectional study comparing menu, usage and lunch order characteristics. Public Health Nutrition 2020;Oct:1-10. [DOI: doi: 10.1017/S1368980020003559] [DOI] [PMC free article] [PubMed] [Google Scholar]
- Wyse R, Delaney T, Gibbins P, Ball K, Campbell K, Yoong SL, et al. Cluster randomised controlled trial of an online intervention to improve healthy food purchases from primary school canteens: a study protocol of the 'Click & Crunch' trial. BMJ Open 2019;9(9):e030538. [DOI] [PMC free article] [PubMed] [Google Scholar]
Zoellner 2019 {published data only}
- Zoellner JM, Porter KJ, You W, Chow PI, Ritterband LM, Yuhas M, et al. Kids SIPsmartER, a cluster randomized controlled trial and multi-level intervention to improve sugar-sweetened beverages behaviors among Appalachian middle-school students: rationale, design & methods. Contemporary Clinical Trials 2019;83:64-80. [DOI] [PMC free article] [PubMed] [Google Scholar]
Additional references
Anderson 2019
- Anderson E, Durstine JL. Physical activity, exercise, and chronic diseases: a brief review. Sports Medicine and Health Science 2019;1(1):3-10. [DOI] [PMC free article] [PubMed] [Google Scholar]
Anzures‐Cabrera 2011
- Anzures-Cabrera J, Sarpatwari A, Higgins JP. Expressing findings from meta-analyses of continuous outcomes in terms of risks. Statistics in Medicine 2011;30(25):2967-85. [DOI] [PubMed] [Google Scholar]
Arditi 2017
- Arditi C, Rège-Walther M, Durieux P, Burnand B. Computer-generated reminders delivered on paper to healthcare professionals: effects on professional practice and healthcare outcomes. Cochrane Database of Systematic Reviews 2017, Issue 7. Art. No: CD001175. [DOI: 10.1002/14651858.CD001175.pub4] [DOI] [PMC free article] [PubMed] [Google Scholar]
Australian Health Minister' Advisory Council 2017
- Australian Health Minister' Advisory Council. National Strategic Framework for Chronic Conditions. Canberra (Australia): Australian Government, 2017. [Google Scholar]
Brown 2017
- Brown CH, Curran G, Palinkas LA, Aarons A, Wells KB, Jones L, et al. An overview of research and evaluation designs for dissemination and implementation. Annual Review of Public Health 2017;38:1-22. [DOI] [PMC free article] [PubMed] [Google Scholar]
Brown 2019
- Brown T, Moore TH, Hooper L, Gao Y, Zayegh A, Ijaz S, et al. Interventions for preventing obesity in children. Cochrane Database of Systematic Reviews 2019, Issue 7. Art. No: CD001871. [DOI: 10.1002/14651858.CD001871.pub4] [DOI] [PMC free article] [PubMed] [Google Scholar]
Campbell 2020
- Campbell M, McKenzie JE, Sowden A, Katikireddi SV, Brennan SE, Ellis S, et al. Synthesis without meta-analysis (SWiM) in systematic reviews: reporting guideline. BMJ 2020;368:l6890. [DOI] [PMC free article] [PubMed] [Google Scholar]
Cane 2012
- Cane J, Connor D, Michie S. Validation of the theoretical domains framework for use in behaviour change and implementation research. Implementation Science 2012;7:37. [DOI] [PMC free article] [PubMed] [Google Scholar]
Cassar 2019
- Cassar S, Salmon J, Timperio A, Naylor P, Nassau F, Contardo Ayala AM, et al. Adoption, implementation and sustainability of school-based physical activity and sedentary behaviour interventions in real-world settings: a systematic review. International Journal of Behavioral Nutrition and Physical Activity 2019;16(1):120. [DOI] [PMC free article] [PubMed] [Google Scholar]
Chandler 2016
- Chandler JL, Brazendale K, Beets MW, Mealing BA. Classification of physical activity intensities using a wrist-worn accelerometer in 8–12-year-old children. Pediatric Obesity 2016;11(2):120-7. [DOI] [PubMed] [Google Scholar]
Chriqui 2013
- Chriqui J, Resnick E, Schneider L, Schermbeck R, Adcock T, Carrion V, et al. School District Wellness Policies: Evaluating Progress and Potential for Improving Children’s Health Five Years After the Federal Mandate. School Years 2006–07 through 2010-11. Volume 3. Robert Wood Johnson Foundation 2013;3.
Chung 2018
- Chung ST, Onuzuruike AU, Magge SN. Cardiometabolic risk in obese children. Annals of the New York Academy of Sciences 2018;1411(1):166-83. [DOI] [PMC free article] [PubMed] [Google Scholar]
Cohen 1988
- Cohen J. Statistical Power Analysis for the Behavioral Sciences. New York (NY): Routledge Academic, 1988. [Google Scholar]
Cook 2019
- Cook CR, Lyon AR, Locke J, Waltz T, Powell BJ. Adapting a compilation of implementation strategies to advance school-based implementation research and practice. Prevention Science 2019;20(6):914-35. [DOI] [PMC free article] [PubMed] [Google Scholar]
Covidence [Computer program]
- Covidence. Melbourne, Australia: Veritas Health Innovation, accessed 6 May 2019.
Cruz 2018
- Cruz F, Ramos E, Lopes C, Araújo J. Tracking of food and nutrient intake from adolescence into early adulthood. Nutrition 2018;55:84-90. [DOI] [PubMed] [Google Scholar]
Damschroder 2009
- Damschroder LJ, Aron DC, Keith RE, Kirsh SR, Alexander JA, Lowery JC. Fostering implementation of health services research findings into practice: a consolidated framework for advancing implementation science. Implementation Science 2009;4:50. [DOI] [PMC free article] [PubMed] [Google Scholar]
Darlington 2018
- Darlington EJ, Violon N, Jourdan D. Implementation of health promotion programmes in schools: an approach to understand the influence of contextual factors on the process? BMC Public Health 2018;18(1):163. [DOI] [PMC free article] [PubMed] [Google Scholar]
Department of Health 2018
- Department of Health. NCEC Implementation Guide and Toolkit for National Clinical Guidelines. health.gov.ie/national-patient-safety-office/ncec/ (last accessed prior to 12 August 2022).
De Silva‐Sanigorski 2011
- De Silva-Sanigorski A, Breheny T, Jones L, Lacy K, Kremer P, Carpenter L, et al. Government food service policies and guidelines do not create healthy school canteens. Australian and New Zealand Journal of Public Health 2011;35(2):117-21. [DOI] [PubMed] [Google Scholar]
Dillman 1978
- Dillman DA. Mail and Telephone Surveys: the Total Design Method. New York (NY): John Wiley & Sons, 1978. [Google Scholar]
Dobbins 2013
- Dobbins M, Husson H, DeCorby K, LaRocca RL. School-based physical activity programs for promoting physical activity and fitness in children and adolescents aged 6 to 18. Cochrane Database of Systematic Reviews 2013, Issue 2. Art. No: CD007651. [DOI: 10.1002/14651858.CD007651.pub2] [DOI] [PMC free article] [PubMed] [Google Scholar]
Downs 2012
- Downs SM, Farmer A, Quintanilha M, Berry TR, Mager DR, Willows ND, et al. From paper to practice: barriers to adopting nutrition guidelines in schools. Journal of Nutrition Education and Behavior 2012;44(2):114-22. [DOI] [PubMed] [Google Scholar]
Durlak 2008
- Durlak JA, DuPre EP. Implementation matters: a review of research on the influence of implementation on program outcomes and the factors affecting implementation. American Journal of Community Psychology 2008;41:327-50. [DOI] [PubMed] [Google Scholar]
Duval 2000
- Duval S, Tweedie R. Trim and fill: a simple funnel-plot-based method of testing and adjusting for publication bias in meta-analysis. Biometrics 2000;56(2):455-63. [DOI] [PubMed] [Google Scholar]
Eccles 2009
- Eccles MP, Armstrong D, Baker R, Cleary K, Davies H, Davies S, et al. An implementation research agenda. Implementation Science 2009;4:18. [DOI] [PMC free article] [PubMed] [Google Scholar]
Eisman 2020
- Eisman AB, Kilbourne AM, Dopp AR, Saldana L, Eisenberg D. Economic evaluation in implementation science: making the business case for implementation strategies. Psychiatry Research 2020;283:112433. [DOI] [PMC free article] [PubMed] [Google Scholar]
EPOC 2015
- Effective Practice and Organisation of Care (EPOC). EPOC Taxonomy. www.epoc.cochrane.org/epoc-taxonomy (accessed prior to 22 March 2017).
Fernandes 2010
- Fernandes RA, Zanesco A. Early physical activity promotes lower prevalence of chronic diseases in adulthood. Hypertension Research 2010;33(9):926-31. [DOI] [PubMed] [Google Scholar]
Forsetlund 2021
- Forsetlund L, O'Brien MA, Forsén L, Reinar LM, Okwen MP, Horsley T, et al. Continuing education meetings and workshops: effects on professional practice and healthcare outcomes. Cochrane Database of Systematic Reviews 2021, Issue 9. Art. No: CD003030. [DOI: 10.1002/14651858.CD003030.pub3] [DOI] [PMC free article] [PubMed] [Google Scholar]
Foxcroft 2011
- Foxcroft DR, Tsertsvadze A. Universal school-based prevention programs for alcohol misuse in young people. Cochrane Database of Systematic Reviews 2011, Issue 5. Art. No: CD009113. [DOI: 10.1002/14651858.CD009113] [DOI] [PubMed] [Google Scholar]
French 2012
- French SD, Green SE, O'Connor DA, McKenzie JE, Francis JJ, Michie S, et al. Developing theory-informed behaviour change interventions to implement evidence into practice: a systematic approach using the Theoretical Domains Framework. Implementation Science 2012;7:38. [DOI] [PMC free article] [PubMed] [Google Scholar]
Gassner 2022
- Gassner L, Zechmeister-Koss I, Reinsperger I. National strategies for preventing and managing non-communicable diseases in selected countries. Frontiers in Public Health 2022;10:838051. [DOI] [PMC free article] [PubMed] [Google Scholar]
Glasgow 1999
- Glasgow RE, Vogt TM, Boles SM. Evaluating the public health impact of health promotion interventions: the RE-AIM framework. American Journal of Public Health 1999;89(9):1322-7. [DOI] [PMC free article] [PubMed] [Google Scholar]
Glasgow 2012
- Glasgow RE, Vinson C, Chambers D, Khoury MJ, Kaplan RM, Hunter C. National Institutes of Health approaches to dissemination and implementation science: current and future directions. American Journal of Public Health 2012;102(7):1274-81. [DOI] [PMC free article] [PubMed] [Google Scholar]
Greene 2008
- Greene J, Speizer H, Wiitala W. Telephone and web: mixed-mode challenge. Health Services Research 2008;43(1):230-48. [DOI] [PMC free article] [PubMed] [Google Scholar]
Guerra 2014
- Guerra PH, Nobre MR, da Silveira JA, Taddei JA. School-based physical activity and nutritional education interventions on body mass index: a meta-analysis of randomised community trials – Project PANE. Preventive Medicine 2014;61:81-9. [DOI] [PubMed] [Google Scholar]
Harrer 2019
- Harrer M, Cuijpers P, Furukawa T, Ebert DD. dmetar: Companion R Package For The Guide Doing Meta-Analysis in R. R package version 0.0.9000. protect-au.mimecast.com/s/0YaLCwV1x3cOpNVLTRA6X1?domain=dmetar.protectlab.org/. (accessed prior to 12 August 2022).
Hayes 2019
- Hayes G, Dowd KP, MacDonncha C, Donnelly AE. Tracking of physical activity and sedentary behavior from adolescence to young adulthood: a systematic literature review. Journal of Adolescent Health 2019;65(4):446-54. [DOI] [PubMed] [Google Scholar]
Heider 2020
- Heider A, Mang H. Effects of monetary incentives in physician groups: a systematic review of reviews. Applied Health Economics and Health Policy 2020;18(5):655-67. [DOI] [PMC free article] [PubMed] [Google Scholar]
Higgins 2011
- Higgins JP, Green S, editor(s). Cochrane Handbook for Systematic Reviews of Interventions Version 5.1.0 (updated March 2011). The Cochrane Collaboration, 2011. Available from training.cochrane.org/handbook/archive/v5.1/.
Higgins 2019
- Higgins JP, Thomas J, Chandler J, Cumpston M, Li T, Page MJ, et al. Cochrane Handbook for Systematic Reviews of Interventions. 2nd edition. Chichester (UK): John Wiley & Sons, 2019. [Google Scholar]
Hodder 2017
- Hodder RK, Freund M, Wolfenden L, Bowman J, Nepal S, Dray J, et al. Systematic review of universal school-based 'resilience' interventions targeting adolescent tobacco, alcohol or illicit substance use: a meta-analysis. Preventive Medicine 2017;100:248-68. [DOI] [PubMed] [Google Scholar]
Hoomans 2014
- Hoomans T, Severens JL. Economic evaluation of implementation strategies in health care. Implementation Science 2014;9(1):168. [DOI] [PMC free article] [PubMed] [Google Scholar]
Institute for Health 2020
- Institute for Health Metrics Evaluation. Global Burden of Disease Study 2019. Lancet 2020;396(10258):1129-306. [DOI] [PMC free article] [PubMed] [Google Scholar]
Jacob 2021
- Jacob CM, Hardy-Johnson PL, Inskip HM, Morris T, Parsons CM, Barrett M, et al. A systematic review and meta-analysis of school-based interventions with health education to reduce body mass index in adolescents aged 10 to 19 years. International Journal of Behavioral Nutrition and Physical Activity 2021;18(1):1. [DOI] [PMC free article] [PubMed] [Google Scholar]
Jaime 2009
- Jaime PC, Lock K. Do school based food and nutrition policies improve diet and reduce obesity? Preventive Medicine 2009;48(1):45-53. [DOI] [PubMed] [Google Scholar]
Kayaba 2005
- Kayaba K, Wakabayashi C, Kunisawa N, Shinmura H, Yanagawa H. Implementation of a smoke-free policy on school premises and tobacco control as a priority among municipal health promotion activities: nationwide survey in Japan. American Journal of Public Health 2005;95(3):420-2. [DOI] [PMC free article] [PubMed] [Google Scholar]
Khoury 2010
- Khoury MJ, Gwinn M, Ioannidis JP. The emergence of translational epidemiology: from scientific discovery to population health impact. American Journal of Epidemiology 2010;172(5):517-24. [DOI] [PMC free article] [PubMed] [Google Scholar]
Kremser 2011
- Kremser W. Phases of school health promotion implementation through the lens of complexity theory: lessons learnt from an Austrian case study. Health Promotion International 2011;26(2):136-47. [DOI] [PubMed] [Google Scholar]
Lane 2021
- Lane C, McCrabb S, Nathan N, Naylor P, Bauman A, Milat A, et al. How effective are physical activity interventions when they are scaled-up: a systematic review. International Journal of Behavioral Nutrition and Physical Activity 2021;18(1):16. [DOI] [PMC free article] [PubMed] [Google Scholar]
Lau 2015
- Lau R, Stevenson F, Ong BN, Dziedzic K, Treweek S, Eldridge S, et al. Achieving change in primary care – effectiveness of strategies for improving implementation of complex interventions: systematic review of reviews. BMJ Open 2015;5:12. [DOI] [PMC free article] [PubMed] [Google Scholar]
Lee 2018
- Lee H, Hall A, Nathan N, Reilly KL, Seward K, Williams CM, et al. Mechanisms of implementing public health interventions: a pooled causal mediation analysis of randomised trials. Implementation Science 2018;13(1):42. [DOI] [PMC free article] [PubMed] [Google Scholar]
Lewis 2021
- Lewis CC, Hannon PA, Klasnja P, Baldwin L, Hawkes R, Blackmer JJ, et al. Optimizing Implementation in Cancer Control (OPTICC): protocol for an implementation science center. Implementation Science Communications 2021;2(1):44. [DOI] [PMC free article] [PubMed] [Google Scholar]
Liu 2019
- Liu Z, Xu HM, Wen LM, Peng YZ, Lin LZ, Zhou S, et al. A systematic review and meta-analysis of the overall effects of school-based obesity prevention interventions and effect differences by intervention components. International Journal of Behavioural Nutrition and Physical Activity 2019;16(1):95. [DOI] [PMC free article] [PubMed] [Google Scholar]
MacDonald 2016
- MacDonald M, Pauly B, Wong G, Schick-Makaroff K, Roode T, Strosher HW, et al. Supporting successful implementation of public health interventions: protocol for a realist synthesis. Systematic reviews 2016;5:54-54. [DOI] [PMC free article] [PubMed] [Google Scholar]
Martin 2017
- Martin R, Murtagh EM. Effect of active lessons on physical activity, academic, and health outcomes: a systematic review. Research Quarterly for Exercise and Sport 2017;88(2):149-68. [DOI] [PubMed] [Google Scholar]
May 2018
- May CR, Cummings A, Girling M, Bracher M, Mair FS, May CM, et al. Using Normalization Process Theory in feasibility studies and process evaluations of complex healthcare interventions: a systematic review. Implementation Science 2018;13(1):80. [DOI] [PMC free article] [PubMed] [Google Scholar]
Mazza 2013
- Mazza D, Bairstow P, Buchan H, Paubrey Chakraborty S, Hecke O, Grech C, et al. Refining a taxonomy for guideline implementation: results of an exercise in abstract classification. Implementation Science 2013;8(32):1-10. [DOI] [PMC free article] [PubMed] [Google Scholar]
McCrabb 2019
- McCrabb S, Lane C, Hall A, Milat A, Bauman A, Sutherland R, et al. Scaling-up evidence-based obesity interventions: a systematic review assessing intervention adaptations and effectiveness and quantifying the scale-up penalty. Obesity Reviews 2019;20(7):964-82. [DOI] [PubMed] [Google Scholar]
McFadyen 2018
- McFadyen T, Chai LK, Wyse R, Kingsland M, Yoong SL, Clinton-McHarg T, et al. Strategies to improve the implementation of policies, practices or programmes in sporting organisations targeting poor diet, physical inactivity, obesity, risky alcohol use or tobacco use: a systematic review. BMJ Open 2018;8(9):e019151. [DOI] [PMC free article] [PubMed] [Google Scholar]
McKenzie 2022a
- McKenzie JE, Brennan SE, Ryan RE, Thomson HJ, Johnston RV, Thomas J. Chapter 3: Defining the criteria for including studies and how they will be grouped for the synthesis. In: Higgins JP, Thomas J, Chandler J, Cumpston M, Li T, Page MJ, et al, editor(s). Cochrane Handbook for Systematic Reviews of Interventions Version 6.3 (updated February 2022). Cochrane, 2022. Available from training.cochrane.org/handbook.
McKenzie 2022b
- McKenzie JE, Brennan SE. Chapter 12: Synthesizing and presenting findings using other methods. In: Higgins JP, Thomas J, Chandler J, Cumpston M, Li T, Page MJ, et al, editor(s). Cochrane Handbook for Systematic Reviews of Interventions Version 6.3 (updated February 2022). Cochrane, 2022. Available from www.training.cochrane.org/handbook.
Micha 2018
- Micha R, Karageorgou D, Bakogianni I, Trichia E, Whitsel LP, Story M, et al. Effectiveness of school food environment policies on children's dietary behaviors: a systematic review and meta-analysis. PLoS One 2018;13(3):e0194555. [DOI] [PMC free article] [PubMed] [Google Scholar]
Microsoft Corporation 2013 [Computer program]
- Microsoft Excel. Microsoft Corporation, 2013. Available at office.microsoft.com/excel.
Ministry of Health 2011
- Ministry of Health. Strategic Action Plan to Tackle Noncommunicable Diseases (NCD) in Brazil 2011–2022. Brazil 2011.
Murray 2020
- Murray CJ, Aravkin AY, Zheng P, Abbafati C, Abbas KM, Abbasi-Kangevari M, et al. Global burden of 87 risk factors in 204 countries and territories, 1990–2013; 2019: a systematic analysis for the Global Burden of Disease Study 2019. Lancet 2020;396(10258):1223-49. [DOI] [PMC free article] [PubMed] [Google Scholar]
Nathan 2018
- Nathan N, Elton B, Babic M, McCarthy N, Sutherland R, Presseau J, et al. Barriers and facilitators to the implementation of physical activity policies in schools: a systematic review. Preventive Medicine 2018;107:45-53. [DOI] [PubMed] [Google Scholar]
Nathan 2020
- Nathan NK, Sutherland RL, Hope K, McCarthy NJ, Pettett M, Elton B, et al. Implementation of a school physical activity policy improves student physical activity levels: outcomes of a cluster-randomized controlled trial. Journal of Physical Activity and Health 2020;17(10):1009-18. [DOI] [PubMed] [Google Scholar]
Naylor 2015
- Naylor PJ, Nettlefold L, Race D, Hoy C, Ashe MC, Higgins JW, et al. Implementation of school based physical activity interventions: a systematic review. Preventive Medicine 2015;31(72):95-115. [DOI] [PubMed] [Google Scholar]
NSW Government 2021
- NSW Government. Policy Standards: Implementation Document for Curriculum Planning and Programming, Assessing and Reporting to Parents K-12. 2021 September. Report No: PD-2005-0290-01-V09.3.1. Sydney (NSW): NSW Department of Education, 2021. [Google Scholar]
Pettigrew 2012
- Pettigrew S, Pescud M, Donovan RJ. Outcomes of the West Australian school healthy food and drink policy. Nutrition & Dietetics 2012;69(1):20-5. [Google Scholar]
Powell 2015
- Powell BJ, Waltz TJ, Chinman MJ, Damschroder LJ, Smith JL, Matthieu MM, et al. A refined compilation of implementation strategies: results from the Expert Recommendations for Implementing Change (ERIC) project. Implementation Science 2015;10(1):21. [DOI] [PMC free article] [PubMed] [Google Scholar]
Pradhan 2021
- Pradhan A, Oswal K, Adhikari K, Singh A, Kanodia R, Sethuraman L, et al. Key drivers to implement an evidence-based tobacco control programme in schools of India: a mixed-methods study. Asian Pacific Journal of Cancer Prevention 2021;22(2):419. [DOI] [PMC free article] [PubMed] [Google Scholar]
Proctor 2013
- Proctor EK, Powell BJ, McMillen JC. Implementation strategies: recommendations for specifying and reporting. Implementation Science 2013;8:139. [DOI] [PMC free article] [PubMed] [Google Scholar]
Rabin 2008
- Rabin BA, Brownson RC, Haire-Joshu D, Kreuter MW, Weaver NL. A glossary for dissemination and implementation research in health. Journal of Public Health Management and Practice 2008;14(2):117-23. [DOI] [PubMed] [Google Scholar]
Rabin 2010
- Rabin BA, Glasgow RE, Kerner JF, Klump MP, Brownson RC. Dissemination and implementation research on community-based cancer prevention: a systematic review. American Journal of Preventive Medicine 2010;38(4):443-56. [DOI] [PubMed] [Google Scholar]
Rankin 2018
- Rankin A, Cadogan C, Ryan C, Clyne B, Smith SM, Hughes C. Development of a core outcome set for use in interventions aimed at improving appropriate polypharmacy in older people in primary care. International Journal of Pharmacy Practice 2018;26(Suppl 1):6-7. [Google Scholar]
Rapley 2018
- Rapley T, Girling M, Mair FS, Murray E, Treweek S, McColl E, et al. Improving the normalization of complex interventions: part 1 – development of the NoMAD instrument for assessing implementation work based on Normalization Process Theory (NPT). BMC Medical Research Methodology 2018;18(1):133. [DOI] [PMC free article] [PubMed] [Google Scholar]
R Core Team 2021 [Computer program]
- R: a language and environment for statistical computing. R Core Team. Vienna, Austria: R Foundation for Statistical Computing, 2021. Available at www.R-project.org.
Rehfuess 2019
- Rehfuess EA, Stratil JM, Scheel IB, Portela A, Norris SL, Baltussen R. The WHO-INTEGRATE evidence to decision framework version 1.0: integrating WHO norms and values and a complexity perspective. BMJ Global Health 2019;4(Suppl 1):e000844. [DOI] [PMC free article] [PubMed] [Google Scholar]
Reilly 2018
- Reilly KL, Reeves P, Deeming S, Yoong SL, Wolfenden L, Nathan N, et al. Economic analysis of three interventions of different intensity in improving school implementation of a government healthy canteen policy in Australia: costs, incremental and relative cost effectiveness. BMC Public Health 2018;18(1):1-9. [DOI] [PMC free article] [PubMed] [Google Scholar]
Review Manager 2020 [Computer program]
- Review Manager (RevMan). Version 5.4. Copenhagen: The Cochrane Collaboration, 2020.
Ronto 2020
- Ronto R, Rathi N, Worsley A, Sanders T, Lonsdale C, Wolfenden L. Enablers and barriers to implementation of and compliance with school-based healthy food and beverage policies: a systematic literature review and meta-synthesis. Public Health Nutrition 2020;23(15):2840-55. [DOI] [PMC free article] [PubMed] [Google Scholar]
Russ 2016
- Russ LB, Webster CA, Beets MW, Egan C, Weaver RG, Harvey R, et al. Development of the System for Observing Student Movement in Academic Routines and Transitions (SOSMART). Health Education & Behavior 2016;44(2):304-15. [DOI] [PubMed] [Google Scholar]
Sutherland 2022
- Sutherland RL, Jackson JK, Lane C, McCrabb S, Nathan NK, Yoong SL, et al. A systematic review of adaptations and effectiveness of scaled-up nutrition interventions. Nutrition Reviews 2022;80(4):962-79. [DOI] [PMC free article] [PubMed] [Google Scholar]
Tang 2021
- Tang MY, Rhodes S, Powell R, McGowan L, Howarth E, Brown B, et al. How effective are social norms interventions in changing the clinical behaviours of healthcare workers? A systematic review and meta-analysis. Implementation Science 2021;16(1):8. [DOI] [PMC free article] [PubMed] [Google Scholar]
Thomas 2013
- Thomas RE, McLellan J, Perera R. School-based programmes for preventing smoking. Cochrane Database of Systematic Reviews 2013, Issue 4. Art. No: CD001293. [DOI: 10.1002/14651858.CD001293.pub3] [DOI] [PMC free article] [PubMed] [Google Scholar]
Tuti 2017
- Tuti T, Nzinga J, Njoroge M, Brown B, Peek N, English M, et al. A systematic review of electronic audit and feedback: intervention effectiveness and use of behaviour change theory. Implementation Science 2017;12(1):61. [DOI] [PMC free article] [PubMed] [Google Scholar]
van der Pols 2007
- Pols JC, Bain C, Gunnell D, Davey Smith G, Frobisher C, Martin RM. Childhood dairy intake and adult cancer risk: 65-y follow-up of the Boyd Orr cohort. American Journal of Clinical Nutrition 2007;86(6):1722-9. [DOI] [PubMed] [Google Scholar]
Viechtbauer 2010
- Viechtbauer W. Conducting Meta-Analyses in R with the metafor Package. Journal of Statistical Software 2010;36(3):1-48. [DOI: ] [Google Scholar]
Vine 2021
- Vine MM, Vermeer J, Romano L, Harrington DW, Butler AE, Patte KA, et al. Secondary school nutrition policy compliance in Ontario and Alberta, Canada: a follow-up study examining vending machine data from the COMPASS study. International Journal of Environmental Research and Public Health 2021;18(7):3817. [DOI] [PMC free article] [PubMed] [Google Scholar]
Waller 2017
- Waller G, Finch T, Giles EL, Newbury-Birch D. Exploring the factors affecting the implementation of tobacco and substance use interventions within a secondary school setting: a systematic review. Implementation Science 2017;12(1):130. [DOI] [PMC free article] [PubMed] [Google Scholar]
Waters 2011
- Waters E, Sliva-Sanigorski A, Hall BJ, Brown T, Campbell KJ, Gao Y, et al. Interventions for preventing obesity in children. Cochrane Database of Systematic Reviews 2011, Issue 12. Art. No: CD001871. [DOI: 10.1002/14651858.CD001871.pub3] [DOI] [PubMed] [Google Scholar]
Webster 2015
- Webster CA, Beets M, Weaver RG, Vazou S, Russ L. Rethinking recommendations for implementing comprehensive school physical activity programs: a Partnership Model. Quest 2015;67(2):185-202. [Google Scholar]
Weres 2022
- Weres A, Baran J, Czenczek-Lewandowska E, Leszczak J, Mazur A. The association between steps per day and blood pressure in children. Scientific Reports 2022;12(1):1422. [DOI] [PMC free article] [PubMed] [Google Scholar]
WHO 2011
- World Health Organization. Global status report on noncommunicable diseases 2010. www.who.int/nmh/publications/ncd_report2010/en/ (accessed prior to 12 August 2022).
WHO 2012
- World Health Organization. Population-based approaches to childhood obesity prevention. 2012. Global Strategy on Diet, Physical Activity and Health. apps.who.int/iris/bitstream/handle/10665/80149/9789241504782_eng.pdf (accessed prior to 12 August 2022).
WHO 2017
- World Health Organization. Report of the Commission on Ending Childhood Obesity. Implementation plan: executive summary, 2017. apps.who.int/iris/handle/10665/259349 (accessed prior to 12 August 2022).
WHO 2021
- World Health Organization. Noncommunicable diseases. www.who.int/news-room/fact-sheets/detail/noncommunicable-diseases (accessed prior to 12 August 2022).
Wiggin 2021
- Wiggin DA, Timmons S, Rukundo A, Walsh KA. Improving the appropriateness of psychotropic prescribing for nursing home residents with dementia: an overview of reviews. Aging & Mental Health 2021;26(6):1087-94. [DOI: 10.1080/13607863.2021.1922601] [DOI] [PubMed] [Google Scholar]
Wolfenden 2010
- Wolfenden L, Wiggers J, Tursan d'Espaignet E, Bell AC. How useful are systematic reviews of child obesity interventions? Obesity Reviews 2010;11:159-65. [DOI] [PubMed] [Google Scholar]
Wolfenden 2015
- Wolfenden L, Ziersch A, Robinson P, Lowe J, Wiggers J, Lowe J. Reducing research waste and improving research impact. Australian and New Zealand Journal of Public Health 2015;39(4):303-4. [DOI] [PubMed] [Google Scholar]
Wolfenden 2016
- Wolfenden L, Jones J, Williams CM, Finch M, Wyse RJ, Kingsland M, et al. Strategies to improve the implementation of healthy eating, physical activity and obesity prevention policies, practices or programmes within childcare services. Cochrane Database of Systematic Reviews 2016, Issue 10. Art. No: CD011779. [DOI: 10.1002/14651858.CD011779.pub2] [DOI] [PMC free article] [PubMed] [Google Scholar]
Wolfenden 2016a
- Wolfenden L, Milat AJ, Lecathelinais C, Skelton E, Clinton-McHarg T, Williams C, et al. A bibliographic review of public health dissemination and implementation research output and citation rates. Preventive Medicine Reports 2016;4:441-3. [DOI] [PMC free article] [PubMed] [Google Scholar]
Wolfenden 2017
- Wolfenden L, Nathan NK, Sutherland R, Yoong SL, Hodder RK, Wyse RJ, et al. Strategies for enhancing the implementation of school-based policies or practices targeting risk factors for chronic disease. Cochrane Database of Systematic Reviews 2017, Issue 11. Art. No: CD011677. [DOI: 10.1002/14651858.CD011677.pub2] [DOI] [PMC free article] [PubMed] [Google Scholar]
Wolfenden 2018
- Wolfenden L, Goldman S, Stacey FG, Grady A, Kingsland M, Williams CM, et al. Strategies to improve the implementation of workplace-based policies or practices targeting tobacco, alcohol, diet, physical activity and obesity. Cochrane Database of Systematic Reviews 2018, Issue 11. Art. No: CD012439. [DOI: 10.1002/14651858.CD012439.pub2] [DOI] [PMC free article] [PubMed] [Google Scholar]
Wolfenden 2019
- Wolfenden L, Bolsewicz K, Grady A, McCrabb S, Kingsland M, Wiggers J, et al. Optimisation: defining and exploring a concept to enhance the impact of public health initiatives. Health Research Policy and Systems 2019;17(1):1-13. [DOI] [PMC free article] [PubMed] [Google Scholar]
Wolfenden 2020
- Wolfenden L, Barnes C, Jones J, Finch M, Wyse RJ, Kingsland M, et al. Strategies to improve the implementation of healthy eating, physical activity and obesity prevention policies, practices or programmes within childcare services. Cochrane Database of Systematic Reviews 2020, Issue 2. Art. No: CD011779. [DOI: 10.1002/14651858.CD011779.pub3] [DOI] [PMC free article] [PubMed] [Google Scholar]
Wolfenden 2021
- Wolfenden L, Foy R, Presseau J, Grimshaw JM, Ivers NM, Powell BJ, et al. Designing and undertaking randomised implementation trials: guide for researchers. BMJ 2021;372:m3721. [DOI] [PMC free article] [PubMed] [Google Scholar]