
Figure 2.
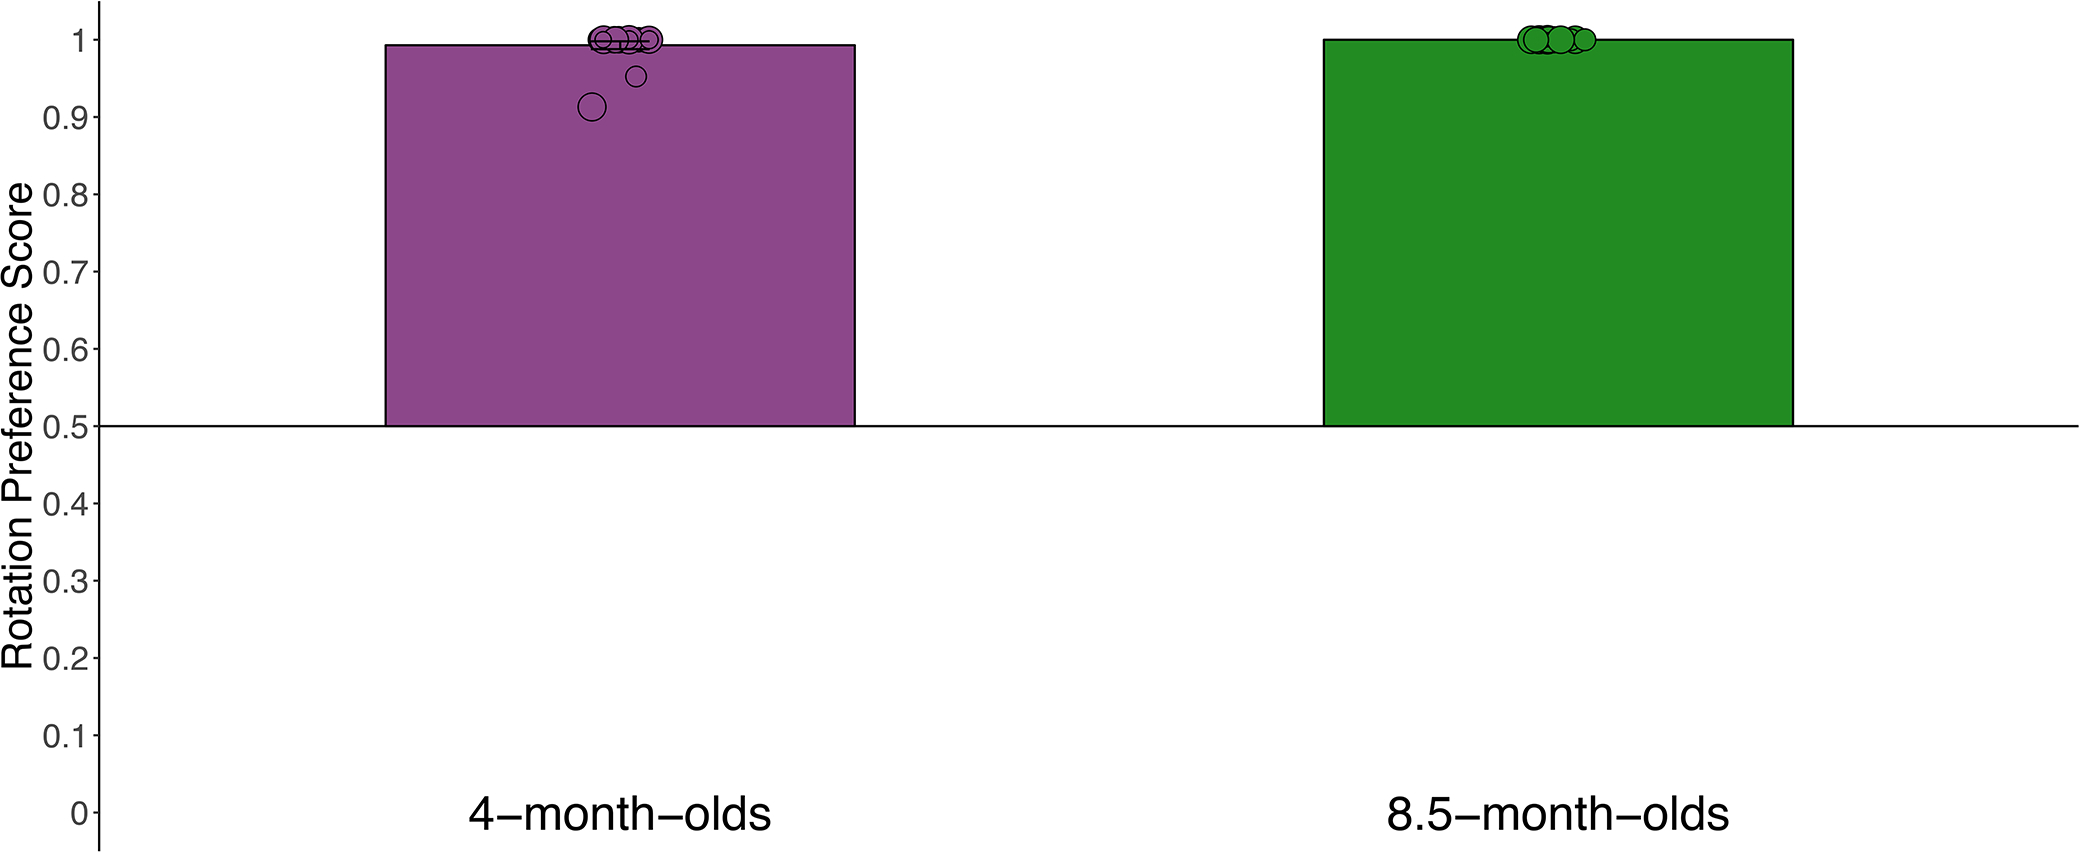
Rotation preference score by age during the attention capture analysis window (200 ms after the onset of the sample array until 200 ms after the onset of the test array) in Experiment 1. The height of the bar represented the mean for each age group, and individual points represent median preference scores for each infant. Error bars—which are difficult to detect due to lack of variability in infants’ responding—represent 95 % confidence intervals and the horizontal line bisecting the y-axis represents chance. Note that all 8.5-month-old infants had a median rotation preference score of 1 so there is no error bar.